Abstract
Blood platelets prepared for transfusion gradually lose hemostatic function during storage. Platelet function can be investigated using a variety of (indirect) in vitro experiments, but none of these is as comprehensive as microfluidic flow chambers. In this protocol, the reconstitution of thrombocytopenic fresh blood with stored blood bank platelets is used to simulate platelet transfusion. Next, the reconstituted sample is perfused in microfluidic flow chambers which mimic hemostasis on exposed subendothelial matrix proteins. Effects of blood donation, transport, component separation, storage and pathogen inactivation can be measured in paired experimental designs. This allows reliable comparison of the impact every manipulation in blood component preparation has on hemostasis. Our results demonstrate the impact of temperature cycling, shear rates, platelet concentration and storage duration on platelet function. In conclusion, this protocol analyzes the function of blood bank platelets and this ultimately aids in optimization of the processing chain including phlebotomy, transport, component preparation, storage and transfusion.
Keywords: Bioengineering, Issue 109, Platelets, microfluidic flow chamber, shear stress, transfusion, blood reconstitution, standardization
Introduction
Hemostasis requires the combined and regulated activity of cells, proteins, ions and tissues in a restricted spatiotemporal context1. Uncontrolled activity may lead to hemorrhage or thrombosis and morbidity or mortality in a spectrum of disorders related to blood coagulation. A microfluidic flow chamber experiment is a challenging technique that mimics hemostasis in vitro. This approach allows investigation of the complex interplay of processes that take part in hemostasis with a leading role for blood platelets.
Following vascular injury, platelets adhere to the exposed subendothelial matrix (glyco)proteins to prevent blood loss. Following adhesion, platelets activate and aggregate in response to auto- and paracrine signaling which finally leads to the formation of a platelet network, stabilized by fibrin and resulting in a firm, wound sealing thrombus2. Unlike most other platelet function tests, experiments with flow chambers take into account the physical parameter of blood flow and therefore the influence of rheology on the participating cells and biomolecules3,4.
Flow chamber experiments have generated landmark insights in hemostasis and thrombosis by varying key parameters that influence hemostatic (sub)processes including the adhesive matrix, rheology and flow profiles, cellular composition, presence of toxins or drugs, ionic strength and many more. In the past two decades, low throughput flow chamber experiments requiring large sample volumes (10-100 ml) have evolved to microfluidic chambers often consisting of small parallel-plate chambers and including modern technology for perfusing whole blood at controlled wall shear conditions5. Microscaling has significantly increased assay throughput mostly because the hardware setup has simplified and less (blood) volume is required, rendering the experiment more accessible and versatile. For instance, blood from small laboratory animals can now be used without the need to sacrifice animals. Blood samples of genetically modified mice have thus aided in the identification of key molecules promoting or inhibiting hemostasis and in novel basic insights6.
Specialized research laboratories often still use custom made flow chambers for instance from polydimethylsiloxane (PDMS)7 that polymerizes on lithographed molds which can be blueprinted by software. The resulting chamber is inexpensive, disposable and can be easily disassembled for post hoc analysis. Furthermore, basically any design of vessels, including bifurcations or sharp turns can be built on command. This advantage is also its downside since standardization was already the primary problem with flow chamber experiments, and PDMS custom made chambers have not aided this. On top of this particular issue, coating (conditions), fluorescent probes, anticoagulant, temperature and time between sampling and analysis are all poorly standardized8. Standardization of these variables is challenging, but nonetheless required to permit comparison of results between laboratories. This topic is the major subject of the International Society on Thrombosis and Haemostasis in Scientific and Standardization subcommittee on Biorheology9,10.
Platelet concentrates (PC) are transfused in patients suffering from various diseases that cause thrombocytopenia and/or bleeding. But platelets in PC are known to desensitize, especially in function of storage time11, a deterioration process linked to ageing and commonly referred to as platelet storage lesion. It is sometimes claimed that such platelets restore in circulation once transfused12, but evidence for this is scarce. Furthermore, the functionality of platelets making up a PC is not routinely tested because the relationship between such assays and therapeutic or prophylactic efficacy is unclear13. Microfluidic flow chambers offer a means to investigate platelet function in PC to optimize the chain of manipulations between collection and issuing. It is a powerful research tool for direct (paired) comparisons of PC as we have previously published14,15 and is described here.
Protocol
This protocol follows the institutional ethical guidelines for research on human samples and informed consent was obtained from all donors involved. Approval for the experiments described here was obtained from the institutional review board of the Antwerp University Hospital.
Note: Temperature indications are always room temperature, unless specified.
1. Preparation Flow Chamber Setup
- Preparing Lanes, Tubing and Pins
- Vortex the collagen suspension vigorously and dilute 1/20 in the isotonic glucose solution supplied by the provider to a final concentration of 50 µg/ml. Note: We use equine tendon collagen, mainly made up of type I fibrils. The equine collagen type I is often referred to as "Horm" collagen and is the golden standard for this type of assay9 for both historical as well as biological reasons. Human type III collagen can also be used, but the fibrils coat less well and the platelet response is not as strong. Other coating surfaces can also be used, for example von Willebrand Factor (VWF), fibrinogen, fibronectin, laminin, vitronectin, thrombospondin-1 or combinations of these16.
- Take a new disposable biochip from the provider's container. The dimensions of the biochips used here are 0.4W x 0.1H x 20L in mm3.
- Pipet 0.8 µl into the lane(s) of the microfluidic biochip on one end of the chip and mark as outlet. Make sure that the lane is filled 5/6th with the collagen containing coating solution prepared in 1.1.1. Ensure that there are no air bubbles. Note: Channels are partially coated to avoid accumulation of collagen fibers at the entrance of the channel (see discussion).
- Incubate at 4 °C for 4 hr or overnight in a humidified and closed container.
- Block the coated channels by pipetting blocking buffer (1.0% (w/v) bovine serum albumin and 0.1% (w/v) glucose in 10 mM 4-(2-hydroxyethyl)-1-piperazineethanesulfonic acid (HEPES) buffered saline (HBS; 0.9% (w/v) NaCl, pH 7.4) at the other end and mark as inlet. Make sure that the lane is completely filled with the blocking buffer avoiding air bubbles.
- Cut tubing at equal length (12 cm). Use one per lane and connect each tubing with a pin. For example, an experiment comparing two conditions, run in duplicate will require four tubing stretches and four pins to be prepared.
- Rinse the tubing with distilled water using a syringe and a 26 G needle or the accompanying connectors.
- Saturate the tubing with blocking buffer. Store in a closed and humidified container for a minimum of 1 hr.
- Preparing Pump and Manifold
- Rinse the pump and manifold with distilled water, remove air bubbles.
- Aspirate the blocking buffer out of the biochip lane(s) using the fixed 10 µl tip at the outlet. Clean the surface of the biochip with a precision dust free wipe and denaturated alcohol to remove prints and dust.
- Fix the biochip on an automated microscope stage. If more than one lane is used simultaneously in one run, connect the eight-lane manifold splitter to the biochip outlet. Note: The eight-lane manifold splitter is a piece of hardware (Figure S1) connected to the pump and the biochip. It allows operation of all available (eight) lanes on a biochip or a combination of lanes which can be operator-defined in the accompanying software.
- Use the pins in the tubing to fix them in the biochip inlet. Place the other end of the tubing (without pin) in a 1.5 ml conical test tube filled with HBS. Rinse all tubing and their connected lanes with 1 ml HBS using the pump, so as to remove remainder blocking buffer and poorly adhering collagen.
2. Preparation of Blood Samples
- Collection and separation of fresh whole blood from a healthy volunteer.17
- Collect the first milliliters of blood in an evacuated tube containing Ethylenediaminetetraacetic acid (EDTA) as an anticoagulant and exclusively use this sample for complete blood count (CBC) with an automated hematology analyzer.
- Collect a volume of blood in a suitable anticoagulant using evacuated tubes. Standard anticoagulants for flow chamber experiments are heparin or hirudin when fibrin formation is not part of the study protocol and sodium citrate when it is. Note: Heparin was used as an anticoagulant for all the experiments described in the results. Note: The amount of blood depends on the number of experiments to be performed. Approximately 1 tube (7 ml) for 3 lanes.
- Place the tubes on a rotator pending blood reconstitution. Note: The assay should be completed within 3 hr of phlebotomy.
- Centrifuge for 15 min at 250 g to prepare platelet rich plasma (PRP). Do not use the centrifuge break to prevent disturbance of the loosely packed pellet.
- When more than one tube was collected, pool the blood in a single conical centrifugation tube. Note: Centrifugation can be done more slowly or less long, depending on the PRP yield and differential cell "contamination" preferred.
- Remove and discard the PRP and buffy coat yielding packed red blood cells with few platelets. Note: The platelet count in the packed red cell fraction is 13 ±5 x 10³ per µl (mean ±SD, n = 12) on average in our hands.
- Blood Reconstitution
- Thaw blood group AB (Rhesus D negative) plasma at 37 °C for 5 min and 20 sec per 4 ml.
- Determine the hematocrit of the packed red blood cells prepared in 2.1.5 using an automated hematology analyzer.
- Determine the platelet concentration in the blood bank prepared platelet concentrate that will be used to reconstitute the red cell fraction above.
- Calculate the volume of packed red blood cells and platelet concentrate that will yield 40% hematocrit and 250 x 10³ platelets/µl in a 1 ml sample. Note: Other target titers of cells can be set arbitrarily, depending on the study protocol.
- Transfer packed red blood cells and plasma into a fresh tube using a clipped pipet tip and add platelet concentrate until a sample volume of 1 ml is reached. Note: Depending on the variables studied, the plasma fraction should be equal in all reconstituted samples because plasma has a significant influence on thrombus formation rate. For instance, repeated freeze-thawing or plasma taken from different donors or on different anticoagulants may influence the result.
- Mix the reconstituted blood gently by inverting and perform a CBC.
- Prepare a "blank" control sample in which the volume of platelet fraction is replaced by the same volume of 0.9% (m/v) sodium chloride in water to determine the concentration of endogenous platelets (i.e. non-blood bank platelets) in the reconstituted blood using a CBC.
- Labeling
- Pipet 1 ml reconstituted blood in a test tube containing 1 µl 5 mM Calcein AM (5 µM final concentration). Note: Other cell dyes can be used14.
- Mix gently by inverting.
- Incubate for 5 min at 37 °C prior to use.
3. Perfusion Assay
Focus the objective on the collagen fibers adhered at the bottom of the lanes. Ideally, use phase-contrast or differential interference contrast (DIC) settings for this focusing strategy. Select ‘Set current Z for selected tile regions’ in the experiment software to digitally fix the selected Z-positions.
Select a region of interest (ROI) in the lane (xy) in the experiment software of the microscope that will be recorded during the experiment. Note: The ROI can be any surface area arbitrarily chosen within a perfusion lane. It is advisable not to analyze thrombus formation close to the in- and outlet of a lane so to avoid side effects of the variable flow profile in that region, even though this is relatively small. The ROI surface area should contain a significant number of platelets or thrombi to allow leveling of the signal. In this protocol the ROI is a digitally stitched aggregate of three equally sized side-by-side images resulting in 0.62 mm2 in the middle of the 2 cm long lane.
Mix the samples gently by inverting and position these next to the biochip on the automated stage.
Place the tubing that is connected with the inlet of the biochip in the test tubes containing the reconstituted blood samples.
Launch the pump at 50 dyne/cm2 (or other shear stresses as desired) for those channels linked to test tubes containing the reconstituted blood samples using the software of the pump. Note: Other shear stresses can be used.
Record images every 15 sec for 5 min in real-time using the acquisition and experiment software of the microscope. Note: Other time series can be used depending on the experimental set-up. Note: We generally use a 100X magnification (10X objective and 10X lenses), but higher (or lower) magnification can easily be used as an alternative.
4. Wash Out
Wash out all tubing attached to the outlet and connected to the multichannel manifold or pump using distilled water, followed by sodium hypochlorite (bleach) 0.5% (v/v) and finally 0.1 M NaOH in water. Discard the tubing pinned to the biochip inlet as hazardous waste.
5. Data Analysis
- Determine thrombus growth kinetics with the image analysis software. The following commands are specific for ZEN2012.
- Open the plugin Image Analysis to determine the surface coverage of the platelets.
- Set the fluorescence threshold in the Analyze Interactive tab to define the pixel intensity that correlates with a positive signal, i.e. an adhered platelet or adhering platelets.
- Use Create Tables to automatically generate a spreadsheet that will contain the separate surface areas (in µm2) of those "objects" containing pixels with a signal between the selected thresholds. This is performed for each time point. Note: Once fluorescence thresholds have been chose, the analysis software automatically detects 'objects' in the view field that fulfill the criteria. These objects are thrombi, small platelet aggregates or single platelets and cover a number of pixels. Every object is listed in the spreadsheet separately.
- Save these spreadsheets in xml format and open them in a spreadsheet program for further calculations.
- Total the surface areas of the selected objects by summation and divide the result by the total area of the measurement field (µm2). This will yield the relative surface coverage (%). Do so for every time point.
- Plot these surface coverages in function of the perfusion time and calculate the slope by linear regression, yielding the thrombus growth kinetic of that particular condition.
Representative Results
To demonstrate intra-assay variation, three identical reconstituted whole blood samples were perfused simultaneously over collagen coated surfaces (Figure 1). This resulted in a coefficient of variation of 8.7%. This statistic suggests acceptable intra-assay and intralaboratory variation permitting reliable comparison between related samples.
The inlet of the commercial flow chamber we describe here is perpendicular to the measurement chamber and this can cause slightly turbulent instead of laminar flow at that point. Especially in experiments without anticoagulation this may cause clogging because of the increased contact time between the blood and the immobilized agonist. The clogged inlet can confound the readout downstream in the chamber. Therefore, the setup was optimized by partially coating the flow chamber (Figure 2) leaving the inlets devoid of platelet agonist, thereby avoiding untimely activation of primary and secondary hemostasis. Partial coating of adhesive surfaces is moreover successfully used by other research groups in the field16. In addition, this straightforward practical trick is an asset to study the "transition" zone where blood flowing over the non-reactive (uncoated) surface continues over the reactive (coated) portion.
Transfusion was simulated by reconstituting blood with the deficient component. To this purpose, anticoagulated whole blood from a healthy donor was rendered thrombocytopenic by differential centrifugation and PC platelets were added to increase platelet counts. An important question here was what platelet count to aim for? In most cases, real-life transfusions do not result in normalization of platelet counts in the thrombocytopenic patient. Rather a value above a certain threshold is aimed for, although the exact target value is ill-defined19. To understand the influence of varying platelet counts on microfluidic flow chambers outcomes in the context of blood reconstitution, several reconstitutions were performed with decreasing platelet concentrations (Figure 3). As expected, lower platelet counts resulted in less adhesion in function of perfusion time. Therefore, within a given study, platelet counts should be standardized to permit comparison between sample conditions20. The mere fact that there is fewer adhesion when platelet counts are low does however not imply that the assay cannot be used to measure platelet deposition in thrombocytopenic samples because microscopy and camera settings can be adapted to increase sensitivity. Finally, in most cases, the thrombocytopenic sample used for reconstitution contains remainder autologous platelets which resembles the situation in most transfusion demanding patients19. It is currently unclear if and what the role of autologous platelets is in the context of transfusion with allogeneic platelets but is an interesting question for future research.
Following collection of blood from healthy voluntary donors, whole blood is often cooled to and kept at constant room temperature prior to component preparation. Platelets are however sensitive to temperature changes. Figure 4 shows the effect of decreased temperatures after blood collection and during perfusion. Thrombi were found to build more slowly when the blood was cooled to room temperature (Figure 4A) compared to an identical (paired) sample kept at 37 °C throughout the study (Figure 4B).
In circulation, platelets bind to vessel injury sites in conditions of elevated wall shear stress. Varying shear rates in microfluidic flow chambers coated with VWF/fibrinogen resulted in differences for total platelet adhesion at end point (Figure 5A) and for thrombus growth kinetics (Figure 5B).
Finally, to demonstrate how microfluidic flow chambers can be used to investigate PC used for transfusion, thrombus growth kinetics in function of PC storage was investigated. All variables in sample preparation and experimental set-up were standardized throughout the study period. Hence, the sole variable parameter was PC storage time. Figure 6 indicates decreasing thrombus growth in function of storage time demonstrating the effect of platelet storage lesion on hemostasis in vitro.
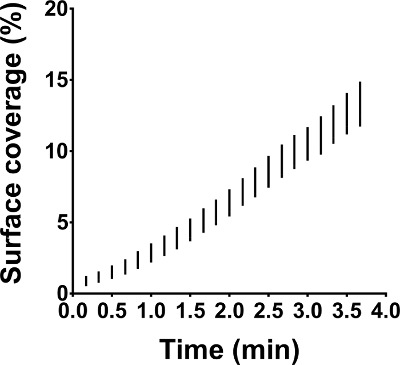 Figure 1: Intra-assay variation in microfluidic flow chamber experiments. Microfluidic flow chamber experiments were performed on immobilized collagen at 50 dynes/cm². All three identical reconstituted whole blood samples were perfused in parallel and at the same time. The results are shown as range (whiskers) for surface coverage in function of perfusion time. Please click here to view a larger version of this figure.
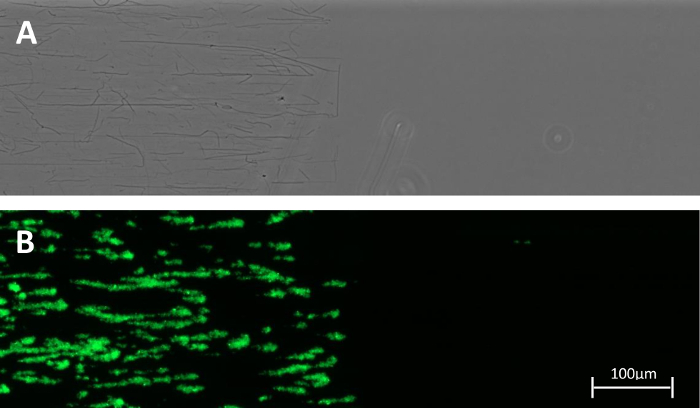 Figure 2: Partially coated channel. (A) Collagen fibers visualized by phase contrast microscopy were found only in the coated region. (B) A snapshot after 5 min of perfusion with a Calcein AM labeled reconstituted whole blood sample pumped at 50 dynes/cm2 is shown. Both images were taken at a 100X magnification. Please click here to view a larger version of this figure.
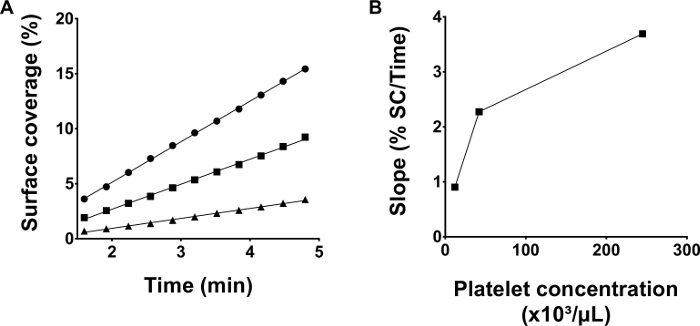 Figure 3: Thrombus growth kinetics depend on platelet counts in reconstituted blood. (A) Blood was reconstituted using a blood bank platelet concentrate yielding different platelet concentrations: 245 x 10³ /µl (●), 42 x 10³ /µl (■) and 12 x 10³/µl (▲). Microfluidic flow chamber experiments with collagen coated channels were performed simultaneously for all three samples at a shear stress of 50 dynes/cm². (B) The slopes calculated by linear regression of the raw data in panel A are depicted. Please click here to view a larger version of this figure.
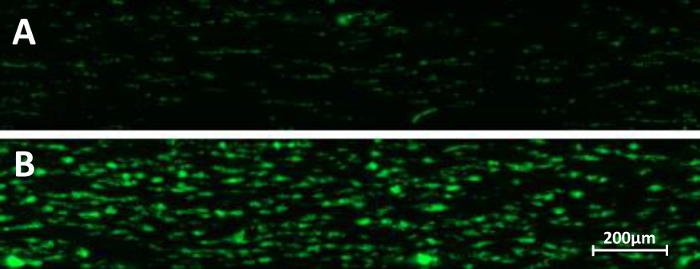 Figure 4: Temperature and microfluidic flow chambers. Whole blood collected in heparin vacutainers was preserved for 15 min in a water bath at room temperature (A) or at 37 °C (B). Microfluidic perfusion on immobilized collagen at a shear stress of 50 dynes/cm2 was performed. Snap shots at end point (5 min perfusion) are depicted. Please click here to view a larger version of this figure.
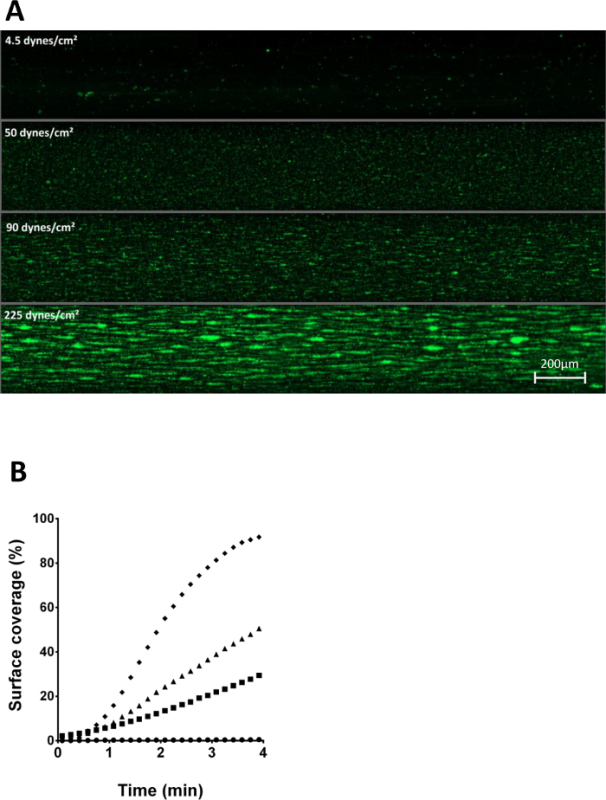 Figure 5: Role of shear stress on platelet adhesion to immobilized VWF/fibrinogen. (A)Four identical, calcein AM labeled, reconstituted whole blood samples were perfused over a VWF/fibrinogen coated surface with variable shear stress: 4.5 dynes/cm² (●), 50 dynes/cm² (■), 90 dynes/cm² (▲) and 225 dynes/cm² (♦). After 3 minutes of perfusion, a snap shot was taken of all four channels. (B) Surface coverages in function of time of the samples described in (A) are shown illustrating differences in thrombus growth kinetics. Please click here to view a larger version of this figure.
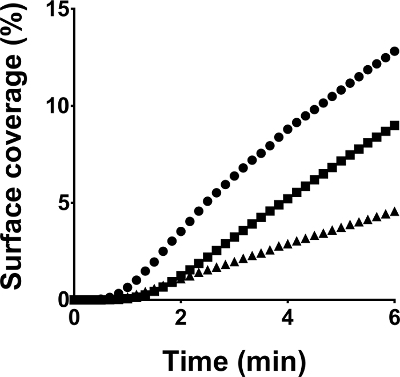 Figure 6: Thrombus formation of platelet concentrates in function of storage time. All microfluidic flow chamber experiments were performed under standardized conditions on collagen coated surfaces at a shear rate of 50 dynes/cm2. Blood was reconstituted with platelet samples of the same concentrate tested in duplicate on day three (●), seven (■) and ten (▲) post donation. Surface coverages in function of perfusion time are depicted. Please click here to view a larger version of this figure.
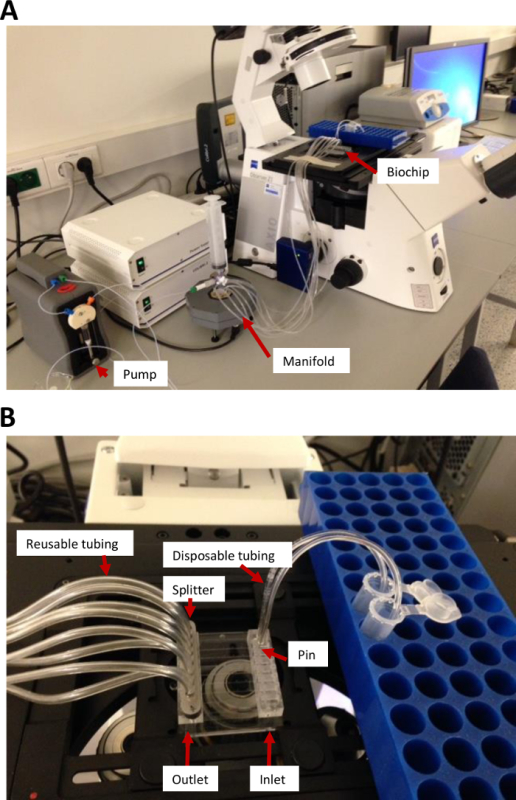
Figure S1: Microfluidic flow chamber hardware setup. (A) A Vena 8 Fluoro+ biochip is mounted on the automated stage of the microscope and is connected via flexible tubing to a syringe pump with manifold to split the pumping function into eight separate channels. (B) Reconstituted blood flows through the disposable tubing on the right side into the selected channels of the biochip (inlet). The disposable tubing is fixed in the inlet through a stainless steel disposable pin supplied with the setup. Blood flow in (B) is from right to left and is collected in long flexible tubings. Please click here to view a larger version of this figure.
Discussion
Microfluidic flow chamber experiments are an excellent tool to investigate platelet function in flowing blood and are used to evaluate hemostasis in vitro in varying experimental contexts. Despite poor interlaboratory standardization9, we demonstrate that within our laboratory the experimental variation is acceptable. This allows to reliably compare (paired) samples within a given study. This was validated using the well documented phenomenon of platelet storage lesion, which is a detrimental consequence of platelet storage in blood bank conditions11. Furthermore, we recently published the impact of three available pathogen inactivation technologies on PC platelet function in microfluidic flow chambers following reconstitution of blood14,15.
Platelets respond differently when biophysical and -chemical parameters are varied20. Therefore, shear stress, cell number and cellular composition, temperature, coating, anticoagulant and many more factors can be modified within this protocol depending on the research question. This protocol uses only commercially available hard- and software tools, allowing other laboratories to perform a similar assay. For basic research purposes this can be a disadvantage especially because the available hardware is less versatile than custom-made setups. The assay in itself is robust but reproducibility suffers from biological and temporal variation. Therefore, assay samples need to be paired as much as possible and study sizes should be sufficiently large. Samples also need to be paired in time, because reconstituted blood can only be stored for a short time.
Although microfluidic flow chambers for platelet function studies have boosted the research field, caution should be taken to overinterpret the platelet dependence on blood rheology. First, the rectangular shape of the flow chamber is not physiologic, but the best we have to allow optical focusing on growing thrombi. Second, blood vessels are not made of plastic and the influence of blood vessel elasticity on platelet function can therefore not be studied in this protocol. Third, the heart causes pulsatile flow, while syringe pumps are more linear (although also slightly pulsatile). Finally, fibrillar type I collagen is the standard material used for platelet studies under flow, which is of animal origin. Of note however, fibrillar type I collagen and clinical results for platelet function correlate well in many cases as shown by decades of experience in (light transmission) aggregometry21,22.
There are many assays to study platelet function23. Most of these address one or a couple of platelet features while putting platelets to work in (models of) hemostasis. Real time imaging of thrombus formation as demonstrated here is the most inclusive, to date. This means most aspects of the platelet's response to vessel injury are included. Unique advantages are the inclusion of blood flow and the presence of all blood cells. The assay is sensitive to the currently used drugs for antiplatelet therapy24 as well as to genetic changes resulting in aberrant platelet function25. This demonstrates its value as a relevant indicator of platelet function. The comprehensive nature of this assay nonetheless also implies that it is less analytical than those assays measuring specific features of the platelet's response. Effects of blood banking manipulations on platelet concentrates can therefore by picked up by flow chamber assays, but to interpret what causes them, additional analysis is required. For instance, our data indicate that temperature significantly influences platelet adhesion in microfluidic flow chambers. But additional detailed analysis has shown that refrigerated platelets change shape and cluster GPIbα receptors26.
The versatility of the adhesive surface permits to study different reactive platelet substrates or combinations thereof. Recent work by De Witt et al.16 demonstrated the relevance of substrate definition to platelet systems biology. Moreover, the combination of varying shear rates in function of the substrate is important because binding of platelets to immobilized VWF will require high shear rates, while this is less important for binding to collagen. Therefore, depending on the research question, choices can be made on what substrates and their respective flow rates are to be included.
In conclusion, we present a protocol for microfluidic flow chamber experiments to study platelet function in the context of blood banking and transfusion medicine. Standardization efforts are ongoing9,10,28-30 and most of these recommendations are included in the protocol presented. The reconstitution of blood is a model for transfusion but additional validation work should indicate the relevance to clinical outcomes.
Disclosures
The authors have nothing to disclose.
Acknowledgments
The authors have no acknowledgements.
References
- Broos K, Feys HB, De Meyer SF, Vanhoorelbeke K, Deckmyn H. Platelets at work in primary hemostasis. Blood Rev. 2011;25:155–167. doi: 10.1016/j.blre.2011.03.002. [DOI] [PubMed] [Google Scholar]
- Stalker TJ, et al. Hierarchical organization in the hemostatic response and its relationship to the platelet-signaling network. Blood. 2013;121:1875–1885. doi: 10.1182/blood-2012-09-457739. [DOI] [PMC free article] [PubMed] [Google Scholar]
- Sakariassen KS, Bolhuis PA, Sixma JJ. Human blood platelet adhesion to artery subendothelium is mediated by factor VIII-Von Willebrand factor bound to the subendothelium. Nature. 1979;279:636–638. doi: 10.1038/279636a0. [DOI] [PubMed] [Google Scholar]
- Savage B, Saldivar E, Ruggeri ZM. Initiation of platelet adhesion by arrest onto fibrinogen or translocation on von Willebrand factor. Cell. 1996;84:289–297. doi: 10.1016/s0092-8674(00)80983-6. [DOI] [PubMed] [Google Scholar]
- Westein E, de Witt S, Lamers M, Cosemans JM, Heemskerk JW. Monitoring in vitro thrombus formation with novel microfluidic devices. Platelets. 2012;23:501–509. doi: 10.3109/09537104.2012.709653. [DOI] [PubMed] [Google Scholar]
- Varga-Szabo D, et al. The calcium sensor STIM1 is an essential mediator of arterial thrombosis and ischemic brain infarction. J Exp Med. 2008;205:1583–1591. doi: 10.1084/jem.20080302. [DOI] [PMC free article] [PubMed] [Google Scholar]
- Westein E, et al. Atherosclerotic geometries exacerbate pathological thrombus formation poststenosis in a von Willebrand factor-dependent manner. Proc Natl Acad Sci USA. 2013. [DOI] [PMC free article] [PubMed]
- Grabowski EF, Yam K, Gerace M. Evaluation of hemostasis in flowing blood. Am J Hematol. 2012;87(Suppl 1):S51–S55. doi: 10.1002/ajh.23207. [DOI] [PubMed] [Google Scholar]
- Roest M, et al. Flow chamber-based assays to measure thrombus formation in vitro: requirements for standardization. J Thromb Haemost. 2011;9:2322–2324. doi: 10.1111/j.1538-7836.2011.04492.x. [DOI] [PubMed] [Google Scholar]
- Heemskerk JWM, et al. Collagen surfaces to measure thrombus formation under flow: possibilities for standardization. J Thromb Haemost. 2011;9:856–858. doi: 10.1111/j.1538-7836.2011.04230.x. [DOI] [PubMed] [Google Scholar]
- Shrivastava M. The platelet storage lesion. Transfus Apher Sci. 2009;41:105–113. doi: 10.1016/j.transci.2009.07.002. [DOI] [PubMed] [Google Scholar]
- Miyaji R, et al. Decreased platelet aggregation of platelet concentrate during storage recovers in the body after transfusion. Transfusion. 2004;44:891–899. doi: 10.1111/j.1537-2995.2004.03214.x. [DOI] [PubMed] [Google Scholar]
- Goodrich RP, et al. Correlation of in vitro platelet quality measurements with in vivo platelet viability in human subjects. Vox Sang. 2006;90:279–285. doi: 10.1111/j.1423-0410.2006.00761.x. [DOI] [PubMed] [Google Scholar]
- Van Aelst B, et al. Riboflavin and amotosalen photochemical treatments of platelet concentrates reduce thrombus formation kinetics in vitro. Vox Sang. 2015;108:328–339. doi: 10.1111/vox.12231. [DOI] [PubMed] [Google Scholar]
- Van Aelst B, Devloo R, Vandekerckhove P, Compernolle V, Feys HB. Ultraviolet c light pathogen inactivation treatment of platelet concentrates preserves integrin activation but affects thrombus formation kinetics on collagen in vitro. Transfusion. 2015. [DOI] [PubMed]
- de Witt SM, et al. Identification of platelet function defects by multi-parameter assessment of thrombus formation. Nat Commun. 2014;5:4257. doi: 10.1038/ncomms5257. [DOI] [PMC free article] [PubMed] [Google Scholar]
- Cazenave JP, et al. Preparation of washed platelet suspensions from human and rodent blood. Methods Mol Biol. 2004;272:13–28. doi: 10.1385/1-59259-782-3:013. [DOI] [PubMed] [Google Scholar]
- Jackson SP, Nesbitt WS, Westein E. Dynamics of platelet thrombus formation. J Thromb Haemost. 2009;7(Suppl 1):17–20. doi: 10.1111/j.1538-7836.2009.03401.x. [DOI] [PubMed] [Google Scholar]
- Diedrich B, Remberger M, Shanwell A, Svahn BM, Ringden O. A prospective randomized trial of a prophylactic platelet transfusion trigger of 10 x 10(9) per L versus 30 x 10(9) per L in allogeneic hematopoietic progenitor cell transplant recipients. Transfusion. 2005;45:1064–1072. doi: 10.1111/j.1537-2995.2005.04157.x. [DOI] [PubMed] [Google Scholar]
- Neeves KB, et al. Sources of variability in platelet accumulation on type 1 fibrillar collagen in microfluidic flow assays. PloS one. 2013;8:e54680. doi: 10.1371/journal.pone.0054680. [DOI] [PMC free article] [PubMed] [Google Scholar]
- Born GV. Aggregation of blood platelets by adenosine diphosphate and its reversal. Nature. 1962;194:927–929. doi: 10.1038/194927b0. [DOI] [PubMed] [Google Scholar]
- Cattaneo M, et al. Recommendations for the Standardization of Light Transmission Aggregometry: A Consensus of the Working Party from the Platelet Physiology Subcommittee of SSC/ISTH. J Thromb Haemost. 2013;11:1183–1189. doi: 10.1111/jth.12231. [DOI] [PubMed] [Google Scholar]
- Deckmyn H, Feys HB. Assays for quality control of platelets for transfusion. ISBT Sci Series. 2013;8:221–224. [Google Scholar]
- Andre P, et al. Anticoagulants (thrombin inhibitors) and aspirin synergize with P2Y12 receptor antagonism in thrombosis. Circulation. 2003;108:2697–2703. doi: 10.1161/01.CIR.0000093279.36628.12. [DOI] [PubMed] [Google Scholar]
- Casari C, et al. von Willebrand factor mutation promotes thrombocytopathy by inhibiting integrin alphaIIbbeta3. J Clin Invest. 2013;123:5071–5081. doi: 10.1172/JCI69458. [DOI] [PMC free article] [PubMed] [Google Scholar]
- Gitz E, et al. Improved platelet survival after cold storage by prevention of Glycoprotein Ibα clustering in lipid rafts. Haematologica. 2012. [DOI] [PMC free article] [PubMed]
- Maurer-Spurej E, Labrie A, Brown K. Routine Quality Testing of Blood Platelet Transfusions with Dynamic Light Scattering. Part Part Syst Char. 2008;25:99–104. [Google Scholar]
- Van Kruchten R, Cosemans JM, Heemskerk JW. Measurement of whole blood thrombus formation using parallel-plate flow chambers - a practical guide. Platelets. 2012;23:229–242. doi: 10.3109/09537104.2011.630848. [DOI] [PubMed] [Google Scholar]
- Zwaginga JJ, et al. Flow-based assays for global assessment of hemostasis. Part 2: current methods and considerations for the future. J Thromb Haemost. 2006;4:2716–2717. doi: 10.1111/j.1538-7836.2006.02178.x. [DOI] [PubMed] [Google Scholar]
- Zwaginga JJ, et al. Flow-based assays for global assessment of hemostasis. Part 1: Biorheologic considerations. J Thromb Haemost. 2006;4:2486–2487. doi: 10.1111/j.1538-7836.2006.02177.x. [DOI] [PubMed] [Google Scholar]


