Abstract
Terpyridine (tpy) ligands are popular building blocks to bind metal ions. Several tpy ligands with different substituents were synthesized and examined for their binding with zinc cation. The study revealed a large substituent effect on the zinc binding-induced fluorescence quenching. With the aid of a liquid nitrogen Dewar, the tpy molecules were frozen to their ground-state conformation, preventing (or minimizing) molecular reorganization in the photoinduced excited state. This allowed us to detect the fluorescence spectra from the locally excited state (having a minimum of charge transfer interaction) and the temperature-dependent fluorescence. The fluorescence response to low temperature provided useful information about the intramolecular charge transfer (ICT) interaction between the donor and acceptor groups. Furthermore, a strong donor substituent (such as Me2N) played an essential role in observed fluorescence quenching. The study also provides a useful example to elucidate the ICT mechanism by using low-temperature fluorescence spectroscopy.
Graphical Abstract
INTRODUCTION
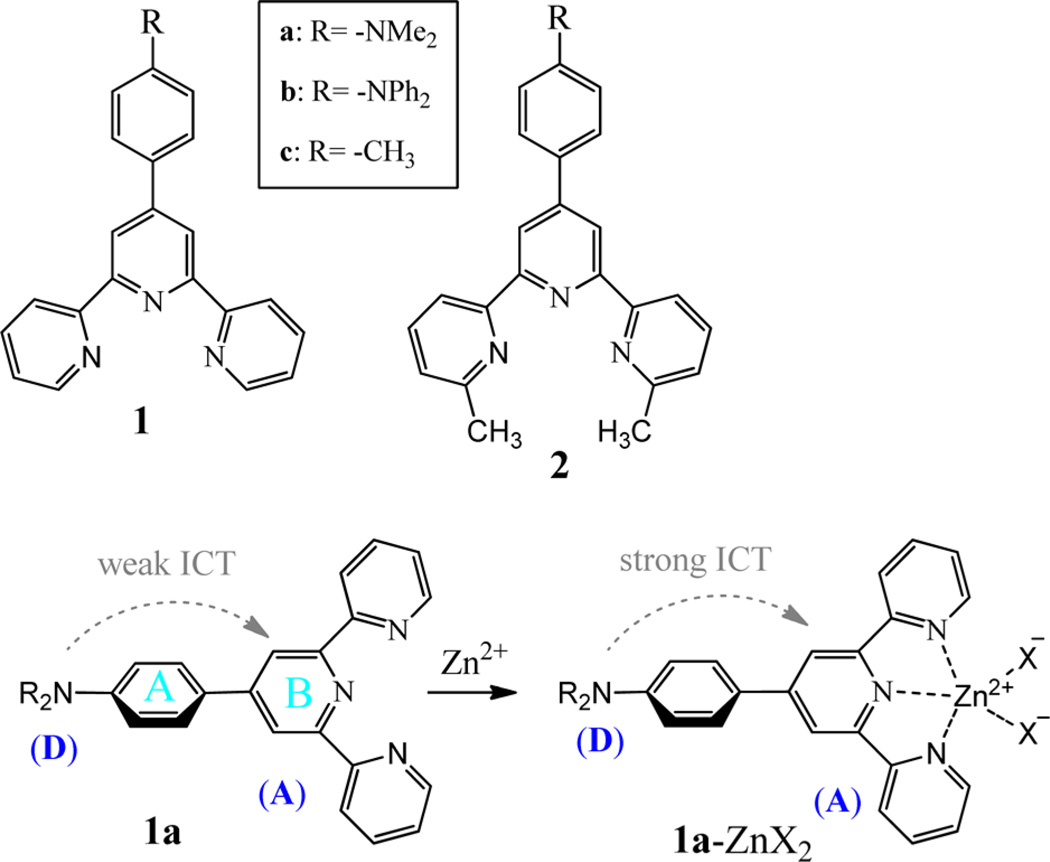
Terpyridine (tpy) ligands are well-known for their ability to host various transition metal ions, leading to various interesting materials.1–3 For example, the weakly fluorescent zinc complex (1a–Zn2+; see Scheme 1)4 was recently shown to generate a large fluorescence turn-on upon addition of a pyrophosphate anion (PPi), while its structural analogue zinc complex shows the response to both mono- and diphosphates.5 The luminescent properties of a typ–zinc complex are dependent on not only the electronic property of tpy ligand but also the heteroatom X as shown in 1a–ZnX2. For example, when X− is sulfonate (CF3SO3−), the tpy–zinc complex gives emission at ~394 nm.6 When X− is an electron-rich Ar–CO2−, however, the tpy–zinc complex gives emission at 530–553 nm, which might be associated with a metal-to-ligand charge transfer (MLCT) band. Coupling of tpy–Zn2+ with triarylborane also leads to a blue-emitting sensor for the fluoride anion.7 Despite strong interest in the tpy ligands and their metal complexes, only a limited understanding has been achieved about the electronic impact of a ligand substituent on the luminescent properties of the tpy–zinc complex.
Scheme 1.
Chemical Structures of tpy Derivatives (top) and Schematic Illustration of ICT of 1a and Its Zinc Complex 1a–ZnX2 (bottom)
Extending our general interests in studying tpy–Zn2+ complexes,8,9 we decided to further explore the nature of substituent impact on the luminescent properties. By using low-temperature spectroscopy, the relative motion of the aromatic fragment is reduced, which perturbs the formation of the optimum geometry in the excited state. In the ground state, the zinc complex adopts the geometry as shown in 1a–ZnX2, in which the phenyl “A” is not coplanar with the terpyridine plane (twisted by about 40°, based on a modeling study). In the excited state, the two aromatic rings A and B will become coplanar, which leads to increased donor–acceptor interaction. The restriction of molecular motion will perturb the formation of the excited state, thereby shifting the emission. The spectral properties of tpy–Zn complexes will thus be affected by various conditions such as temperatures and substituents. Also, fundamental understanding of these effects could shed some light on the luminescence of tpy–Zn complexes, which is important for their improved applications.
RESULTS AND DISCUSSION
Zinc Binding
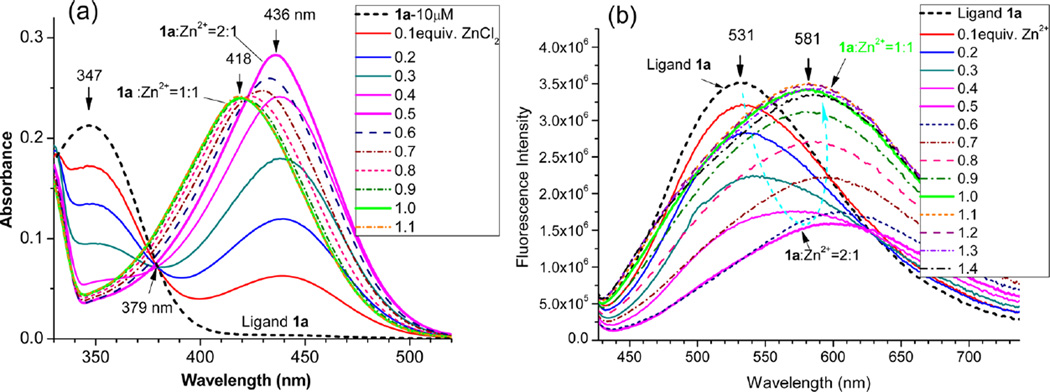
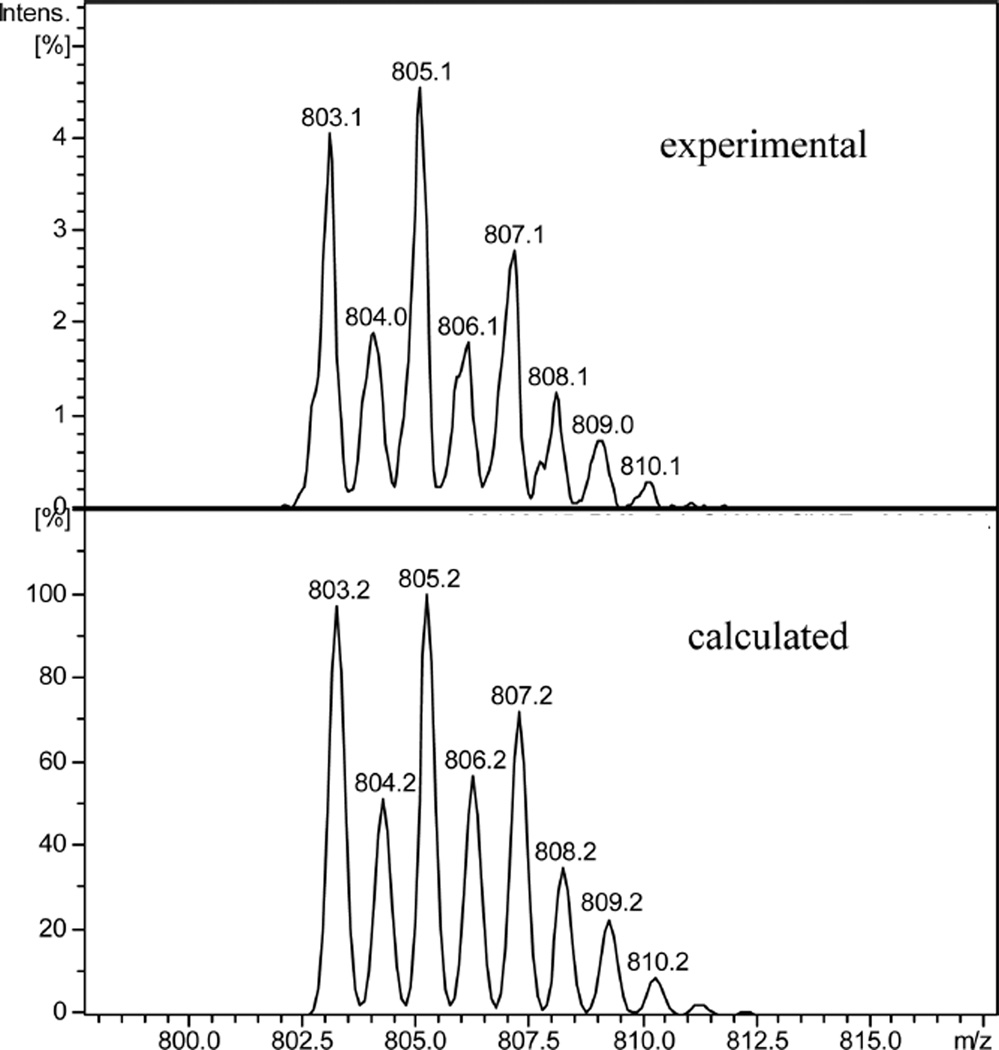
In EtOH, the tpy ligand 1a exhibited a broad absorption peak at λmax = 347 nm (see Table 1). When the first 0.5 equiv of ZnCl2 was added to 1a, a new absorption peak was observed at λmax = 436 nm (Figure 1a). A clear isosbestic point was observed at 379 nm, suggesting the formation of a single new species. A possible explanation was that the ligand formed L2Zn, that is, L + Zn2+ → L2Zn, when the Zn2+ concentration was low. The formation of a (tpy)2Zn2+ complex with a 2:1 ligand-to-metal ratio is common as it is even useful for the formation of macrocyclic rings.10 The formation of (tpy)2Zn2+ complex was further verified by mass spectroscopy study of “1a + ZnCl2” solution in ethanol, which detected the major peak at m/z 803 that matched the isotope distribution for [C46H40ClN8Zn]+ (=[(1a)2ZnCl]+ ion) (Figure 2). Interestingly, further addition of Zn2+ (from 0.5 to 1.0 equiv) gradually shifted the absorption peak to a shorter wavelength (λmax = 418 nm; Figure 1a). It appeared that the initially formed (1a)2Zn complex could react with an additional Zn2+ cation to give complex L–Zn, that is, L2Zn + Zn2+ → L–Zn, where “L” represents the tpy ligand.
Table 1.
Optical Absorption and Emission Properties of tpy Ligands and Their Zinc Complexes in EtOH at Room Temperature
| λabs(nm) | λem(nm) | Q (%) | |
|---|---|---|---|
| 1a | 347 | 531 | 5.58 |
| 1a–Zn | 418 | 581 | 4.59 |
| 2a | 345 | 515 | 9.63 |
| 2a–Zn2+ | 444 | 629 | 0.66 |
| 1b | 431 | 509 | 14.02 |
| 1b–Zn2+ | 538 | 584 | 0.58 |
| 2b | 428 | 508 | 6.44 |
| 2b–Zn2+ | 431 | 620 | 0.76 |
| 1c | 316 | 336, 351 | 2.06 |
| 1c–Zn2+ | 341 | 395 | 9.37 |
| 2c | 318 | 340, 352 | 3.74 |
| 2c–Zn2+ | 347 | 358, 373, 510 | 13.65 |
Figure 1.
UV–vis (a) and FL spectra (b) of ligands 1a (20 µM) in EtOH at 25 °C upon addition of different equivalents of ZnCl2 (in H2O). Excitation at 379 nm.
Figure 2.
Experimental isotope distribution for 1a + ZnCl2 (1:1 ratio in EtOH solution) (top) and the calculated isotope pattern for [C46H40ClN8Zn]+ (=[(1a)2ZnCl]+).
The fluorescence of 1a in EtOH was decreased, reaching a minimum when about 0.5 equiv of Zn2+ cation was added (Figure 1b), as a consequence of forming [(tpy)2Zn2+] species. The zinc binding-induced fluorescence decrease is often observed when a terpyridine unit is connected to a π-conjugated moiety.9 Addition of the second half of Zn2+ (from 0.5 to 1.0 equiv), however, caused an increase in the fluorescence intensity (Figure 1b). Opposite trends in responding to the first and second halves of the Zn2+ cation clearly indicated that the emission intensity of the complex was sensitive to the ligand-to-metal ratio. In the fluorophore 1, an electron-donating group (e.g., an amino group) is in conjugation with an electron-withdrawing group, which provides the necessary condition for photoinduced intramolecular charge transfer (ICT). Upon binding of a Zn2+ cation to the electron-deficient terpyridine unit in EtOH, the charge transfer interaction appeared to be stronger, which resulted in a large bathochromic shift in absorption (Δλmax = 90 and 107 nm for 1a and 1b, respectively) and emission (Δλem= 50 and 75 nm for 1a and 1b, respectively) (Figure 1b and Supporting Information Figure S3).
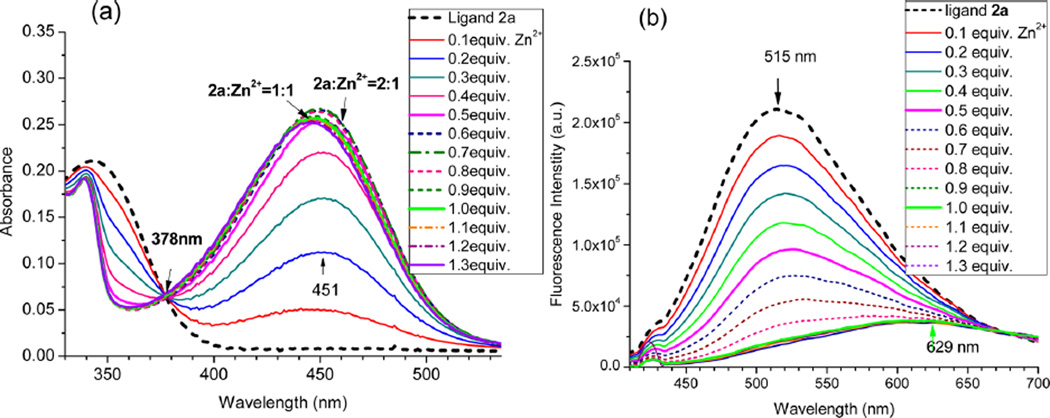
The initial formation of the (tpy)2Zn2+ complex was also observed from 2a as the absorption reached the maximum (λmax = 451 nm) when 0.5 equiv of Zn2+ was added to the ligand solution (Figure 3a). Interestingly, addition of Zn2+ to 2a led to a consistent decrease of the fluorescence intensity under the same conditions (Figure 3b). Quite different spectral response between 1a and 2a further revealed that a substituent on tpy could have a large impact on the luminescence properties of the zinc complexes. The observation from both 1a and 2a pointed to that formation of (tpy)2Zn2+ complexes, that is, (1a)2Zn or (2a)2Zn, resulted in the fluorescence quenching. The subsequent formation of the tpy–Zn2+ complex (i.e., L2Zn + Zn2+ → L–Zn) shifted the emission to a longer wavelength, although its impact on the emission intensity could be either increasing or decreasing.
Figure 3.
UV–vis (a) and FL spectra (b) of ligands 2a (10 µM) in EtOH at 25 °C, upon addition of different equivalents of ZnCl2 (in H2O). Excitation at 378 nm.
Absorption and Fluorescence Spectra at Low Temperature
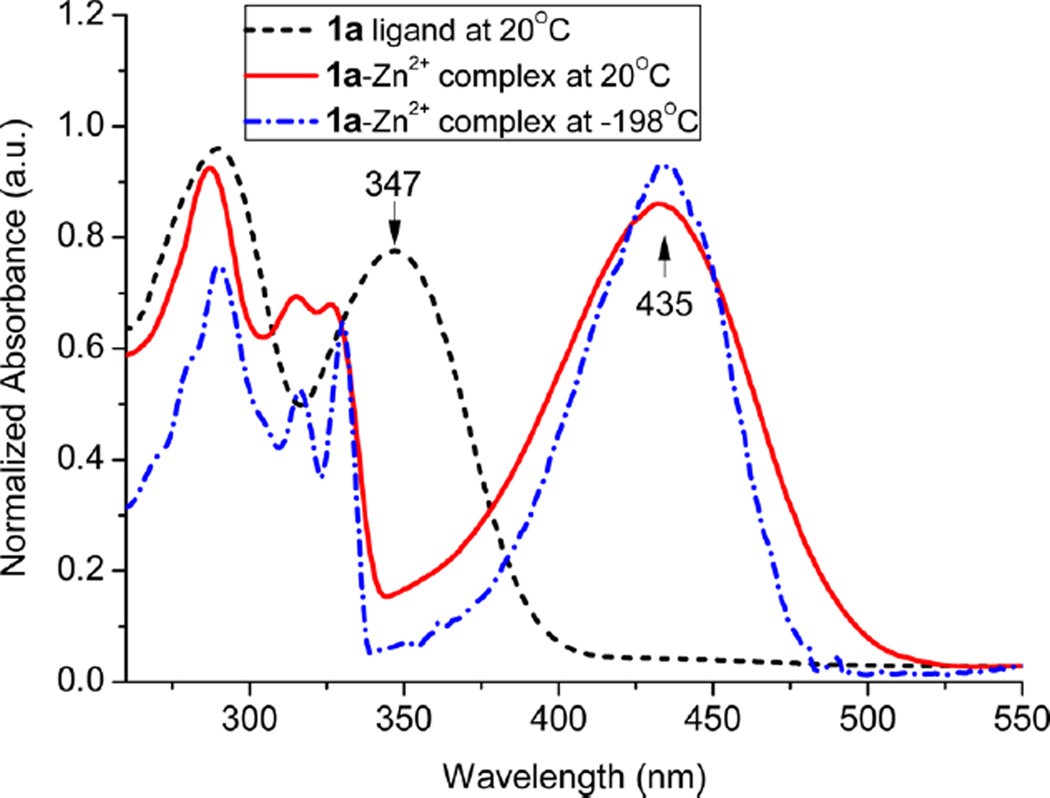
It should be noted that the photoinduced ICT was a weak association between the donor and acceptor groups and tended to occur in the excited state. In order to seek a deeper understanding of the optical properties of the zinc complexes, we decided to further examine the spectra at low temperature, which could provide additional insight into the intra- and intermolecular interactions.12 In order to freeze the molecules in their original environment, the dilute solution in a quartz tube was quickly cooled by immersing the sample tube (with a 3 mm inside diameter) into liquid nitrogen in a quartz Dewar. The spectra were then acquired as the temperature was gradually raised (within about 1–2 h). UV–vis absorption spectra of 1a–Zn, from a transparent glassy solid formed at −198 °C, became narrower at the low temperature without exhibiting notable spectral shift (Figure 4), indicating negligible changes in the ground states. Observation of the absorption band at λmax ≈ 435 nm (attributed to π–π* transition) clearly indicated that the zinc complex did not dissociate at the low temperature because the free ligand would have absorption at λmax ≈ 347 nm. When the temperature was lowered, there was a slight red shift in the absorption peak (e.g., from 327 to 330 nm), which is commonly observed when the vibrational sublevels in an electronic state are resolved.11
Figure 4.
UV spectrum of compound 1a and its Zn2+ complex in EtOH at room temperature and at −198 °C. The ethanol solution of 1a–Zn2+ was frozen to a transparent glassy solid when the sample tube was cooled in liquid nitrogen.
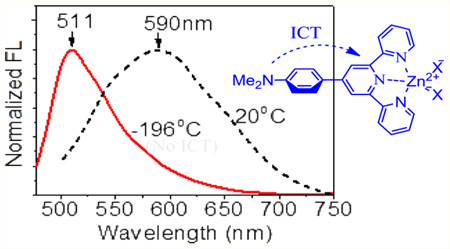
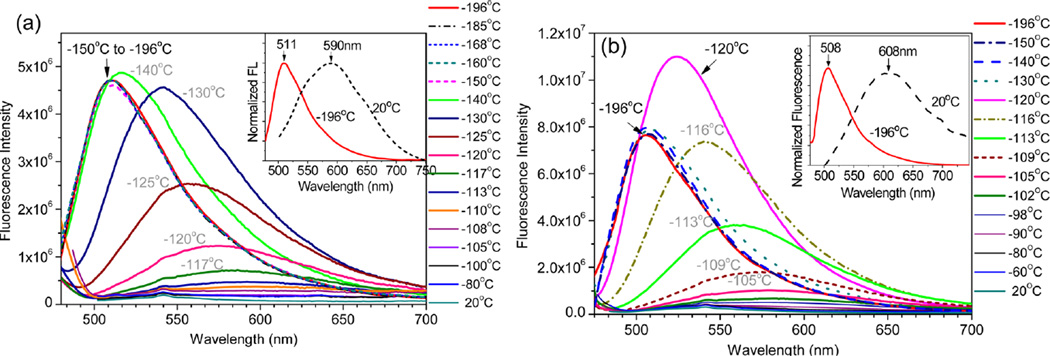
In contrast to absorption, emission of the zinc complexes was notably blue-shifted by 80–100 nm to 511 and 508 nm for 1a–Zn and 2a–Zn, respectively, as the temperature was decreased (Figure 5). In addition to a narrower band, the emission intensity was increased by ~22 fold as the chromophore structure became more rigid at −198 °C. It should be noted that the absorption and emission of a simple aromatic hydrocarbon, such as phenylenevinylene,11 typically exhibits a slight bathochromic shift at a lower temperature. The unusually large fluorescence blue shift from 1a–Zn was, therefore, related to the reduced donor–acceptor interaction in the excited state, as a consequence of decreasing molecular mobility at the low temperature.
Figure 5.
Fluorescence spectra of 1a–Zn2+ (a) and 2a–Zn2+ (b) in EtOH at various temperatures. The inset shows the normalized fluorescence spectra in EtOH at 20 and −196 °C. Excitation at 467 nm.
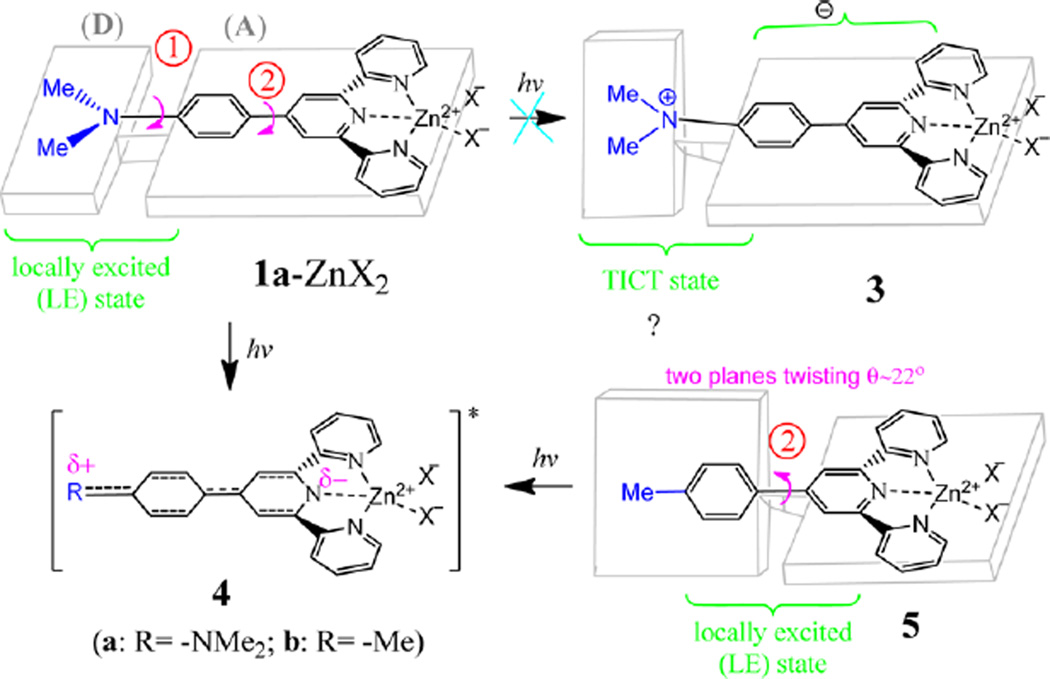
Although the zinc complexes in solution could be either Zn(tpy)2 (with 1:2 metal-to-ligand ratio) or Zn(tpy) (with 1:1 metal-to-ligand ratio), the spectra in Figure 5 are from the latter. For the reaction, Zn(tpy)2 + Zn(II) → 2 Zn(tpy), we have the equilibrium constant K. Because of the correlation ΔG° = –RT·ln K, the equilibrium constant became larger as the temperature decreased. Therefore, the reaction favored the formation of Zn(tpy) at the low temperature. The assumption was consistent with what is observed in Figure 4, where the absorption peak became only narrower without showing any spectral shift, which would be observed if Zn(tpy)2 was formed in the mixture. As shown in Scheme 2, there are two σ-bonds in the zinc complex 1a–Zn2, marked as (1) and (2), which can be rotated to influence the effective conjugation length of the zinc complex and the respective photophysical properties. In the excited state, it was possible to rotate the donor group (R2N) away from its coplanarity with phenyl, leading to twisted intramolecular charge transfer (TICT). The experimental evidence, however, suggested that the donor–acceptor interaction might not be strong enough to warrant the TICT because the spectral data did not detect the coexistence of the locally excited (LE) state and TICT state as two separate emission peaks, which is the signature for the formation of TICT.12 The assumption of no TICT in 1a–Zn2+ was consistent with the observed gradual shift in emission peak position. The observed large spectral difference from the fluorescence of 1a–Zn2+ at room and low temperature, therefore, was attributed to the regular photoinduced ICT between donor and acceptor groups (see structure 4 in Scheme 2). At room temperature, the ICT could occur easily, leading to the emission at a longer wavelength. At −198 °C, bond reorganization and rotation was no longer possible to accommodate the changes required to relax the excited state, thereby giving the blue-shifted emission from the LE state.
Scheme 2.
Schematic Illustration of the Possible LE State and TICT by Rotating the Amine Group in 1a–ZnX2 (shown in 1a–ZnX2 → 3) a
aThe charge transfer state could also be achieved by rotating σ-bond #2 between the phenyl and pyridyl groups (5 → 4).
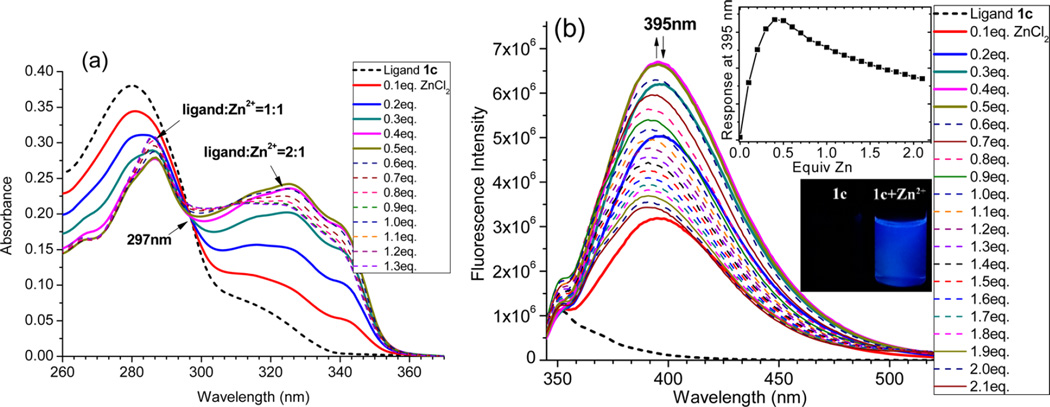
In order to estimate the impact of the amino group (the electron donor), we decided to acquire the spectra of 1c–Zn2+, in which only the rotation between the phenyl and central pyridyl rings could have a significant influence on conjugation (as shown in 5, Scheme 2). At room temperature, the absorption λmax and fluorescence λem of 1c–Zn2+ were at 340 and 395 nm (Figure 6), respectively, which were notably blue-shifted from 1a–Zn2+ (by ~90 nm in λmax and 187 nm in λem). The unusually large spectral blue shift was due to the elimination of the large interaction between the donor substituent group and tpy–Zn center in the zinc complex 1c–Zn2+. Interestingly, the fluorescence response of 1c exhibited an initial increase to Zn2+ (0–0.5 equiv) and then a slight decrease (Zn2+ larger than 0.5 equiv) (inset in Figure 6b). The opposite trend observed in the fluorescence response to Zn2+ from 1c (Figure 6b) and 1a (Figure 1b) suggested that a strong donor group was necessary for the zinc-induced fluorescence quenching.
Figure 6.
UV–vis (a) and fluorescence spectra (b) of 1c (10 µM in EtOH), upon addition of different equivalents of ZnCl2. Excitation at 327 nm. The inset shows the fluorescence response of 1c at 395 nm to different equivalents of ZnCl2 and the image of the ligand upon addition of 1 equiv of ZnCl2.
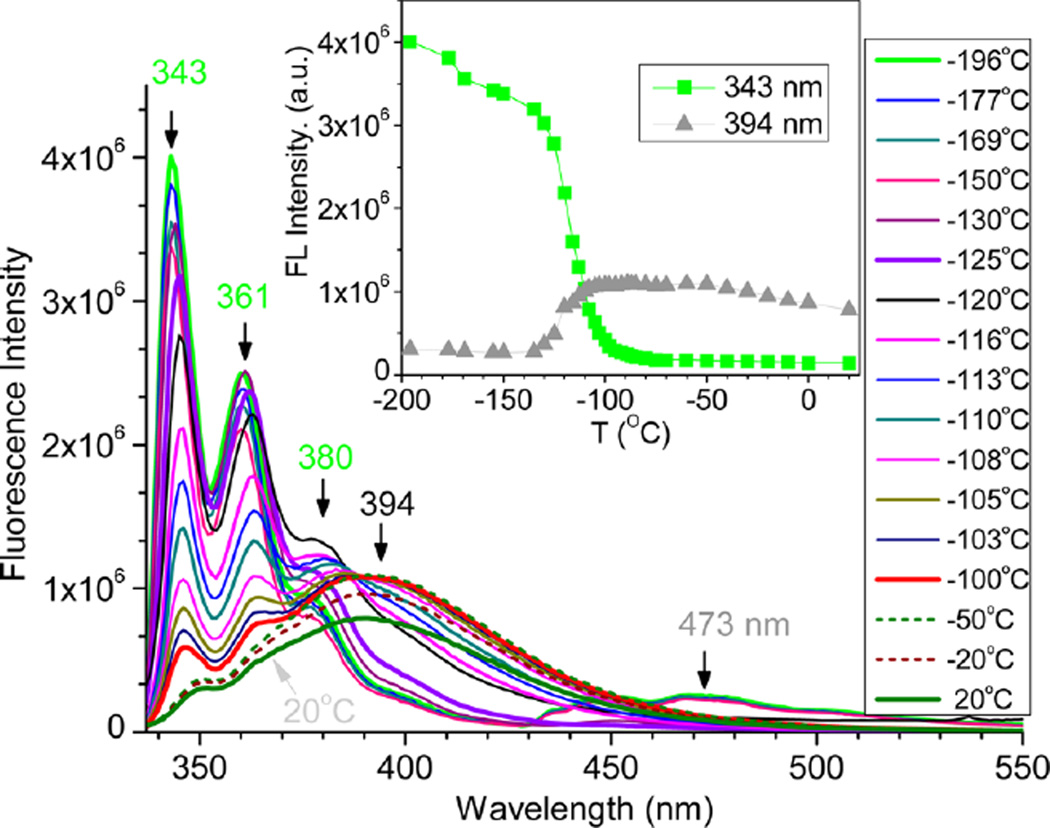
At −196 °C, the fluorescence of 1c–Zn2+ revealed the structured emission at 343, 361, and 380 nm, which could be attributing to the LE state 5. The structured emission was maintained when the temperature was below −125 °C, indicating the presence of a well-defined aromatic chromophore segment (likely to be a rigid tpy–Zn fragment). Apparently, the molecules were frozen into the rigid solvent matrix, in which structural adjustment (e.g., bond rotation and bond length) and solvent reorganization could not occur during the lifetime of the excited state (i.e., not able to adopt structure 4). When the frozen solution was warmed to about −100 °C (above the mp of EtOH (−114 °C)), the structured emission of 1c–Zn2+ gradually disappeared, which was accompanied by a broad band at about 394 nm (see the red curve in Figure 7). The emission peak of 1c–Zn at ~394 nm was assigned to 4b, which included the weak ICT from the para-methylphenyl group. Clearly, the molecular environment had to exhibit certain mobility to permit the rotation of the phenyl ring in 5, in order to adopt coplanar 4b during the excitation. The environment mobility permitted the reorientation of solvent molecules to stabilize the ICT. A plot of the relative fluorescence intensity at 394 nm versus temperature (inset in Figure 7) revealed that the formation of 4b started at about −140 °C and became fully allowed at about −110 °C. The results indicated that the bond rotation between the phenyl and pyridyl rings (i.e., bond #2 in 5) played an essential role to allow efficient ICT interaction, which led to red-shifted emission and reduced emission intensity upon a temperature increase (a similar trend was observed from 1a–Zn). When the temperature was very low (below −150 °C), a weak broad emission was also detected at ~473 nm, which could be attributed to the phosphorescence.
Figure 7.
Fluorescence spectra of 1c–Zn2+ in EtOH at various temperatures. Excitation at 327 nm. The inset shows relative fluorescence intensity at 394 and 343 nm at different temperatures.
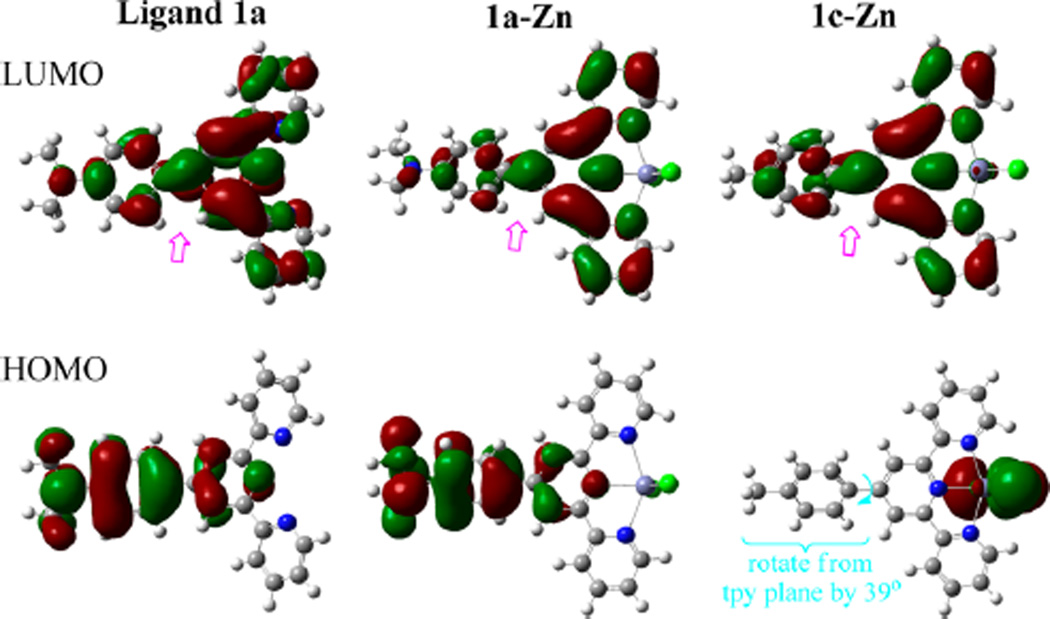
Molecular modeling by using Gaussian 09 revealed more information from the molecular orbital interaction. The LUMO of the 1a–Zn complex revealed large orbital lopes on the pyridyl nitrogen and zinc atoms, in comparison with that of ligand 1a. The finding supported the assumption that the zinc binding significantly increased the tpy’s ability to accept electrons for a stronger donor–acceptor interaction in the excited state. The dimethylamino group in 1a–Zn was coplanar with the phenyl group (as depicted in Scheme 2). In comparison with the 1c–Zn, complex 1a–Zn had a larger change in electron density from the dimethylaminino group (in the HOMO orbital) to the tpy–Zn center (in the LUMO orbital) (Figure 8). The electron-donating Me2N substituent thus enabled a strong donor–acceptor interaction in the 1a–Zn complex, which resulted in a larger spectral red shift (in comparison with the emission from 1c–Zn). The modeling study also revealed that the Me2N–Ph plane was twisted away from the tpy by ~41° in 1a–Zn, while the Me–Ph plane was twisted by ~39° in 1c–Zn.
Figure 8.
HOMOs and LUMOs of geometry-optimized ligand 1a and zinc complexes 1a–Zn and 1c–Zn at the B3LYP/6-31+G(d,p) level. The double arrows (pink color) point to the orbitals between the phenyl and terpyridine segment, showing the electronic impact on the orbital lopes.
EXPERIMENTAL SECTION
Reagents and Instrumentation
All reagents and solvents were purchased from commercial sources and used without further purification. 1H NMR and 13C NMR spectra were obtained using a Bruker AVANCE II. UV–vis spectra were acquired on a Hewlett-Packard 8453 diode-array spectrometer. Fluorescence spectra were measured by using FluoroMax-4 spectrometer. The fluorescence quantum yields were obtained using quinine sulfate and Rhodamine 6G as the standards (Φfl = 0.58 in 0.1 M H2SO4, or Φfl = 0.95 in H2O). Electrospray ionization (ESI) mass spectra were acquired with a Waters Synapt HDMS quadrupole/time-of-flight (Q/ToF) mass spectrometer.
General Procedure for Ligand Synthesis
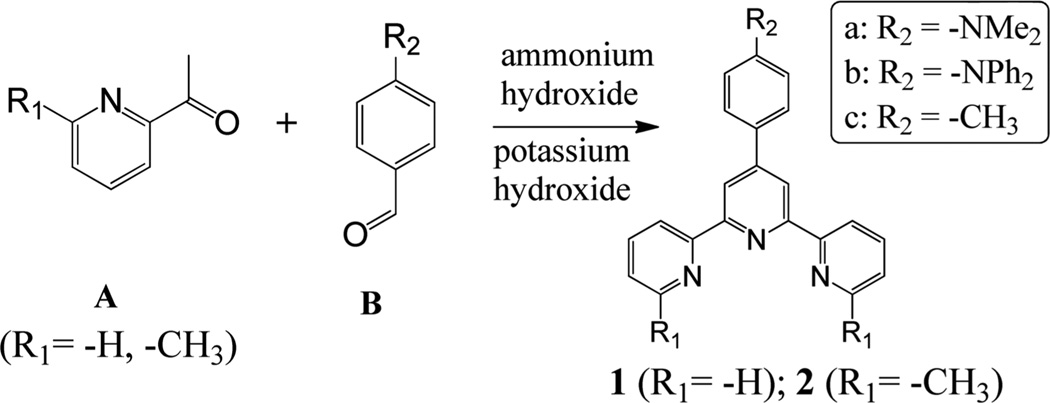
The terpyridine ligand 1 or 2 was synthesized according to the literature method.13 An acetylpyridine derivative A (40 mmol) was added into the solution of benzaldehyde B (20 mmol) in EtOH (100 mL) under stirring (Scheme 3). KOH pellets (85%, 40 mmol) and aq NH3 (29.3%, 50 mmol) were then added while the solution was stirred at room temperature. The solution was stirred at room temperature for 48 h. The solid was collected by filtration and washed with EtOH (3 × 10 mL). Recrystallization from CHCl3–MeOH afforded crystalline solid product (yield around 50%).
Scheme 3.
General Procedure for Synthesis of Ligands 1 and 2
Compound 1a was synthesized by reaction of 2-acetylpyridine with 4-dimethylamino-benzaldehyde. The product had the following spectral properties. 1H NMR (300 MHz, CDCl3) δ 8.98–8.42 (m, 6H), 8.03–7.72 (m, 4H), 7.34 (dd, J = 7.4, 4.8 Hz, 2H), 6.82 (d, J = 8.9 Hz, 2H), 3.04 (s, 6H).
Compound 1b was synthesized by reaction of 2-acetylpyridine with 4-diphenylamino-benzaldehyde. 1H NMR (300 MHz, CDCl3) δ 8.76–8.70 (m, 2H), 8.19 (d, J = 6.8 Hz, 2H), 8.04 (d, J = 51.8 Hz, 2H), 7.86 (td, J = 7.5, 1.6 Hz, 2H), 7.58 (d, J = 8.7 Hz, 4H), 7.47 (ddd, J = 7.5, 4.8, 1.2 Hz, 2H), 7.31–7.28 (m, 4H), 7.13 (s, 4H), 7.01 (s, 2H).
Compound 1c was synthesized by reaction of 2-acetylpyridine with 4-methyl-benzaldehyde. 1H NMR (300 MHz, CDCl3) δ 8.73 (s, 2H), 8.67 (d, J = 7.9 Hz, 2H), 7.88 (t, J = 8.0 Hz, 2H), 7.83 (d, J = 8.1 Hz, 2H), 7.44–7.35 (m, 2H), 7.34 (d, J = 4.7 Hz, 2H), 7.32 (d, J = 7.8 Hz, 2H), 2.43 (s, 3H).
Compound 2a was synthesized by reaction of 1-(6-methylpyridin-2-yl)-ethanone (A) with 4-dimethylamino-benzaldehyde (B). 1H NMR (300 MHz, CDCl3) δ 8.69 (s, 2H), 8.43 (d, J = 7.8 Hz, 2H), 7.86 (d, J = 8.7 Hz, 2H), 7.74 (t, J = 7.7 Hz, 2H), 7.19 (d, J = 7.5 Hz, 2H), 6.85 (d, J = 8.7 Hz, 2H), 3.05 (s, 6H), 2.68 (s, 6H).
Compound 2b was synthesized by reaction of 1-(6-methylpyridin-2-yl)-ethanone (A) with B, 4-diphenylamino-benzaldehyde (B). 1H NMR (300 MHz, CDCl3) δ 8.21 (s, 2H), 7.98 (d, J = 7.3 Hz, 2H), 7.88 (d, J = 15.8 Hz, 2H), 7.74 (t, J = 7.6 Hz, 2H), 7.57 (s, 2H), 7.32 (d, J = 7.2 Hz, 4H), 7.15 (d, J = 7.5 Hz, 4H), 7.07 (s, 2H), 7.02 (s, 2H), 2.67 (s, 6H).
Compound 2c was synthesized by reaction of 1-(6-methylpyridin-2-yl)-ethanone (A) with 4-methyl-benzaldehyde (B). 1H NMR (300 MHz, CDCl3) δ 8.70 (s, 2H), 8.44 (d, J = 7.8 Hz, 2H), 7.82–7.77 (m, 2H), 7.73 (d, J = 7.7 Hz, 2H), 7.33 (d, J = 7.8 Hz, 2H), 7.20 (d, J = 7.6 Hz, 2H), 2.67 (s, 6H), 2.44 (s, 3H).
Spectral Titration
All of the solvents for the fluorescence experiments were analytic grade, which were purchased from Fisher Scientific and used without further purification. The ligand solutions in DMSO (10 mmol/L) were prepared and used as stock solutions. The 1 mM ZnCl2 solution was obtained by dissolving zinc dichloride in DMSO. All UV/vis and fluorescence titration experiments were performed using 10 µM ligands in ethanol or aqueous solution (pH 7.4, 10 mM HEPES buffer) with varying concentrations of Zn2+ at room temperature.
CONCLUSIONS
In conclusion, several tpy ligands with different substituents have been synthesized, and their zinc binding characteristics have been examined by using spectroscopy at room and low temperature. The study shows that the tpy ligands react readily with the added ZnCl2, forming the zinc complex with a 2:1 ligand-to-metal ratio (i.e., tpy2–Zn) when the Zn2+ concentration is low. Further addition of Zn2+ will lead to complex tpy–Zn with a 1:1 ligand-to-metal ratio. The spectral evidence also indicate that a relative large decrease in fluorescence intensity occurs when forming [(tpy)2–Zn] (the complex with a 2:1 ligand-to-metal ratio). The subsequent formation of tpy– Zn (←(tpy)2–Zn + Zn2+), however, often exhibits a smaller fluorescence response and could be in the opposite direction (e.g., fluorescence increasing when forming 1a–Zn). The finding could be a valuable guide for optimizing the performance of tpy-containing materials.
The fluorescence spectrum at −196 °C reveals information about the LE state because the molecules are frozen to its ground-state conformation, which eliminates (or minimizes) molecular reorganization in the excited state. The low temperature also minimizes the solvent effect on the ICT as orientation of frozen solvent molecules is less likely on the time scale (<10 ns) of the excited state. By monitoring the fluorescence response at different temperatures, the study detects the transition from the LE state to the ICT-enabled state, which is associated with a large spectral red shift. The results point to that ICT plays an important role in the emission properties of tpy–Zn complexes. Therefore, the ability to generate a strong ICT in 1a is responsible for its zinc binding-induced fluorescence quenching (via formation of 1a– Zn) and its emission shift to a longer wavelength. Through the study, the low-temperature fluorescence is shown to be a useful tool for elucidation of the ICT mechanism, which is common in luminescent materials. It should be noted that the temperature-dependent ICT is based on the gradual permission of the molecular motion in the excited state (through controlling the rigidity of the molecular environment). Detection of the temperature-dependent ICT in 1a–Zn thus points out that the observed emission may not be associated with the simple MLCT as the local rigid binding geometry between Zn2+ and terpyridine may not be affected, and we do not expect a large spectral shift at different temperatures.
Supplementary Material
Acknowledgments
This work was supported by the NIH (Grant No. 1R15EB014546-01A1). We also thank the Coleman endowment from the University of Akron for partial support and Mr. Nick Alexander for assistance in acquiring the mass spectra.
Footnotes
ASSOCIATED CONTENT
Supporting Information
- UV–vis of compounds 1 and 2 and their zinc complexes.
- 1H NMR titration of 1a with ZnCl2 (PDF)
The authors declare no competing financial interest.
REFERENCES
- 1.Wild A, Winter A, Schlütter F, Schubert US. Advances in the Field of π-Conjugated 2,2′6′,2′-Terpyridines. Chem. Soc. Rev. 2011;40:1459–1511. doi: 10.1039/c0cs00074d. [DOI] [PubMed] [Google Scholar]
- 2.Andres PR, Schubert U. New Functional Polymers and Materials Based on 2,2′6′,2′-Terpyridine Metal Complexes. Adv. Mater. 2004;16:1043–1068. [Google Scholar]
- 3.Hofmeier H, Schubert US. Recent Developments in the Supramolecular Chemistry of Terpyridine–Metal Complexes. Chem. Soc. Rev. 2004;33:373–399. doi: 10.1039/b400653b. [DOI] [PubMed] [Google Scholar]
- 4.Bhowmik S, Ghosh BN, Marjomaki V, Rissanen K. Nanomolar Pyrophosphate Detection in Water and in a Self-Assembled Hydrogel of a Simple Terpyridine-Zn2+ Complex. J. Am. Chem. Soc. 2014;136:5543–5546. doi: 10.1021/ja4128949. [DOI] [PubMed] [Google Scholar]
- 5.Hai Z, Bao Y, Miao Q, Yi X, Liang G. Pyridine–Biquinoline–Metal Complexes for Sensing Pyrophosphate and Hydrogen Sulfide in Aqueous Buffer and in Cells. Anal. Chem. 2015;87:2678–2684. doi: 10.1021/ac504536q. [DOI] [PubMed] [Google Scholar]
- 6.Ma Z, Lu W, Liang B, Pombeiro AJL. Synthesis, Characterization, Photoluminescent and Thermal Properties of Zinc(II) 4′-Phenyl-Terpyridine Compounds. New J. Chem. 2013;37:1529–1537. [Google Scholar]
- 7.Lee YH, Nghia NV, Go MJ, Lee J, Lee SU, Lee MH. Terpyridine–Triarylborane Conjugates for the Dual Complexation of Zinc(II) Cation and Fluoride Anion. Organometallics. 2014;33:753–762. [Google Scholar]
- 8.Chu Q, Pang Y. Terpyridine-Substituted, Fluorescent Polymers and Their Chelation with Zinc Ion: The Ligand-to-Metal Ratio and Optical Properties. J. Polym. Sci., Part A: Polym. Chem. 2006;44:2338–2345. [Google Scholar]
- 9.Banjoko V, Xu Y, Mintz E, Pang Y. Synthesis of terpyridine-functionalized poly(phenylenevinylene)s: The Role of meta-Phenylene Linkage on the Cu2+ and Zn2+ Chemosensors. Polymer. 2009;50:2001–2009. [Google Scholar]
- 10.Hwang SH, Wang P, Moorefield CN, Godinez LA, Godinez LA, Manriquez J, Bustos E, Newkome GR. Design, Self-Assembly, and Photophysical Properties of Pentameric Metallomacrocycles: [M5(N-hexyl[1,2-bis(2,29:69,20-terpyridin-4-yl)]-carbazole)5][M 5 Fe(II), Ru(II), and Zn(II)] Chem. Commun. 2005:4672–4674. doi: 10.1039/b509662f. [DOI] [PubMed] [Google Scholar]
- 11.Liao L, Pang Y, Karasz FE. Comparison of Optical Properties between Blue-Emitting Poly(m-phenylenevinylene) and PPV Block Copolymer. Macromolecules. 2002;35:5720–5723. [Google Scholar]
- 12.Grabowski ZR, Rotkiewicz K, Rettig W. Structural Changes Accompanying Intramolecular Electron Transfer: Focus on Twisted Intramolecular Charge-Transfer States and Structures. Chem. Rev. 2003;103:3899–4032. doi: 10.1021/cr940745l. [DOI] [PubMed] [Google Scholar]
- 13.Wang J, Hanan GS. A Facile Route to Sterically Hindered and Non-Hindered 4′-Aryl-2,2′:6′,2″-Terpyridines. Synlett. 2005:1251–1254. [Google Scholar]
Associated Data
This section collects any data citations, data availability statements, or supplementary materials included in this article.


