

Abstract
Cancer immunotherapies, such as immune checkpoint blockade or adoptive T cell transfer, can lead to durable responses in the clinic, but response rates remain low due to undefined suppression mechanisms. Solid tumors are characterized by a highly acidic microenvironment that might blunt the effectiveness of anti-tumor immunity. In this study, we directly investigated the effects of tumor acidity on the efficacy immunotherapy. An acidic pH environment blocked T cell activation and limited glycolysis in vitro. IFNγ release blocked by acidic pH did not occur at the level of steady-state mRNA, implying that the effect of acidity was post-translational. Acidification did not affect cytoplasmic pH, such that signals transduced by external acidity were like mediated by specific acid-sensing receptors, four of which are expressed by T cells. Notably, neutralizing tumor acidity with bicarbonate monotherapy impaired the growth of some cancer types in mice where it was associated with increased T cell infiltration. Further, combining bicarbonate therapy with anti-CTLA-4, anti-PD1 or adoptive T cell transfer improved antitumor responses in multiple models, including cures in some subjects. Overall, our findings show how raising intratumoral pH through oral buffers therapy can improve responses to immunotherapy, with the potential for immediate clinical translation.
Introduction
The amplitude and quality of T cell activation in response to antigen activation of the T cell receptor (TCR) is tightly controlled by engagement of inhibitory receptors, such as PD-1, Lag-3, Tim-3, BTLA and CTLA4. The ability of tumors to co-opt these inhibitory pathways plays an important role in the inhibition of T cell responses within the tumor microenvironment (1,2). Treatment with fully humanized neutralizing monoclonal antibodies against CTLA4, PD-1 or its ligand PD-L1, has led to durable anti-tumor responses where conventional therapies have failed (3–5). However, response rates remain low, from 18–27% for anti-PD-1 antibodies (6), and 11% for anti-CTLA4 antibodies (7). Recent studies have shown that multiple checkpoints can be co-expressed on individual TILs, such as PD-1+TIM-3+ T cells which are defective in proliferation and cytokine production (8–10). Indeed, a recent clinical trial combined PD-1 and CTLA4 blockade in patients with melanoma, and showed an increase rate of objective tumor responses as compared with blocking either checkpoint alone, 40% vs. 20% (11). However, there remain a significant proportion of non-responders, suggesting that additional immunosuppressive pathways are active.
Regulatory T cells (Tregs) or myeloid derived suppressors cells (MDSC) are also known to blunt T cell responses (12,13). Tregs suppress antigen-specific T cell response and removal of Tregs in murine models led to enhanced anti-tumor T cell responses and tumor rejection (14). MDSCs are comprised of immature macrophages, granulocytes and dendritic cells, DC (15). They suppress T cell responses, reduce antigen specific CD8+ T cell proliferation, increase T cell death by apoptosis (16), and their elimination has been shown to enhance anti-tumor immunity and tumor regression in murine tumor models (17). In addition to these cell-based inhibitors of immune function, there are also secreted factors that block T cell activation. The most widely studied of these are the kyenuranines, which are synthesized by the tryptophan-metabolizing enzyme, indoleamine-2,3-dioxygenase, IDO. IDO can be expressed by cancer cells and is normally expressed by DCs in response to Interferon-γ (IFN-γ) in order to blunt immune activation (18). There has also been evidence that tumor derived acidity also plays a role in immune-suppression (19).
Solid tumors are unequivocally acidic (20). This is commonly believed to be a consequence of high rates of fermentative metabolism in a poorly perfused environment (21). However, newer models point to an active role for the membrane bound carbonic anhydrase IX (CAIX) in establishing extracellular acidity (22). This is relevant, as CAIX is an independent negative prognostic indicator in a number of cancers including, inter alia, breast (23), lung (24), and ovarian (25) cancers. Tumor acidity is important to tumor progression, as it has been shown to promote local invasion and metastasis (26), and metastasis can be inhibited by neutralization of acidity with oral buffers (27,28).
Tumor-derived acidity is also hypothesized to suppress immune function (19). For example, lactic acidosis is a strong negative prognostic indicator in sepsis (29). In vitro, acidic pH (6.5) can suppress T cell functions, including IL-2 secretion and activation of T cell receptors (30), although the mechanism by which this occurs is not known. Likewise, there is evidence that acid pH affects other components of the immune systems, such as dendritic cells (DCs), MDSCs or macrophages, yet these effects are also not known with certainty (19). For example, inhibition of proton pumps on tumor cells with omeprazoles can hamper tumor-induced suppression of macrophages in vitro & in vivo (31,32), yet this activity may be due to off-target effects, as the target for these drugs are not known to be expressed in the immune system. It may be assumed that the effects of acidity are not mediated via acidification of the intracellular pH (pHi), as the pHi has been shown to be highly buffered in activated T cells (33). More recently, families of specific acid-sensing receptors have been identified (34) and shown to transduce extracellular acidity into intracellular signals. For example, acid pH has been shown to activate the G-protein, T cell inhibitory receptor, TDAG8 (T cell death-associated gene-8) (35), and this has been shown to be responsible for a reduction in c-myc translation in lymphocytes (36). In this study, we examined the effect of tumor acidity on anti-tumor immunotherapeutic strategies and observed that neutralization of tumor pH with bicarbonate increases response to checkpoint inhibitors and, importantly, led to cures in combination with adoptive T cell therapy.
Materials and Methods
Mice
Female C57BL/6 mice (6–8 weeks old) were purchased from Harlan Laboratories (Indianapolis IN). TDAG8 knock-out mice on the C57BL/6 background were purchased from Jackson Laboratories (Bar Harbor, ME). Pmel, OT-I, and OT-II mice were bred and housed at the Animal Research Facility of the H. Lee Moffitt Cancer Center and Research Institute. Mice were humanely euthanized by CO2 inhalation according to the American Veterinary Medical Association Guidelines. Mice were observed daily and were humanely euthanized if a solitary subcutaneous tumor exceeded 200 cm2 in area or mice showed signs referable to metastatic cancer. All animal experiments were approved by the Institutional Animal Care and Use Committee and performed in accordance with the U.S. Public Health Service policy and National Research Council guidelines.
Cell lines and cell culture
B16 melanoma (obtained from ATCC), Yumm 1.1 melanoma (kindly provided by Marcus Bosenberg, Yale University) and Panc02 pancreatic cancer (obtained from ATCC) cell lines, were cultured in complete media (CM): RPMI media supplemented with 10% heat-inactivated FBS, 0.1 mM nonessential amino acids, 1 mM sodium pyruvate, 2 mM fresh L-glutamine, 100 mg/ml streptomycin, 100 U/ml penicillin, 50 mg/ml gentamicin, 0.5 mg/ml fungizone (all from Life Technologies, Rockville, MD), and 0.05 mM 2-ME (Sigma-Aldrich, St. Louis, MO). The cell lines tested negative for mycoplasma contamination. All cell lines were passaged less than 10 times after initial revival from frozen stocks. All cell lines were validated in core facilities prior to use.
In vitro T cell culture
T cells were isolated from the spleens of pmel, OT-I, or OT-II mice using T cell columns (R&D Systems, Minneapolis, MN). Pmel T cells were cultured for 2 days in CM containing 10 IU/ml IL-2 and 5 ug/ml gp10025–33 peptide. T cells were collected and cultured in CM pH 6.6 or 7.4 with gp10025–33 peptide (10 mcg/ml) for 24 hours. Freshly isolated OT-I T cells were cultured in CM pH 6.6 or 7.4 with OVASIINFEKL peptide (10 mcg/ml) for 24 hours. Freshly isolated OT-II T cells were cultured in CM pH 6.6 or 7.4 with OVA323–339 peptide (10 mcg/ml) for 24 hours. Freshly isolated T cell from TDAG8 k/o and WT littermates were cultured with 5mcg/ml plate-bound anti-CD3 antibodies for 48 hours. For restimulation experiments, pmel T cells were collected after 24 hours of culture in CM pH 6.6 or pH 7.4 containing 10mcg/ml gp10025–33 peptide and re-cultured in CM pH 7.4 with 10 mcg/ml gp10025–33 peptide for 24–48 hours. Cell supernatants were collected and IFN-γ production was measured by ELISA. For measurement of IFN-γ production by flow cytometry, brefeldin A (1 mcg/ml) was added to the cell culture 4 hours prior to harvest. Cells were harvested and stained with live/dead Aqua (Invitrogen) to exclude dead cells. Surface staining was done with anti-mouse CD8 APC antibody followed by intracellular staining with anti-mouse IFN-γ PE and data was acquired on the LSRII and analyzed using FlowJo software.
Treatment model
C57BL/6 mice received 200mM of sodium bicarbonate water (bicarb) three days prior to tumor injection and continued to receive bicarb water until the end of the experiment. Control mice received regular tap water. A total of 1×10⁵ B16,Yumm1.1, or Panc02 tumor cells were injected s.c. in the left flank of C57BL/6 mice. Mice received i.p. injections of 20 mg/kg of anti–PD1 or anti- CTLA4 antibodies on day 3 and continued to receive antibodies every 3 to 4 days until the end of the experiment. Mice were humanely euthanized when tumors exceeded 1.5 cm in diameter, appeared necrotic, or interfered with locomotion. Tumors were collected and weighed.
Adoptive T cell therapy
C57BL/6 mice received 200 mM of sodium bicarbonate water (bicarb) three days prior to tumor injection and continued to receive bicarb water until the end of the experiment. Control mice received regular tap water. A total of 1×10⁵ B16 tumor cells were injected s.c. in the left flank of C57BL/6 mice. Three days later, mice received a sub lethal dose (600 cGy) of total body irradiation (TBI) administered by an X-ray irradiator. For adoptive transfer experiments, T cells were isolated from the spleens of pmel mice and cultured in media containing 10 IU/ml of IL-2 and 5ug/ml of gp10025–33 in vitro for 5 days. On day 4 following tumor injection, 5×10⁶ T cells were i.v. injected. IL-2 (2.5e5 IU) was given i.p. following T cell injection, continuing every 12 hours for three days, for a total of six injections. Following this treatment, tumor size was measured and recorded every 2 days.
Flow cytometry
Spleens and tumors were harvested under sterile conditions. Single-cell suspensions were prepared, and red blood cells were removed using ACK lysis buffer. Tumor cell suspensions were prepared from solid tumors by enzymatic digestion in HBSS (Life Technologies) containing 1 mg/ml collagenase, 0.1 mg/ml DNAse I, and 2.5 U/ml of hyaluronidase (all from Sigma-Aldrich) with constant stirring for 2 hours at room temperature. The resulting suspension was passed through a 70-um cell strainer and washed once with HBSS. Cells were resuspended in PBS + 3% BSA to a concentration of 0.5−1×10⁶ cells/ml for flow cytometric analysis. After RBC lysis with ACK buffer, cells were stained in FACS buffer with the following antibodies for flow cytometric analysis: CD3, CD4, CD8 for T cell detection and CD11b, Ly6G, Ly6C for MDSC detection (all from BD Bioscience, San Diego, CA). Live/dead fixable near-IR or aqua fluorescent reactive dyes (Invitrogen) were used to exclude dead cells before analysis. Cells were acquired by LSR II equipped with four lasers (BD Biosciences), and the data were analyzed with FlowJo (Tree Star, Ashland, OR).
Intracellular pH measurement
Pmel T cells cultured at pH 7.4 for 24 hr in the presence of gp10025–33 peptide for 24 hr. Cells were washed and resuspended in serum free media and SNARF-1 acetoxymethyl ester acetate (Life technologies) was added to a final concentration of 10 uM. After 30 min incubation, cells were split into two aliquots that were washed 2 times with PBS at either pH 6.6 or 7.4. In last wash, each of the two aliquots were again split into two aliquots at each pH and resuspended in either regular PBS at the respective pH; or resuspended in high-K PBS + 10 uM nigericin at the respective pH. Samples were then analyzed by flow cytometry with laser excitation ~543 nm and emissions at 540 and 680 nm. Ratios of fluorescence emission intensities of SNARF-1 at 580 and 640 nm are sensitive to pH were then plotted.
qRT-PCR
RNA was extracted using RNeasy isolation kit (Qiagen). Real-time quantitative PCR (RT-qPCR) was then carried out using iTaq Universal SYBER Green One-Step kit (Bio-Rad) using primers sequence listed below. Results were normalized using 36B4 then expressed as fold change (FC) = 2−ΔΔCt, where ΔΔCt = (CtTarget − Ct36B4)assay − (CtTarget − Ct36B4)control(37).
|
| ||
| Primers | Sequence | |
|
| ||
| 36B4 | Forward | 5′-CCGATCTGCAGACACACACT-3′ |
| Reverse | 5′-TCCAGCAGGTGTTTGACAAC-3′ | |
|
| ||
| INF-γ | Forward | 5′CGCTTATGTTGTTGCTGATGG-3′…………… |
| Reverse | 5′CACACTGCATCTTGGCTTTG-3′……………… | |
|
| ||
Statistical analyses
As indicated, unpaired Mann-Whitney or two-sided Student’s t-tests were used to compare between two treatment groups. All statistical evaluations of data were performed using Graph Pad Prism software. Statistical significance was achieved at p<0.05.
Results
To investigate the effect of pH on T cell activation in vitro, we used CD8+ T cells isolated from pmel mice, which transgenically express a TCR specific for the melanocyte-associated peptide, gp10025–33. These T cells were cultured with gp10025–33 peptide for 48 hours at neutral pH and then further incubated with gp10025–33 peptide at acidic (6.6) or alkaline (7.4) pH for an additional 24 or 48 hours. As shown in Figure 1A, there was no significant difference in the cell viability under acidic, compared to alkaline, conditions. However, at the same time, we observed a decrease in cell-associated IFN-γ (Figure 1B). In subsequent studies, we observed that secretion of this cytokine was completely abolished in T cells cultured under acidic conditions (Figure 1C). The effects of acidic pH were not due to irreversible effects on CD8+ signaling, as T cells exposed to pH 6.6 for 24 hours and then shifted to pH 7.4 for 24 hours regained the ability to secrete high levels of IFN-γ (Figure 1D). Identical results were observed when CD8+ T cells isolated from OT-1 mice, which transgenically express a TCR specific for the ovalbumin peptide (OVASIINFEKL), were activated with OVASIINFEKL peptide at low pH (Figure 1E). We also observed a decreased secretion of TNF-alpha by pmel and OT-I T cells cultured at pH 6.6 (data not shown). Although a similar effect was observed in T cells isolated from OTII mice which are CD4+ T cells specific for OVA323–339, it was not as dramatic due a high constitutive elaboration of IFN-γ from these T cells (Figure 1F). The suppression of IFN-γ was post-transcriptional, as the IFN-γ mRNA levels were not significantly different in activated pmel T cells incubated at pH 6.6, compared to those at pH 7.4 (Figure 2A). This inhibition was also not mediated by changes in the intracellular pH. Mammalian cells in general, and immune cells in particular, have robust mechanisms that maintain a constant intracellular pH (pHi) when they are exposed to an acidic extracellular pH (pHe)(38). Indeed, it has previously been shown that when lymphocytes in pHe 7.4 complete media are then exposed to pHe 6.7, the pHi decreases only from 7.3 to 7.15(33). In the current study, pHi of activated T cells was measured by flow cytometry using the pH-sensitive dye, SNARF-1. The fluorescence ratios of activated T cells at pH 7.4 and 6.6 were similar, indicating that the pHi was not different, even after exposure to different pHe values (Figure 2B). One possibility is that the effects of acidic pHe on CD8+ T cell IFN-γ secretion were mediated via one or more acid-sensing receptors (34), such as ASIC3, ASIC4, OGR1 and TDAG8 which are all expressed in pmel CD8+ T cells (Table 1). Evidence suggest that the effect is transduced via cAMP signaling (a TDAG8 target), as forskolin, a cAMP agonist, significantly attenuated IFN-γ production, even at pH 7.4 (Figure 2C). Also, the effect does not appear to be mediated via the PI3K pathway (an OGR1 target), as inhibition of PI3K failed to rescue IFN-γ production at low pH and, indeed, led to a general inhibition at all pHs (Supplemental Figure S1). A known function of cAMP-activated protein kinase-A (PKA) is to inhibit glycolysis. We observed that activated pmel T cells at low pH had high oxygen consumption rates (OCR) and low glucose-stimulated acidification rates (ECAR) compared to cells cultured at high pH (Figure 3). A similar effect was observed in OT-I T cells stimulated with OVASIINFEKL peptide (Supplemental Figure S2). Unstimulated T cells are not metabolically active and there is no effect of low pH (data not shown). This reduction of glycolysis may be consistent with the observed sequestration of IFN-γ mRNA in cells with low glycolytic rates (39). To investigate the acid sensor, TDAG8, in more detail, T cells were isolated from TDAG8 knockout (TDAG8 k/o) or wild-type (WT) mice and stimulated in the presence of anti-CD3 antibodies for 48 hours at pH 6.6 or 7.4. In both TDAG8 k/o and WT T cells, IFN-γ production was abolished at pH 6.6 (Supplemental Figure S3). This suggests that TDAG8 alone is not responsible for the extracellular sensing of acidity. Investigations into this and other acid-sensing receptors are ongoing, to determine whether inhibition alone or in combination, is effective in rescuing the phenotype at low pH.
Figure 1. Effect of pH on activation of T cells.
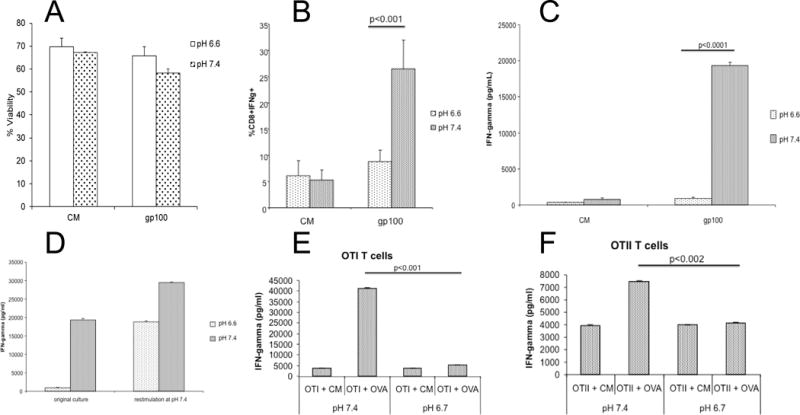
T cells were activated at pH 7.4 for 48 hr with either gp10025–33 peptide (pmel T cells, panels A–D) or OVASIINFEKL peptide (OT-1 or OT-2 T-cells, panel E–F), or left unactivated in complete media (CM) followed by an incubation at either pH 6.6 or 7.4 for an additional 24 hr. (A) percent cell viability of CD8+ pmel T cells following the entire treatment as measured by flow cytometry; (B) percent of CD8+ pmel T cells that contained IFN-γ as measured by flow cytometry. (C) amount of IFN-γ secreted into the media by pmel T cells as measured by ELISA following the 2nd 24 hr incubation at pH 6.6 or 7.4; (D) IFN-γ production by pmel T cells after re-plating from pH 6.6 to 7.4 as measured by ELISA. Activated pmel T cells were cultured in CM for 24 hours at pH 6.6 or 7.4 (original culture). After 24 hours, cells were collected and replated at pH 7.4 with gp100 peptide (restimulation at pH 7.4). Culture supernatants were collected after 24h for IFN-γ measurement by ELISA. (E) IFN-γ secreted into the media by CD8+ OT-1 T cells measured by ELISA following a 2nd 24 hr incubation at pH 6.7 or 7.4. (F) shows the amount of IFN-γ secreted into the media by CD4+ OT-II T cells measured by ELISA following the 2nd 24 hr incubation at pH 6.7 or 7.4. Data shown as mean ± SD from a minimum of three independent experiments. P-values were determined by two-tailed Student’s t-test.
Figure 2. T cell characteristics.
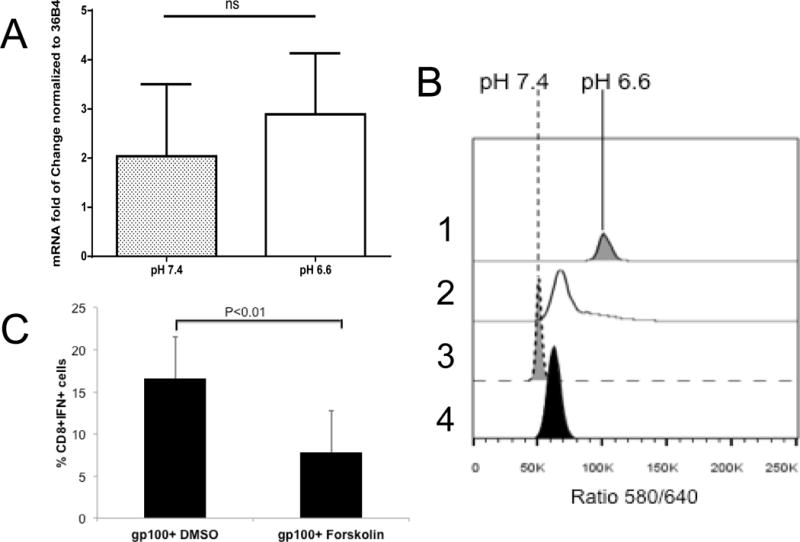
(A) IFN-γ mRNA levels are unaffected by pH. Levels of IFN-γ mRNA in pmel T cells following 48 hr stimulation at pH 7.4 and subsequent incubation at pH 7.4 or 6.6 for a subsequent 24 hr. Data were normalized to ribosomal protein 36B4 and expressed as mean ratio ± SD from three independent experiments; (B) Intracellular pH (pHin) of activated T cells is unaffected by incubation pH. Pmel T cells were activated as above, and then incubated at pH 6.6 or 7.4 for 24 hr, after which they were loaded with SNARF-1 AME, washed and resuspended in PBS (2,4) or high K/nigericin (1,3) at pH 6.6 (1,2) or 7.4 (3,4) and the 580/640 fluorescence ratio subsequently determined by flow cytometry. The ratio shows that the pHin values of cells in PBS at low and high pH were both ~7.2, and the ratios in nigericin show pH calibration points. (C). Forskolin inhibits T cell function. Activated pmel T cells were cultured with DMSO or forskolin in the presence of gp100 peptide. After 24h, intracellular IFN-γ was measured by flow cytometry. Data represent results from 3 separate experiments and p-values were determined using two-tailed Student’s t-test.
Table 1.
H+ sensors in T-cells (qRT-PCR)
| Receptor | Level | 2nd messenger |
|---|---|---|
| ASIC -1 | + | [Ca2+] |
| ASIC -2 | − | [Ca2+] |
| ASIC -3 | ++++ | Na+ |
| ASIC -4 | +++ | Na+ |
| TRPV | − | [Ca2+] |
| GPR4 | − | cAMP |
| TDAG8 | +++ | cAMP |
| OGR1 | ++++ | PI3K |
Figure 3. pmel T cell metabolism.
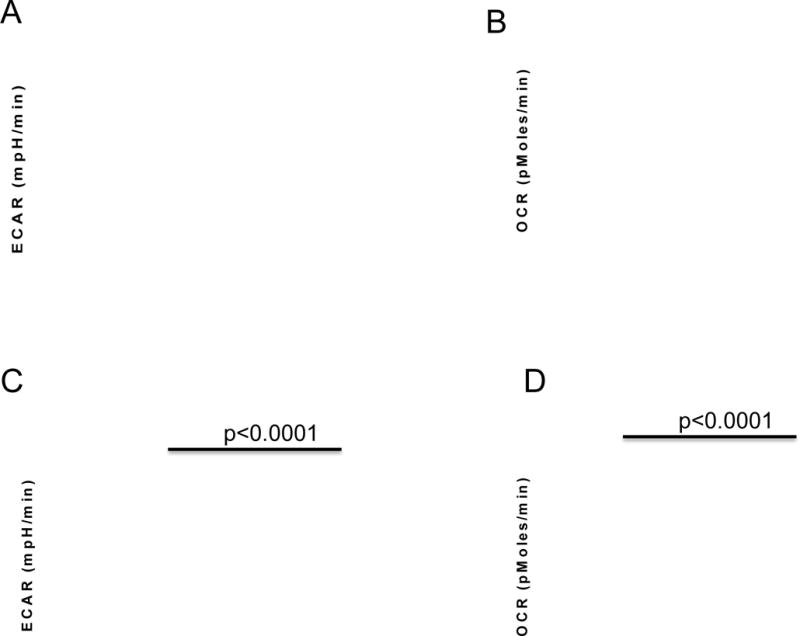
Pmel T cells were activated with gp10025–33 peptide for 48 hr, followed by a subsequent 48 h incubation at either pH 6.7 or 7.4. Cells were subsequently metabolically profiled using a Seahorse XF-96 analyzer. (A) Representative results of a glucose stress tests (GST) which measures extracellular acidification rate (ECAR) following addition of glucose, oligomycin and 2-deoxy glucose; (B) rRepresentative results of a mitochondrial stress test (MST) which measures the oxygen consumption rate (OCR) in glucose-containing media following sequential additions of oligomycin, FCCP and Rotenone/Antimycin A. See Materials and Methods for description of GST and MST. (C) Acidosis inhibits T cell glycolysis. Data show the glucose-stimulated increase in ECAR; (D) Acidic cells are more oxidative. Data show the basal OCR for activated cells incubated at pH 6.7 or 7.4. Data represent results form 3 separate experiments, with 6 replicates per experiment. A two-tailed Student t-test was used to calculate statistical significance.
In vivo, the acidic extracellular pH of tumors can be increased by providing mice with 200 mM ad lib sodium bicarbonate (bicarb) in drinking water (Figure 4A). In numerous previous studies, this effect was shown to be specifically caused by buffering the pH of tumors, as it does not cause systemic alkalization, nor is it due to the additional sodium load. These results were consistent with prior work in animal models where oral buffers that raise tumor pH were shown to inhibit spontaneous and experimental metastases (27,40–42). In prior studies, bicarb has shown little-to-no effect on the growth rate of primary human tumor xenografts neither in immune-deficient mice, nor in fast-growing and aggressive B16 melanoma tumors in immunecompetent mice(28). However, in a transgenic (TRAMP) model of prostate cancer, bicarb therapy was shown to impair tumor development and subsequent metastases (41). In the current study, as before, bicarb therapy had no effect on the growth rate of B16 tumors in immune competent C57BL/6 mice (Figure 4B). However, there were significant (p<0.01) effects of bicarbonate monotherapy on the growth of Yumm1.1 melanoma (Figure 4C, 4D). Notably, bicarb therapy led to significant increases in CD8+ T cell infiltrates into the Yumm 1.1 tumor (Figure 4E). Bicarb monotherapy had no effect on T cell infiltration into B16 tumors (data not shown) consistent with a lack of effect on primary tumor growth.
Figure 4. Buffer monotherapy in vivo.
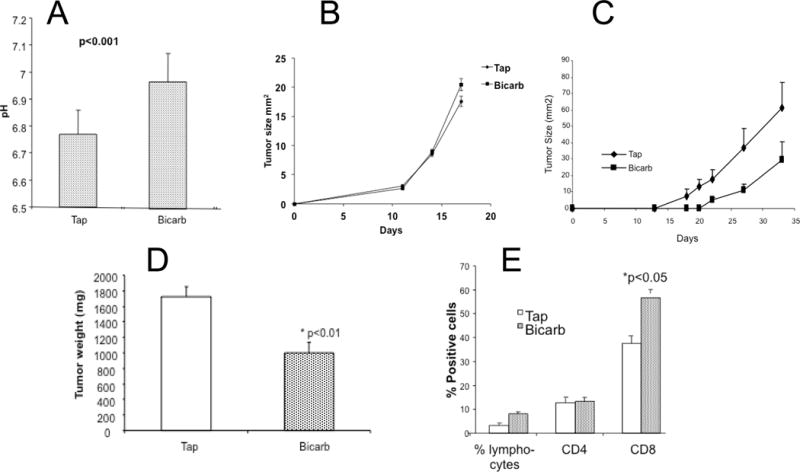
Animals bearing syngeneic melanoma tumors were treated with or without 200 mM ad lib NaHCO3 (bicarb) in their drinking water. (A) Bicarb raises extracellular pH. The extracellular pH levels were measured with microelectrode in B16 tumors treated with or without 200 mM sodium bicarbonate therapy. Four separate animals were investigated under each condition and a minimum of four measurements were made in each tumor along a single needle track (p<0.001); (B) Bicarb does not affect B16 tumor growth. Mice bearing B16 tumors were treated with or without buffer therapy, showing no effect on tumor growth (n = 8 mice/group); (C) Bicarb inhibits Yumm 1.1 tumor growth. Mice bearing Yumm1.1 tumors were treated with or without buffer therapy, showing effect on tumor growth with time (n = 8 mice/group); Panel D shows the resected tumor weights at the endpoint from this experiments (P<0.01) and Panel E shows the flow quantified relative numbers of CD8+ and CD4+ T cells infiltration into Yumm1.1 tumors (n = 8 mice/group; p<0.05 tap vs. bicarb CD8 cells; CD4 not significant).
B7 and PD-L1/L2 ligands are ligands expressed by antigen presenting cells that inhibit T cell activation by binding to cognate checkpoint receptors CTLA4 and PD1, respectively(43,44), that are expressed on CD8+ cytotoxic T cells. Neutralizing antibodies against CTLA4 and PD1 are being used clinically to prolong anti-tumor T cell responses, and, in trials to date, response rates in melanoma range from 18–35%(6,7). Given the inhibitory effect of acidosis on T cells, and the reversal of acidosis with buffers, we therefore assessed if bicarb would augment anti-tumor responses in combination with anti-CTLA4 or anti-PD1 antibody therapy. We observed that combinations of bicarb therapy with anti-CTLA4 (Figures 5A, B;) or anti-PD1 (Figure 5C, D) antibodies significantly improved the anti-tumor effects of these therapies in the B16 melanoma model that was resistant to bicarb alone. Although the effects on tumor growth appear modest, the morphologies of the tumors were dramatically affected by bicarb, in that they were macroscopically more vascularized, compared to controls (Supplemental Figure S4). This was not a systemic effect, as there were no differences in splenic T cell responses induced by bicarb in combination with PD-1 (Supplemental Figure S4). In patients, anti-PD1 and anti-CTLA4 antibody therapies are being increasingly used in combination. When these agents were combined, there were only modest effects of adding bicarb therapy (Figure 5E), likely because the combination of these checkpoint inhibitors was by itself so effective. Notably, bicarb in combination with either checkpoint inhibitor was as effective in suppressing tumor growth as the two-checkpoint inhibitor combination (cf. Figure 5E with 5A or 5C). Notably, the combination of bicarb with PD-1 checkpoint blockade was also effective in a Panc02 pancreatic cancer model. In this system, treatment with bicarb or anti-PD1 antibody alone had no effect on tumor growth, whereas tumors treated with combination were significantly (P<0.005) smaller (Figure 5F).
Figure 5. Buffer therapy enhances efficacy of anti-immune therapy in B16 melanoma.
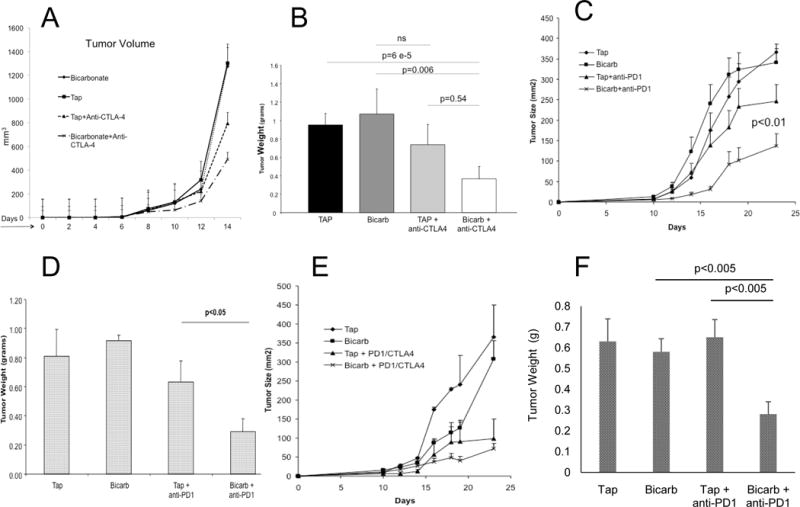
C57BL/6 mice received tap water or tap water containing 200 mM NaHCO3 (bicarb) ad lib 3 days prior to tumor inoculation with 1×10⁵ tumor cells injected s.c. in the left flank (n= 10 mice/group). Three days later, animals subsequently received i.p. injections of 20 mg/kg of anti–PD1 and/or anti-CTLA4 antibodies and continued to receive antibodies every 3 to 4 days until the end of the experiment. Tumors sizes were measured every 2–3 days and at the endpoint, tumors were excised, weighed and extracted for T cell repertoire or prepared for histology. (A, B) Bicarb improved CTLA4 therapy in B16 melanoma. Panel A shows growth of B16 tumors in mice treated with anti-CTLA4 antibody, with or without bicarb therapy. Tumor weights are shown in Panel B. (C, D) Bicarb improved PD1 therapy in B16. Panel A shows growth of B16 tumors in mice treated with anti-PD1 antibody, with or without bicarb therapy; tumor weights are shown in Panel D. (E) Bicarb does not add to combination checkpoint blockade. Panel shows growth of B16 tumors in mice treated with the combination of anti-CTLA4 and anti-PD1 antibodies with or without bicarb therapy. Differences between checkpoint combination with or without bicarbonate were not significant. (F) Bicarb improved PD1 therapy in Panc02. Data show weights of Panc02 tumors in mice (n=10 per group) treated with combination of anti-PD1 antibodies with or without bicarb therapy.
Anti-cancer immune therapy also includes the adoptive cell transfer (ACT) of tumor-specific T cells. In ACT, syngeneic recipient mice bearing B16 melanomas were treated with 600 rad of total body irradiation (TBI) to deplete peripheral PBMCs, and 1 day later were infused with 10 million activated pmel (Thy1.1) T cells and subsequently treated twice a day with 250,000 IU of IL-2 for 3 days. As expected, adoptive transfer alone caused significant reductions in the tumor growth rates, yet an improved anti-tumor response was evident, albeit not significantly, in combination with bicarb (Figure 6A). However, long-term follow up showed that the combination of bicarbonate + ACT led to a long-term (censored at120d) survival rate of 40%, compared to 10% for ACT with pmel T cells alone (Figure 6B). Importantly, the beneficial effects of bicarb were associated with significant increases in T cell persistence (Figure 6C), a sensitive biomarker for response to adoptive T cell therapy(45).
Figure 6. Effect of bicarb on adoptive T cell transfer.
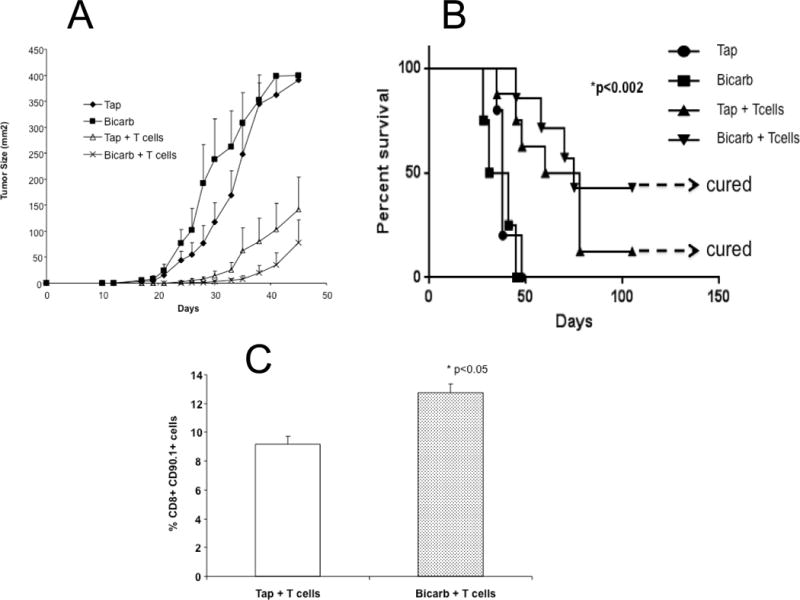
C57BL/6 mice (n = 10 per group) received tap water or tap water containing 200 mM NaHCO3 (bicarb) ad lib 3 days prior to tumor inoculation with 1×10⁵ B16 cells injected s.c. in the left flank. Three days after inoculation, mice received a sub lethal dose (600 cGy) of total body irradiation (TBI) administered by an X-ray irradiator. For adoptive transfer experiments, T cells were isolated from the spleens of pmel mice and cultured in media containing 10 IU/ml of IL-2 and 5ug/ml of gp10025–33 in vitro for 5 days. On day 4 following tumor injection, 5×10⁶ T cells were injected intravenously. IL-2 (2.5e5 IU) was given i.p. following T cell injection, and continued every 12 hours for three days, for a total of six injections. Following this treatment, tumor size was measured and recorded every 2 days. (A) shows tumor growth after adoptive transfer of T cells or controls in combination with or without buffer therapy. Group mean differences between T cells vs. T cells + bicarb were not significant. However there was a survival advantage, as shown in the survival curve, (B) which had a log rank p = 0.002; (C) shows the percent of T cell persistence after adoptive transfer and buffer therapy (p<0.05).
Discussion
In the current work, we have shown that the acidic pH encountered in a tumor microenvironment has significant immunosuppressive effects. In vitro, acid pH was shown to profoundly inhibit T cell responses, including an abrogation of IFN-γ and TNF-α secretion, suggesting that an acidic environment may lead to a general block of translation of pro-inflammatory cytokines. This does not appear to be a general blockade of exocytosis, as the intracellular levels of IFN-γ protein were likewise reduced and, indeed, low pH has been shown to stimulate exocytosis in a number of systems (46). An inhibition of glycolytic activation, which is necessary for T cell activation, was also observed. Additional studies will be required to define the molecular mechanisms leading to inhibition of glycolytic activation by acid pH in this system. This is a significant scientific problem as acid-induced inhibition of glycolysis is known to occur in almost all systems, yet the signal transduction events are unknown. In vivo, treatment of mice bearing melanoma with bicarbonate therapy raised tumor pH and increased the durable response rates to both checkpoint inhibition (PD-1, CTLA4) and adoptive cell therapy. In prior work, we have shown that buffer therapy induces “compensated metabolic alkalosis”, and works by buffering the tumor pH to more neutral values, without affecting systemic pH (47).
We have calculated from these mouse studies that the human equivalent dose would be bicarb at 800 mg kg−1 d−1. This dose is clinically achievable, and early phase 1 clinical trials of bicarbonate therapy have been conducted. Buffer therapy is a direct targeting of the tumor pH, but there are alternative, pharmacological approaches that may indirectly induce achieve compensated metabolic alkalosis, such as K-sparing diuretics (furosemide), or pan-specific carbonic anhydrase inhibitors (acetazolamide). Although experimental, other approach could target the rate of tumor acid production, through either isoform-specific CAIX inhibitors (DH-348), or inhibition of LDH-A (FX-11). The ability of these agents to neutralize tumor pH is not known, nor are their effects on anti-tumor immune therapy.
Harold Dvorak famously characterized tumors as “wounds that do not heal” (48). One component of the wound response is a transient ischemia-driven tissue acidification, which resolves as the wound heals (49). The role of acidification in physiological wound healing is not known with certainty, but recent data suggest that acidification stimulates production of inflammatory cytokines by the stroma or endothelium (50). As these induce neo-angiogenesis, the acidosis is reduced and inflammation resolves. Our data and work cited herein would suggest that, while acidification may send an inflammatory signal, T cells are unable to activate until the pHe becomes more alkaline. In tumors, this acidification never resolves, and artificially raising the pH of tumors through buffer therapy allows the “wound” to heal by promoting anti-tumor immunity.
Supplementary Material
Acknowledgments
AE-K is also affiliated with Department of Pharmacology and Toxicology, Faculty of Pharmacy, Mansoura University, Egypt. The author would also like to acknowledge Ms. Ellen Moore for technical assistance, and Dr. Estaban Celis for early discussions of this approach.
Grant Support: USPHS Grant R01CA077575 (R.J. Gillies); P50CA168536 (S. Pilon-Thomas); P30CA076292 (Moffitt Cancer Center Support Grant);
Footnotes
Conflicts of Interest: R.J. Gillies is shareholder in and member of scientific advisory board of Health-Myne, Inc. S. Pilon-Thomas is grant recipient from Lion Biotechnologies, Inc.
References
- 1.Schneider H, Downey J, Smith A, Zinselmeyer BH, Rush C, Brewer JM, et al. Reversal of the TCR stop signal by CTLA-4. Science. 2006;313(5795):1972–5. doi: 10.1126/science.1131078. [DOI] [PubMed] [Google Scholar]
- 2.Vesely MD, Kershaw MH, Schreiber RD, Smyth MJ. Natural innate and adaptive immunity to cancer. Annual review of immunology. 2011;29:235–71. doi: 10.1146/annurev-immunol-031210-101324. [DOI] [PubMed] [Google Scholar]
- 3.Hodi FS, O’Day SJ, McDermott DF, Weber RW, Sosman JA, Haanen JB, et al. Improved survival with ipilimumab in patients with metastatic melanoma. The New England journal of medicine. 2010;363(8):711–23. doi: 10.1056/NEJMoa1003466. [DOI] [PMC free article] [PubMed] [Google Scholar]
- 4.Topalian SL, Sznol M, McDermott DF, Kluger HM, Carvajal RD, Sharfman WH, et al. Survival, durable tumor remission, and long-term safety in patients with advanced melanoma receiving nivolumab. Journal of clinical oncology: official journal of the American Society of Clinical Oncology. 2014;32(10):1020–30. doi: 10.1200/JCO.2013.53.0105. [DOI] [PMC free article] [PubMed] [Google Scholar]
- 5.Taube JM, Klein A, Brahmer JR, Xu H, Pan X, Kim JH, et al. Association of PD-1, PD-1 ligands, and other features of the tumor immune microenvironment with response to anti-PD-1 therapy. Clinical cancer research: an official journal of the American Association for Cancer Research. 2014;20(19):5064–74. doi: 10.1158/1078-0432.CCR-13-3271. [DOI] [PMC free article] [PubMed] [Google Scholar]
- 6.Topalian SL, Hodi FS, Brahmer JR, Gettinger SN, Smith DC, McDermott DF, et al. Safety, activity, and immune correlates of anti-PD-1 antibody in cancer. The New England journal of medicine. 2012;366(26):2443–54. doi: 10.1056/NEJMoa1200690. [DOI] [PMC free article] [PubMed] [Google Scholar]
- 7.Wolchok JD, Neyns B, Linette G, Negrier S, Lutzky J, Thomas L, et al. Ipilimumab monotherapy in patients with pretreated advanced melanoma: a randomised, double-blind, multicentre, phase 2, dose-ranging study. The Lancet Oncology. 2010;11(2):155–64. doi: 10.1016/S1470-2045(09)70334-1. [DOI] [PubMed] [Google Scholar]
- 8.Fourcade J, Sun Z, Benallaoua M, Guillaume P, Luescher IF, Sander C, et al. Upregulation of Tim-3 and PD-1 expression is associated with tumor antigen-specific CD8+ T cell dysfunction in melanoma patients. The Journal of experimental medicine. 2010;207(10):2175–86. doi: 10.1084/jem.20100637. [DOI] [PMC free article] [PubMed] [Google Scholar]
- 9.Fourcade J, Sun Z, Pagliano O, Guillaume P, Luescher IF, Sander C, et al. CD8(+) T cells specific for tumor antigens can be rendered dysfunctional by the tumor microenvironment through upregulation of the inhibitory receptors BTLA and PD-1. Cancer research. 2012;72(4):887–96. doi: 10.1158/0008-5472.CAN-11-2637. [DOI] [PMC free article] [PubMed] [Google Scholar]
- 10.Yang ZZ, Grote DM, Ziesmer SC, Niki T, Hirashima M, Novak AJ, et al. IL-12 upregulates TIM-3 expression and induces T cell exhaustion in patients with follicular B cell non-Hodgkin lymphoma. The Journal of clinical investigation. 2012;122(4):1271–82. doi: 10.1172/JCI59806. [DOI] [PMC free article] [PubMed] [Google Scholar]
- 11.Wolchok JD, Kluger H, Callahan MK, Postow MA, Rizvi NA, Lesokhin AM, et al. Nivolumab plus ipilimumab in advanced melanoma. The New England journal of medicine. 2013;369(2):122–33. doi: 10.1056/NEJMoa1302369. [DOI] [PMC free article] [PubMed] [Google Scholar]
- 12.Diaz-Montero CM, Salem ML, Nishimura MI, Garrett-Mayer E, Cole DJ, Montero AJ. Increased circulating myeloid-derived suppressor cells correlate with clinical cancer stage, metastatic tumor burden, and doxorubicin-cyclophosphamide chemotherapy. Cancer immunology, immunotherapy: CII. 2009;58(1):49–59. doi: 10.1007/s00262-008-0523-4. [DOI] [PMC free article] [PubMed] [Google Scholar]
- 13.Pilon-Thomas S, Nelson N, Vohra N, Jerald M, Pendleton L, Szekeres K, et al. Murine pancreatic adenocarcinoma dampens SHIP-1 expression and alters MDSC homeostasis and function. PloS one. 2011;6(11):e27729. doi: 10.1371/journal.pone.0027729. [DOI] [PMC free article] [PubMed] [Google Scholar]
- 14.Matsushita N, Pilon-Thomas SA, Martin LM, Riker AI. Comparative methodologies of regulatory T cell depletion in a murine melanoma model. Journal of immunological methods. 2008;333(1–2):167–79. doi: 10.1016/j.jim.2008.01.012. [DOI] [PMC free article] [PubMed] [Google Scholar]
- 15.Peranzoni E, Zilio S, Marigo I, Dolcetti L, Zanovello P, Mandruzzato S, et al. Myeloid-derived suppressor cell heterogeneity and subset definition. Current opinion in immunology. 2010;22(2):238–44. doi: 10.1016/j.coi.2010.01.021. [DOI] [PubMed] [Google Scholar]
- 16.Nagaraj S, Gabrilovich DI. Myeloid-derived suppressor cells in human cancer. Cancer journal. 2010;16(4):348–53. doi: 10.1097/PPO.0b013e3181eb3358. [DOI] [PubMed] [Google Scholar]
- 17.Kodumudi KN, Woan K, Gilvary DL, Sahakian E, Wei S, Djeu JY. A novel chemoimmunomodulating property of docetaxel: suppression of myeloid-derived suppressor cells in tumor bearers. Clinical cancer research: an official journal of the American Association for Cancer Research. 2010;16(18):4583–94. doi: 10.1158/1078-0432.CCR-10-0733. [DOI] [PMC free article] [PubMed] [Google Scholar]
- 18.Fallarino F, Grohmann U, Puccetti P. Indoleamine 2,3-dioxygenase: from catalyst to signaling function. European journal of immunology. 2012;42(8):1932–7. doi: 10.1002/eji.201242572. [DOI] [PubMed] [Google Scholar]
- 19.Lardner A. The effects of extracellular pH on immune function. Journal of leukocyte biology. 2001;69(4):522–30. [PubMed] [Google Scholar]
- 20.Ibrahim Hashim A, Zhang X, Wojtkowiak JW, Martinez GV, Gillies RJ. Imaging pH and metastasis. NMR in biomedicine. 2011;24(6):582–91. doi: 10.1002/nbm.1644. [DOI] [PMC free article] [PubMed] [Google Scholar]
- 21.Gatenby RA, Gillies RJ. Why do cancers have high aerobic glycolysis? Nature reviews Cancer. 2004;4(11):891–9. doi: 10.1038/nrc1478. [DOI] [PubMed] [Google Scholar]
- 22.Swietach P, Hulikova A, Vaughan-Jones RD, Harris AL. New insights into the physiological role of carbonic anhydrase IX in tumour pH regulation. Oncogene. 2010;29(50):6509–21. doi: 10.1038/onc.2010.455. [DOI] [PubMed] [Google Scholar]
- 23.Choi J, Jung WH, Koo JS. Metabolism-related proteins are differentially expressed according to the molecular subtype of invasive breast cancer defined by surrogate immunohistochemistry. Pathobiology: journal of immunopathology, molecular and cellular biology. 2013;80(1):41–52. doi: 10.1159/000339513. [DOI] [PubMed] [Google Scholar]
- 24.Ilie M, Mazure NM, Hofman V, Ammadi RE, Ortholan C, Bonnetaud C, et al. High levels of carbonic anhydrase IX in tumour tissue and plasma are biomarkers of poor prognostic in patients with non-small cell lung cancer. British journal of cancer. 2010;102(11):1627–35. doi: 10.1038/sj.bjc.6605690. [DOI] [PMC free article] [PubMed] [Google Scholar]
- 25.Choschzick M, Oosterwijk E, Muller V, Woelber L, Simon R, Moch H, et al. Overexpression of carbonic anhydrase IX (CAIX) is an independent unfavorable prognostic marker in endometrioid ovarian cancer. Virchows Archiv: an international journal of pathology. 2011;459(2):193–200. doi: 10.1007/s00428-011-1105-y. [DOI] [PubMed] [Google Scholar]
- 26.Estrella V, Chen T, Lloyd M, Wojtkowiak J, Cornnell HH, Ibrahim-Hashim A, et al. Acidity generated by the tumor microenvironment drives local invasion. Cancer research. 2013 doi: 10.1158/0008-5472.CAN-12-2796. [DOI] [PMC free article] [PubMed] [Google Scholar]
- 27.Ibrahim Hashim A, Cornnell HH, Coelho Ribeiro Mde L, Abrahams D, Cunningham J, Lloyd M, et al. Reduction of metastasis using a non-volatile buffer. Clinical & experimental metastasis. 2011;28(8):841–9. doi: 10.1007/s10585-011-9415-7. [DOI] [PMC free article] [PubMed] [Google Scholar]
- 28.Robey IF, Baggett BK, Kirkpatrick ND, Roe DJ, Dosescu J, Sloane BF, et al. Bicarbonate increases tumor pH and inhibits spontaneous metastases. Cancer research. 2009;69(6):2260–8. doi: 10.1158/0008-5472.CAN-07-5575. [DOI] [PMC free article] [PubMed] [Google Scholar]
- 29.Noritomi DT, Soriano FG, Kellum JA, Cappi SB, Biselli PJ, Liborio AB, et al. Metabolic acidosis in patients with severe sepsis and septic shock: a longitudinal quantitative study. Critical care medicine. 2009;37(10):2733–9. doi: 10.1097/ccm.0b013e3181a59165. [DOI] [PubMed] [Google Scholar]
- 30.Calcinotto A, Filipazzi P, Grioni M, Iero M, De Milito A, Ricupito A, et al. Modulation of microenvironment acidity reverses anergy in human and murine tumor-infiltrating T lymphocytes. Cancer research. 2012;72(11):2746–56. doi: 10.1158/0008-5472.CAN-11-1272. [DOI] [PubMed] [Google Scholar]
- 31.Vishvakarma NK, Singh SM. Immunopotentiating effect of proton pump inhibitor pantoprazole in a lymphoma-bearing murine host: Implication in antitumor activation of tumor-associated macrophages. Immunology letters. 2010;134(1):83–92. doi: 10.1016/j.imlet.2010.09.002. [DOI] [PubMed] [Google Scholar]
- 32.Vishvakarma NK, Singh SM. Augmentation of myelopoiesis in a murine host bearing a T cell lymphoma following in vivo administration of proton pump inhibitor pantoprazole. Biochimie. 2011;93(10):1786–96. doi: 10.1016/j.biochi.2011.06.022. [DOI] [PubMed] [Google Scholar]
- 33.Bental M, Deutsch C. An NMR view of Primary T-Lymphocyte Activation. In: Gillies RJ, editor. NMR in Physiology and Biomedicine. Vol. 1. New York: Academic Press; 1994. [Google Scholar]
- 34.Damaghi M, Wojtkowiak JW, Gillies RJ. pH sensing and regulation in cancer. Frontiers in physiology. 2013;4:370. doi: 10.3389/fphys.2013.00370. [DOI] [PMC free article] [PubMed] [Google Scholar]
- 35.Ishii S, Kihara Y, Shimizu T. Identification of T cell death-associated gene 8 (TDAG8) as a novel acid sensing G-protein-coupled receptor. The Journal of biological chemistry. 2005;280(10):9083–7. doi: 10.1074/jbc.M407832200. [DOI] [PubMed] [Google Scholar]
- 36.Li Z, Dong L, Dean E, Yang LV. Acidosis decreases c-Myc oncogene expression in human lymphoma cells: a role for the proton-sensing G protein-coupled receptor TDAG8. International journal of molecular sciences. 2013;14(10):20236–55. doi: 10.3390/ijms141020236. [DOI] [PMC free article] [PubMed] [Google Scholar]
- 37.Cougoule C, Van Goethem E, Le Cabec V, Lafouresse F, Dupre L, Mehraj V, et al. Blood leukocytes and macrophages of various phenotypes have distinct abilities to form podosomes and to migrate in 3D environments. European journal of cell biology. 2012;91(11–12):938–49. doi: 10.1016/j.ejcb.2012.07.002. [DOI] [PubMed] [Google Scholar]
- 38.Hulikova A, Harris AL, Vaughan-Jones RD, Swietach P. Regulation of intracellular pH in cancer cell lines under normoxia and hypoxia. Journal of cellular physiology. 2013;228(4):743–52. doi: 10.1002/jcp.24221. [DOI] [PubMed] [Google Scholar]
- 39.Chang CH, Curtis JD, Maggi LB, Jr, Faubert B, Villarino AV, O’Sullivan D, et al. Posttranscriptional control of T cell effector function by aerobic glycolysis. Cell. 2013;153(6):1239–51. doi: 10.1016/j.cell.2013.05.016. [DOI] [PMC free article] [PubMed] [Google Scholar]
- 40.Ibrahim Hashim A, Wojtkowiak JW, Ribeiro M, Estrella V, Bailey KM, Cornnell HH, et al. Free Base Lysine Increases Survival and Reduces Metastasis in Prostate Cancer Model. J Cancer Sci Therap. 2011;2011:S1–S4. [PMC free article] [PubMed] [Google Scholar]
- 41.Ibrahim-Hashim A, Cornnell HH, Abrahams D, Lloyd M, Bui M, Gillies RJ, et al. Systemic buffers inhibit carcinogenesis in TRAMP mice. The Journal of urology. 2012;188(2):624–31. doi: 10.1016/j.juro.2012.03.113. [DOI] [PMC free article] [PubMed] [Google Scholar]
- 42.Bailey KA, Wojtkowiak J, Ibrahim Hashim A, Gillies RJ. Mechanisms of Resistance to Buffer Therapy. Cancer research. 2013 (in preparation) [Google Scholar]
- 43.Keir ME, Butte MJ, Freeman GJ, Sharpe AH. PD-1 and its ligands in tolerance and immunity. Annual review of immunology. 2008;26:677–704. doi: 10.1146/annurev.immunol.26.021607.090331. [DOI] [PMC free article] [PubMed] [Google Scholar]
- 44.McCoy KD, Le Gros G. The role of CTLA-4 in the regulation of T cell immune responses. Immunology and cell biology. 1999;77(1):1–10. doi: 10.1046/j.1440-1711.1999.00795.x. [DOI] [PubMed] [Google Scholar]
- 45.Robbins PF, Dudley ME, Wunderlich J, El-Gamil M, Li YF, Zhou J, et al. Cutting edge: persistence of transferred lymphocyte clonotypes correlates with cancer regression in patients receiving cell transfer therapy. Journal of immunology. 2004;173(12):7125–30. doi: 10.4049/jimmunol.173.12.7125. [DOI] [PMC free article] [PubMed] [Google Scholar]
- 46.Damaghi M, Tafreshi NK, Lloyd M, Sprung R, Estrella V, Wojtkowiak JW, et al. Chronic Acidosis in the Tumor Microenvironment Selects for Overexpression of LAMP2 in the Plasma Membrane. NAture Comminications. 2016 doi: 10.1038/ncomms9752. (in press) [DOI] [PMC free article] [PubMed] [Google Scholar]
- 47.Silva AS, Yunes JA, Gillies RJ, Gatenby RA. The potential role of systemic buffers in reducing intratumoral extracellular pH and acid-mediated invasion. Cancer research. 2009;69(6):2677–84. doi: 10.1158/0008-5472.CAN-08-2394. [DOI] [PMC free article] [PubMed] [Google Scholar]
- 48.Dvorak HF. Tumors: wounds that do not heal. Similarities between tumor stroma generation and wound healing. The New England journal of medicine. 1986;315(26):1650–9. doi: 10.1056/NEJM198612253152606. [DOI] [PubMed] [Google Scholar]
- 49.Ashby BS. pH studies in human malignant tumours. Lancet. 1966;2(7458):312–5. doi: 10.1016/s0140-6736(66)92598-0. [DOI] [PubMed] [Google Scholar]
- 50.Dong L, Li Z, Leffler NR, Asch AS, Chi JT, Yang LV. Acidosis activation of the proton-sensing GPR4 receptor stimulates vascular endothelial cell inflammatory responses revealed by transcriptome analysis. PloS one. 2013;8(4):e61991. doi: 10.1371/journal.pone.0061991. [DOI] [PMC free article] [PubMed] [Google Scholar]
Associated Data
This section collects any data citations, data availability statements, or supplementary materials included in this article.