

Abstract
Purpose
To examine the relationship between small hypodense regions (“holes”) in the retinal nerve fiber layer (RNFL) seen on circumpapillary optical coherence tomography (OCT) images of glaucoma patients and suspects and the paravascular inner retinal defects (PIRDs) seen with OCT line scans near blood vessels in individuals without optic nerve disease but with high myopia and/or epiretinal membranes (ERMs).
Methods
Based upon the availability of wide-field, swept-source OCT scans, 19 eyes from 15 glaucoma patients or suspects were selected from a larger group of eyes with holes on circumpapillary frequency-domain OCT scans. Paravascular defects (PDs) were identified using en face slab images generated (ATL 3D-Suite) from 52-μm slabs just below the vitreal border of the inner limiting membrane by averaging reflective intensity. Paravascular defects were confirmed with B-scans from these images.
Results
For 13 of the 19 eyes, the appearance of the PDs fit the previously described PIRDs and extended well beyond the circumpapillary region. In the other 6 eyes, the PDs were restricted to a small region and did not fit the previously described appearance of PIRDs. In these eyes, the holes were associated with an arcuate defect of the RNFL. Of the 13 with PIRDs, 9 had ERMs and/or high myopia previously associated with PIRDs in otherwise healthy eyes.
Conclusions
Holes seen on circumpapillary OCT scans of glaucoma patients and suspects are associated with local glaucomatous damage, as well as with PIRDs associated with high myopia and ERMs.
Keywords: glaucoma, optical coherence tomography, retinal nerve fiber layer, blood vessels
On circumpapillary optical coherence tomography (OCT) scans, small hyporeflective regions occur in the retinal nerve fiber layer (RNFL) of glaucoma patients and glaucoma suspects with no other known retinal or optic nerve disease.1 These “holes” can be seen in Figure 1, which shows portions of four OCT circumpapillary scans from our previous study.1 Because these holes were not seen in healthy controls,1 we suggested that they were an early indicator of local damage due to glaucoma. However, a recent study raises questions about our previous interpretation.
Figure 1.
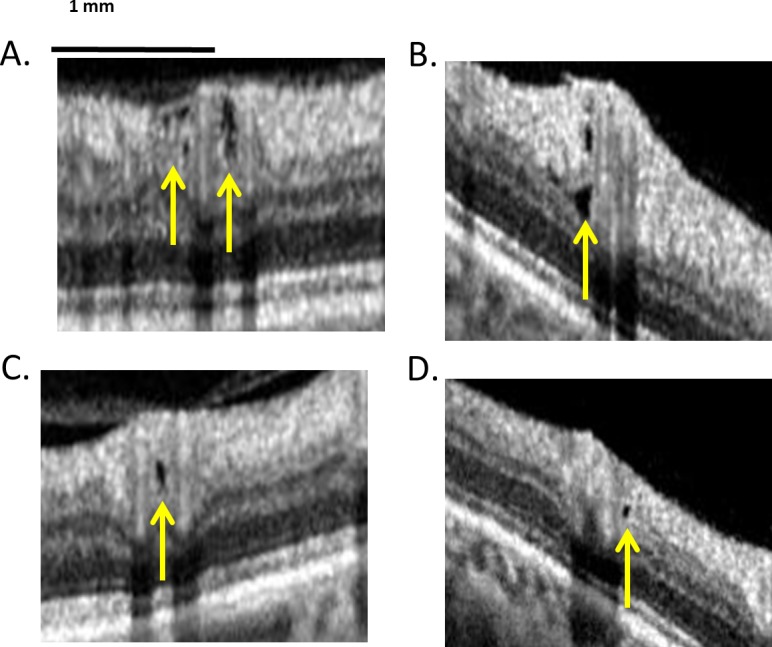
Small hyporeflective regions (“holes”) in the retinal nerve fiber layer (RNFL) of glaucoma patients and suspects. Modified with permission from Xin D, Talamini CL, Raza AS, et al. Hypodense regions (holes) in the retinal nerve fiber layer in frequency-domain OCT scans of glaucoma patients and suspects. Invest Ophthalmol Vis Sci. 2011;52:7180–7186. Copyright © 2011 Association for Research in Vision and Ophthalmology.
Muraoka et al.2 reported defects in the RNFL along blood vessels (BVs), which they termed paravascular inner retinal defects (PIRDs). On longitudinal OCT scans along BVs, the defects they reported appeared as fissures, which followed the course of the BV in the RNFL/inner retina. On OCT B-scans across BVs, PIRDs appeared as “fissure-like spaces” or “cystoids” (i.e., holes). That is, they could appear similar to the holes we reported previously (compare Figs. 1, 2B in Muraoka et al.2). Interestingly, 31 of 33 eyes in our previous study had at least one hole adjacent to a BV.1 In addition, the holes we observed were largely near the major temporal BVs and were more frequent in the upper retina, just as Muraoka et al.2 reported for PIRDs.
Figure 2.

En face slab image of eye 9 created by averaging the reflective intensity of a 52-μm slab starting from the vitreous/inner limiting membrane border, that is, the green region in lowest inset. The portions of the blood vessels (BVs) with paravascular defects (PDs) were identified on B-scans (see yellow arrows on insets) and are indicated by the red lines. The insets are either vertical or horizontal B-scan images, as indicated by the same-colored dashed line superimposed on the en face image. PDs can appear as “hole-like” (arrows in insets with blue and orange borders) or “fissure-like” (arrows in insets with red border). The white calibration bars indicate 1 mm.
On the other hand, the PIRDs seen by Muraoka et al.2 were not due to glaucoma. Their study explicitly excluded patients with glaucoma, as well as those with other conditions that can affect the RNFL. Rather, the PIRDs in their study were associated with myopia and macular epiretinal membranes (ERMs). In fact, 39 of their 41 eyes with PIRDs had ERMs (21 eyes) and/or a myopic refractive correction worse than −5 diopters (D) (27 eyes).
As a PIRD by definition tracks along a BV, it is important to know if the defects associated with the holes seen in glaucoma patients and suspects also do. We did show that the defects associated with holes could follow an arcuate path of damage, at least in some eyes.1 However, with the OCT analysis available at that time, it was difficult to follow these defects across the retina in most eyes. The newly developed en face slab analysis of swept-source (ss) OCT scans can reveal details of glaucomatous damage difficult to see by analyzing OCT B-scans.3 In particular, specialized software developed by Fortune et al. makes it easy to track the course of defects through serial OCT B-scans (Fortune B, et al. IOVS 2014;55:ARVO E-abstract 2644).
To examine the relationship between the holes observed in glaucoma patients and suspects and the PIRDs reported by Muraoka et al.,2 eyes previously identified as having holes were studied with en face slab analysis of wide-field ssOCT scans.
Methods
Participants
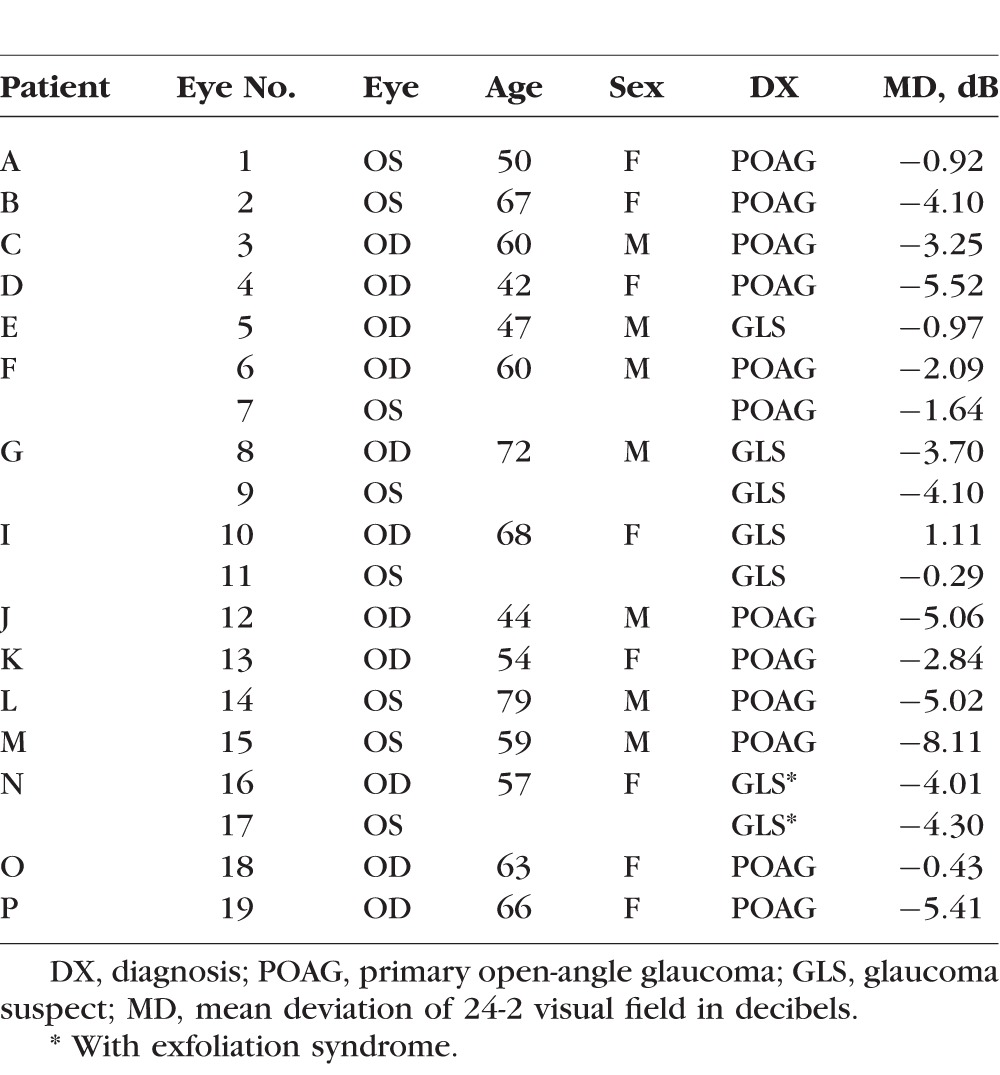
Based upon the availability of wide-field ssOCT scans, 23 eyes were selected from a larger group with holes identified on spectral-domain (sd) OCT scans as part of previous studies.1 Holes were defined based upon hyporeflective regions of the RNFL seen on circumpapillary scans (Fig. 1).1 Four of these eyes (two patients) were excluded, three because their circumpapillary scans revealed that the holes were due to retinoschisis, not associated with a BV, as described by others,4,5 and the fourth because a hole was difficult to confirm on more recent scans. Table 1 provides information about the 19 eyes (15 patients) included.
Table 1.
Patient Demographic Data
Procedures followed the tenets of the Declaration of Helsinki, and the protocol was approved by the Institutional Review Boards of Columbia University and New York Eye and Ear Infirmary. Patients were selected from an ongoing prospective study between the two institutions.
OCT Scans
All eyes had wide-field (9 × 12 mm) cube scans consisting of 256 B-scans, each with 512 A-scans, obtained with ssOCT (DRI-OCT; Topcon, Inc., Paramus, NJ, USA). In addition, all had circumpapillary circle scans obtained with ssOCT (average of 32 repetitions) and/or sdOCT (3D-OCT2000; Topcon, Inc. (average of 50 repetitions).
En Face Slab Images and Paravascular Defects
From the wide-field ssOCT scan, en face slab images were obtained as previously described3 using special purpose software (ATL 3D-Suite; Fortune B, et al. IOVS 2014;55:ARVO E-abstract 2644). In particular, the average reflective intensity was obtained for slabs with a fixed thickness of 52 μm (20 voxels) with the proximal border set as the vitreous/inner limiting membrane border. The region covered by the 52-μm slab is shaded green in the portion of a B-scan shown as the lowest inset in Figure 2. The 52-μm thickness was chosen in an earlier study to optimize the detection of subtle variations in reflective intensity of the RNFL.4 In particular, a 52-μm slab is thin enough to be affected by local variations in RNFL intensity, but thick enough to encompass the minimum RNFL width of deep glaucomatous defects. As illustrated in the lowest inset in Figure 2, it works well to reveal PIRDs because these defects in the RNFL are hyporeflective as compared to the surrounding intact RNFL. Thus, the PIRDs appear darker than the surrounding regions on the en face slab images (Fig. 2) and are easy to identify.
In fact, PIRDs that are not easily visualized on fundus photographs are clearly seen on the en face images. Because Muraoka et al.2 identified PIRDs based upon fundus photographs, it is likely that some of the subtle defects we see would not have been classified as PIRDs in their study. For this reason, we call the defects seen in en face slab images paravascular defects (PDs). We define a PD as a break in the RNFL that extends at least over three B-scans (0.11 mm) along a BV. The relation of the PDs to the previously2 described PIRDs will be considered below.
In any case, PDs were confirmed on individual horizontal B-scans from the wide-field scan and from vertical “B-scans” interpolated by the ATL software from the scan. Portions of these B-scans are shown as the insets in Figures 2 and 3. The PDs (yellow arrows) can appear as holes (blue and orange insets in Fig. 2 and red insets in Fig. 3) or fissures (red insets in Fig. 2 and yellow inset in Fig. 3), as previously described for PIRDs (see Figs. 2B, 2C in Muraoka et al.2). In fact, a combination of holes and fissures of the RNFL can be seen along the same BVs as illustrated in Supplementary Movies S1 and S2.
Figure 3.

En face slab image of eye 8, which has macular epiretinal membranes as seen on the en face image and the B-scan (white arrow in yellow inset). The yellow arrows in the insets indicate regions with PDs. The white calibration bars indicate 1 mm.
To quantify the extent of the PDs, the regions with PDs seen on OCT B-scans were marked on the en face images (red lines along the BVs in Fig. 2). The total PD length of the BV(s) associated with each hole location on the circumpapillary scan and the overall total PD length in the eye for all BVs were calculated.
Macular ERM
As Muraoka et al.2 identified macular ERM as a risk factor for PIRDs, all eyes were evaluated for ERMs in the macula. To be classified as a macular ERM, the en face slab image of wide-field ssOCT scan had to show surface wrinkling that was confirmed on horizontal and/or vertical B-scans from the ATL software. These B-scans showed a thickening of the internal limiting membrane with a gap separating it from the RNFL as illustrated in Figure 3 (white arrow in upper inset). The yellow arrows in the insets indicate regions with PDs.
Results
The Relation of Holes to BVs
Holes, as seen in Figure 1 (yellow arrows), were identified on circle scans as local hypodense regions. Because we were interested in the relation of these holes to major BVs, the BV locations, not the number of holes, were determined for each eye. For example, consider eye 9 from Figure 2, the en face slab image of which is reproduced in Figure 4A. Figure 4B is the cirumpapillary scan for this eye located as shown by the green circle in Figure 4A. In the insets below Figure 4B, holes (yellow arrows) can be seen near the superior temporal (ST; pink rectangle) and inferior temporal (IT; orange rectangle) BVs. The magenta arrows in Figures 4A and 4B indicate corresponding locations. This eye had two hole locations, ST and IT, as indicated in column 2 of Table 2. For the 19 eyes, there were 27 hole locations. The ST, IT, and superior nasal (SN) regions had 15, 11, and 1 hole location, respectively.
Figure 4.

(A) En face slab image of eye 9 from Figure 2. (B) The circle scan for eye 9. The insets below (B) show clusters of holes near the superior temporal (ST) and inferior temporal (IT) BVs. The yellow arrows indicate the location of hole(s) while the magenta arrows (A, B) indicate corresponding locations. (C, D) En face slab image of eye 2 (C), the only eye with an RNFL hole not immediately adjacent to a BV, as indicated by the yellow arrow in the inset of (D). The magenta arrows in (C, D) indicate corresponding locations, while the white arrows in (C) indicate the location of an arcuate defect. The white calibration bars indicate 1 mm.
Table 2.
Information by Eye and Hole Location
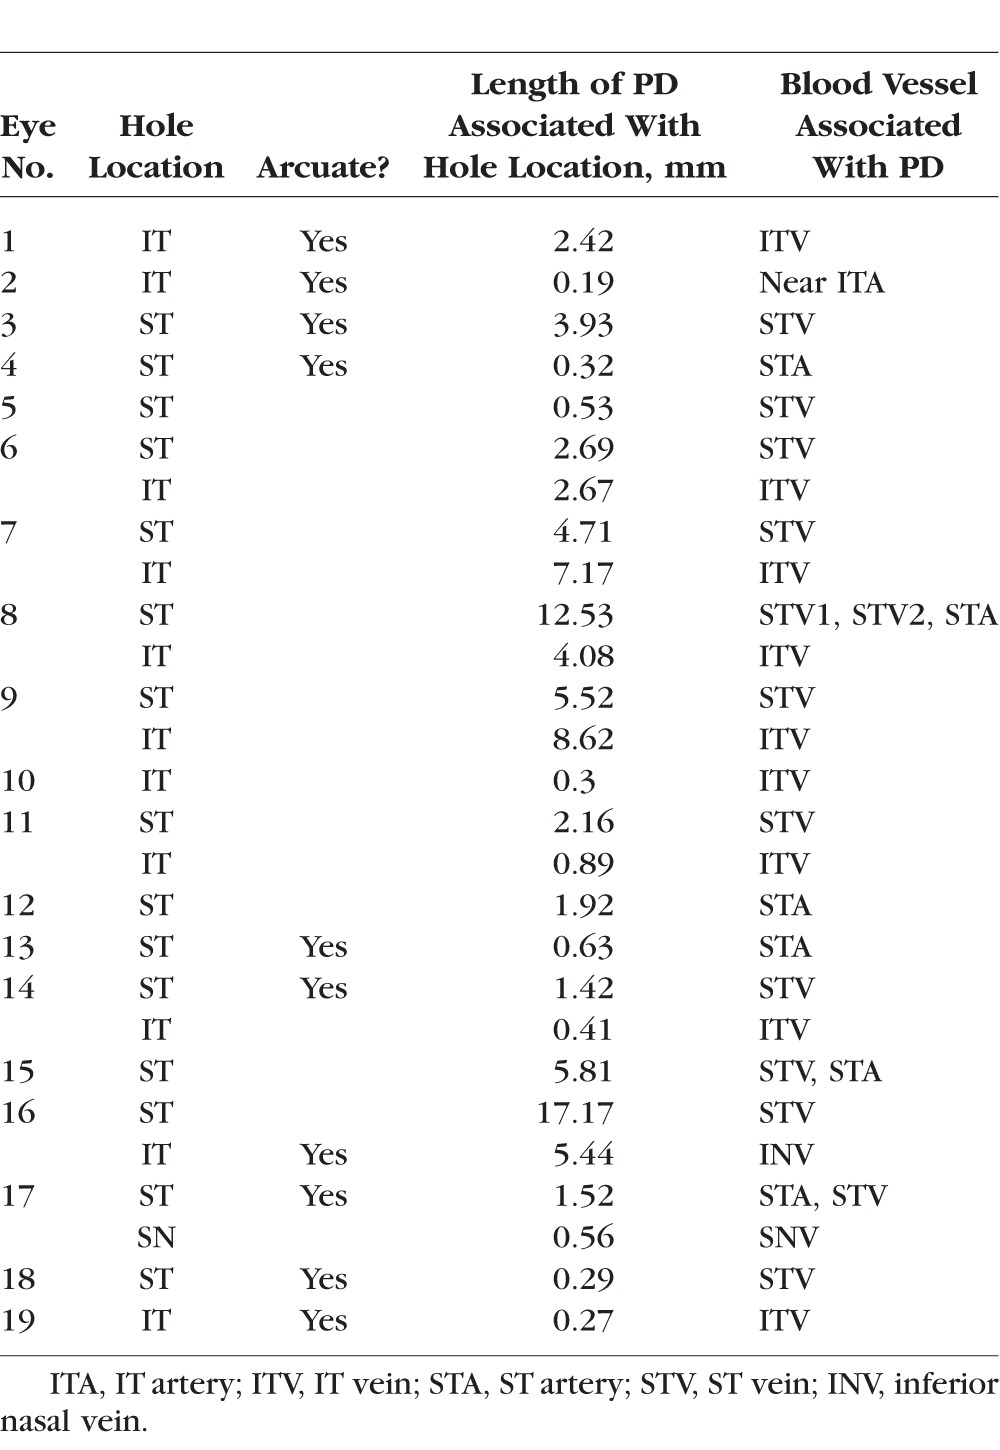
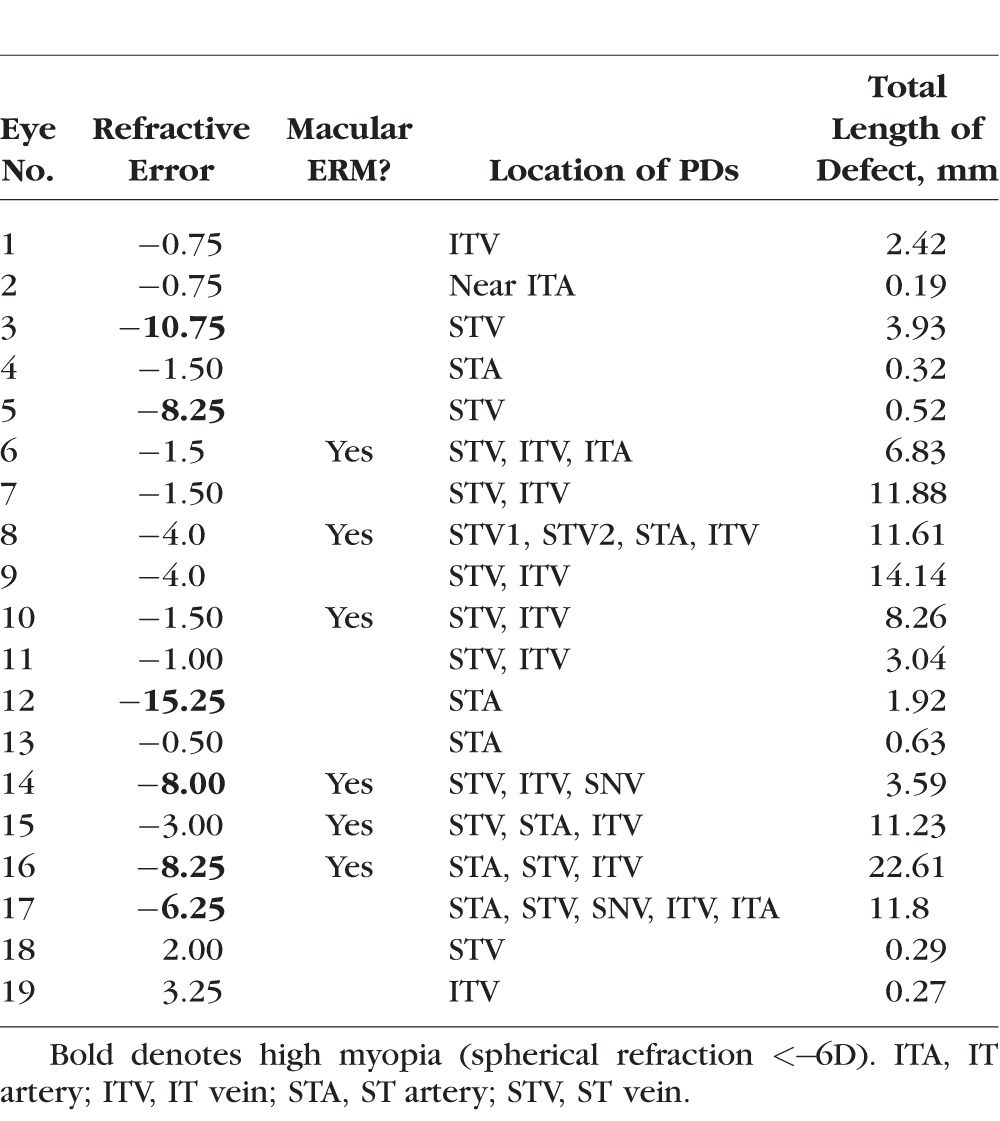
Table 3.
Refractive Error, ERM, and PD Information for Each Eye
The holes in all but one eye, eye 2, were adjacent to a BV. Figures 4C and 4D show images for eye 2. While the hole (yellow arrow) was near a major BV, it was not immediately adjacent. In any case, the length of the defect was measured and is shown as the small red line, and the location is indicated as “Near ITA” in Table 2. Interestingly, there is a clear arcuate defect in the same region as indicated by the white arrows in Figure 4C and evident as RNFL thinning in Figure 4D. Nine other eyes had arcuate defects identified on the en face slab images (column 3 in Table 2).
Length of the PDs
There was a total of 38 major BVs with PDs, of which 31 were associated with locations of holes observed in circumpapillary scans. Twenty-eight of the 38 BVs were veins and 10 were arteries. All but one was in the temporal region, with the largest number in the ST (22) region, followed by the IT (15) and SN (1) regions.
The total PD length within each eye was determined by summing the length of all the red lines in the en face slab images. For example, the total lengths in Figure 4 were 14.1 mm and 0.19 mm for eyes 9 and 2, respectively. The total PD lengths were rank ordered and are plotted as the large open circles in Figure 5. The total length ranged from 0.19 to 22.6 mm.
Figure 5.

Total PD lengths per eye ranked in increasing order. Colored symbols indicate the eyes with higher myopia (≤−5 D) (blue), ERM (green), and/or arcuate defect (red).
The colored symbols in Figure 5 indicate the eyes with higher myopia (≤−5 D) (blue) or ERM (green). Ten of the 19 eyes had either higher myopia or ERM, while 2 of these 10 had both. Further, 10 of the 19 eyes had at least one of the hole locations adjacent to, or within, an arcuate defect as illustrated for eye 2 in Figures 4C and 4D.
As indicated in Figure 5, the eyes with the less extensive total PDs are more likely to be associated with an arcuate RNFL defect, while those with the more extensive PDs are more likely to have ERMs. In fact, all of the six eyes (eyes 2, 4, 5, 13, 18, 19) with the shortest total length of PDs had only a single hole location on the circumpapillary B-scan, and this single hole location was within an arcuate defect. Eye 2 (Figs. 4C, 4D) and eye 5 (Figs. 6A, 6B) illustrate this finding for two of the six eyes. Only one of these six eyes had higher myopia (eye 5), and none of them had ERMs.
Figure 6.

Same as in Figure 4 for eyes 5 (A, B) and 14 (C, D). White arrows indicate the location of an arcuate defect (A) and ERM (C).
This does not mean, however, that hole locations with relatively short PDs cannot be found in eyes that also have relatively long PDs at other locations. While Figure 5 is useful for characterizing the degree of PD within an eye, it does not tell us the extent of the PD associated with an individual hole observed within the circumpapillary B-scan. In Figure 7, the length of the PD associated with each of the 28 hole locations is shown in rank order of length. Relatively short PDs can be found in eyes with higher myopia and ERM, as well as with arcuate RNFL defects. This is illustrated by the images from eye 14 in Figures 6C and 6D. This eye has both higher myopia (−8 D) and ERM (white arrow in Fig. 6C). There are three BV locations with PDs (SN, ST, IT). Two of these (ST and IT) are associated with a hole located within the circumpapillary B-scan. The IT location has a relatively short PD, while the ST location has a longer one. In general, however, the eyes with arcuate defects or higher myopia tend to be associated with the shorter PDs, while those with ERM tend to be associated with the longer PDs. (The vertical dashed line in Figure 7 is the median of the PD lengths.)
Figure 7.

PD length of BV associated with each of the 27 hole locations ranked in increasing order.
Discussion
Our purpose was to understand the relationship between, on one hand, the holes found in the circumapapillary region of the disc in glaucoma patients and suspects and, on the other hand, the PIRDs seen adjacent to BVs in eyes without optic nerve disease.2 To do this, we measured PDs in eyes with holes in the RNFL. Thus, before addressing the relationship between holes and PIRDs, we need to understand the relationship between the PDs we measured and the PIRDs defined by Muraoka et al.2
Relation of PDs to PIRDs
To make a diagnosis of a PIRD, Muraoka et al.2 first identified eyes suspected of PIRDs based upon the appearance of the BVs on red-free photos and then confirmed the PIRD with OCT B-scans. We also depended upon OCT B-scans to confirm what we called a PD. However, we identified regions with PDs based upon the appearance on en face images and the regions near a hole. Thus, while a subset of our PDs are almost certainly PIRDs, we suspect that some of the eyes would not be categorized as having PIRDs by Muraoka et al.2 For example, they would not have diagnosed the six eyes with the PDs < 1 mm and near the disc as PIRDs. The regions are too small to be seen on red-free photographs, and even if seen are too close to the optic disc to be a PIRD by their definition. It is likely that some of the other eyes with larger PDs would also be excluded, as we have found that even extensive PDs are easier to identify on en face slab images than they are on fundus photographs. This is illustrated in Figure 8, which shows the full-color (Fig. 8B) and red-free (Fig. 8C) fundus photographs for eye 9, along with the en face slab image from Figure 2. As expected, the en face slab analysis provided an excellent way to visualize local defects adjacent to BVs. In particular, PDs/PIRDs appear as dark regions because the highly reflective inner retinal layers are not present adjacent to the BVs.
Figure 8.

Full-color (B) and red-free (C) fundus photographs for eye 9, along with the en face slab image from Figure 2 (A).
To compare our results to those of Muraoka et al.,2 we excluded the 6 of the 19 eyes with the single short PDs, as these authors would not have called these PIRDs. First, Muraoka et al. reported that PIRDs were most common in the temporal quadrant along the ST and IT BVs, with more defects seen in the ST than the IT region. Our results for the PDs showed the same pattern of results. Second, Muraoka et al. reported that the PIRDs were more commonly found adjacent to a vein than to an artery. We found that the PDs were more than three times more likely to be adjacent to a vein than an artery. On the other hand, the occurrence of higher myopia and ERM was higher in their study (95%) than in ours, where 9 of 13 eyes (69%) had higher myopia and/or ERMs. This difference may be due to the presence of glaucomatous damage in our cohort and/or due to an ethnic population more likely to have high myopia in a cohort.
What Is Causing the Holes in Glaucoma Patients and Suspects?
It is likely that many of the holes we found in eyes with glaucoma are secondary to the ERM and/or myopia seen in these patients. Like PIRDs, they are associated with BVs, occur largely in the temporal half of the disc, and are more common in ST than IT regions. On the other hand, the results also argue for glaucomatous damage as a factor that can cause holes and PDs independently of ERM and/or myopia.
The clearest evidence for this comes from the six eyes with PDs restricted to a small local region near the hole seen in the circumpapillary B-scan. All six had arcuate damage in this region and only one had higher myopia, while none had ERM. In four of these eyes, there was only one arcuate RNFL defect present; a fifth eye had two arucate defects; and only one of the eyes had more than two such defects. Of course, it is possible that the holes and PDs seen in some of the other eyes are also associated with glaucomatous damage.
What is the mechanism responsible for the holes secondary to local glaucomatous damage? We had previously speculated that a local loss of axons might “create a local mechanical force that pulls axons away from the nearest vessel” (p. 7184).1 This is consistent with the hypothesis proposed by Muraoka et al.2 to explain the presence of PIRDs in eyes with ERM and/or high myopia. In particular, they suggested that BVs may be deviated due to traction caused by the formation of ERMs and to axial elongation due to higher myopia. Similarly, with the progression of glaucoma, the RNFL may be pulled away from the BVs. Consistent with this notion, Radcliffe et al.6 recently showed that retinal BVs shift locations in eyes with progressive neuroretinal rim loss due to glaucoma.
Conclusion and Clinical Implications
The presence of a hole on the circumpapillary B-scan does not necessarily mean the eye has glaucomatous damage. If there is no evidence of local arcuate damage on OCT and visual field (VF) tests, it is likely that the hole is unrelated to glaucomatous damage. Rather, it is probably associated with PDs/PIRDs due to myopia and/or an ERM. This can be easily confirmed by examining en face slab images. In general, as illustrated here, en face slab imaging is an excellent way to rule out abnormalities of the vitreal–retinal interface such as ERMs on the PDs.
Supplementary Material
Acknowledgments
Supported by National Institute of Health Grants EY-02115 (DCH) and EY- EY019327 (BF) and a grant from Jane Banks Research Fund of the New York Glaucoma Research Institute (RR).
Disclosure: D.C. Hood, Topcon, Inc. (F, C), Heidelberg Engineering (F); N. De Cuir, None; M.A. Mavrommatis, None; D. Xin, None; H. Muhammad, None; J. Reynaud, None; R. Ritch, None; B. Fortune, None
References
- 1. Xin D,, Talamini CL,, Raza AS,, et al. Hypodense regions (“holes”) in the retinal nerve fiber layer in frequency-domain OCT scans of glaucoma patients and suspects. Invest Ophthalmol Vis Sci. 2011; 52: 7180–7186. [DOI] [PMC free article] [PubMed] [Google Scholar]
- 2. Muraoka Y,, Tsujikawa A,, Hata M,, et al. Paravascular inner retinal defect associated with high myopia or epiretinal membrane. JAMA Ophthalmol. 2015; 133: 413–420. [DOI] [PubMed] [Google Scholar]
- 3. Hood DC,, Fortune B,, Mavrommatis MA,, et al. Details of glaucomatous damage are better seen on OCT en-face images than on OCT retinal nerve fiber layer thickness maps. Invest Ophthalmol Vis Sci. 2015; 56: 6208–6216. [DOI] [PMC free article] [PubMed] [Google Scholar]
- 4. Hwang YH,, Kim YY,, Kim HK,, Sohn YH. Effect of peripapillary retinoschisis on retinal nerve fibre layer thickness measurement in glaucomatous eyes. Br J Ophthalmol. 2014; 98: 669–674. [DOI] [PubMed] [Google Scholar]
- 5. Lee EJ,, Kim T-W,, Kim M,, Choi YJ. Peripapillary retinoschisis in glaucomatous eyes. PLoS One. 2014; 9: e90129. [DOI] [PMC free article] [PubMed] [Google Scholar]
- 6. Radcliffe NM,, Smith SD,, Syed ZA,, et al. Retinal blood vessel positional shifts and glaucoma progression. Ophthalmol. 2014; 121: 842–848. [DOI] [PubMed] [Google Scholar]
Associated Data
This section collects any data citations, data availability statements, or supplementary materials included in this article.