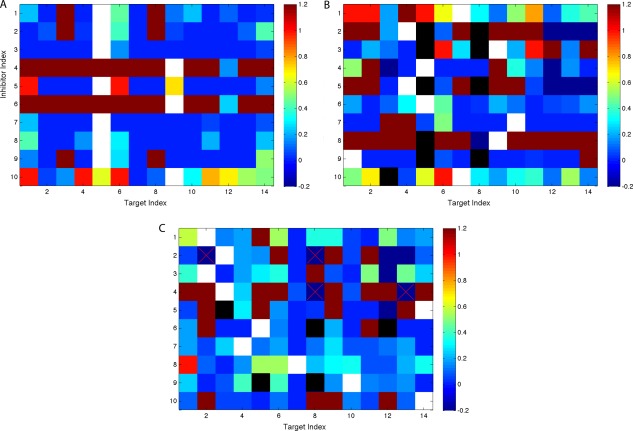
Figure 7.

Fraction of electrostatic contributions to relative binding affinity losses for randomly chosen, mono‐specific compounds that were extra small (A), extra large (B), and extra polar (C). Each block represents a pair of protein (on the x‐axis) and inhibitor (on the y‐axis). Warmer color represents more contribution from electrostatics. The deepest red color indicates that hydrogen‐bond groups on corresponding inhibitors could not be all satisfied. The black color indicates that corresponding compounds do not fit in the binding site geometrically. The white color indicates that the compound binds the corresponding target.
