

Abstract
The frequency of plant species introductions has increased in a highly connected world, modifying species distribution patterns to include areas outside their natural ranges. These introductions provide the opportunity to gain new insight into the importance of flowering phenology as a component of adaptation to a new environment. Three Coffea species, C. arabica, C. canephora (Robusta), and C. liberica, native to intertropical Africa have been introduced to New Caledonia. On this archipelago, a secondary contact zone has been characterized where these species coexist, persist, and hybridize spontaneously. We investigated the impact of environmental changes undergone by each species following its introduction in New Caledonia on flowering phenology and overcoming reproductive barriers between sister species. We developed species distribution models and compared both environmental envelopes and climatic niches between native and introduced hybrid zones. Flowering phenology was monitored in a population in the hybrid zone along with temperature and precipitation sequences recorded at a nearby weather station. The extent and nature of hybridization events were characterized using chloroplast and nuclear microsatellite markers. The three Coffea species encountered weak environmental suitability compared to their native ranges when introduced to New Caledonia, especially C. arabica and C. canephora. The niche of the New Caledonia hybrid zone was significantly different from all three species' native niches based on identity tests (I Similarity and D Schoener's Similarity Indexes). This area appeared to exhibit intermediate conditions between the native conditions of the three species for temperature‐related variables and divergent conditions for precipitation‐related ones. Flowering pattern in these Coffea species was shown to have a strong genetic component that determined the time between the triggering rain and anthesis (flower opening), specific to each species. However, a precipitation regime different from those in Africa was directly involved in generating partial flowering overlap between species and thus in allowing hybridization and interspecific gene flow. Interspecific hybrids accounted for 4% of the mature individuals in the sympatric population and occurred between each pair of species with various level of introgression. Adaptation to new environmental conditions following introduction of Coffea species to New Caledonia has resulted in a secondary contact between three related species, which would not have happened in their native ranges, leading to hybridization and gene flow.
Keywords: Adaptation, bioclimatic envelope, climate change, Coffea, flowering phenology, hybrid zone, introduction, New Caledonia, niche, precipitation
Introduction
Human activities, such as trade and cultivation, have increased the frequency of species introductions in a highly connected world, largely modifying species distribution patterns outside their native range and inducing significant range shifts (Parmesan 2006). Establishment of introduced species is usually modulated by both ecological and evolutionary processes depending on variations in biotic or abiotic conditions encountered in its new range. Among other phenomena, climate‐induced changes in life traits such as flowering phenology and new interactions with related species might promote interspecific hybridization.
Following the introduction of a species in a new territory, various scenarios may occur, ranging from extinction (Cooper et al. 1992) to adaptation and invasion (Broennimann et al. 2007). Comparing environmental conditions between native and new habitats could help to gain further insight into the dynamics following species displacements and to understand the fate of a species introduced in a new environment. Thus, the development of models characterizing the niche is a valuable tool for understanding and predicting how a species will be impacted by changing environmental conditions (Guisan and Thuiller 2005). There are two generally conflicting concepts regarding spatiotemporal species niche dynamics, that is, niche conservatism versus niche shift (Pearman et al. 2008). Although it has been suggested that climatic niche shifts are rare among plant invaders (Petitpierre et al. 2012), examples of niche shifts have mostly been demonstrated following the introduction of a species into a new environment (e.g., Broennimann et al. 2007; Mandle et al. 2010; Cornuault et al. 2015). Niche shift prevalence in some cases of introduction might explain situations of secondary contact between sister species (Benkman et al. 2008). But niche shift could also lead to divergence in physiological and life‐history traits (Allan and Pannell 2009).
One of the outcomes of the introduction of a species is a new ecological interaction with other species, both native and introduced (Abbott et al. 2003). Secondary contact between closely related species via translocation is especially prone to favor hybridization in plants and animals (Blair and Hufbauer 2010; Steeves et al. 2010). In plants, such translocation may quickly lead – in the absence of strong reproductive barriers – to hybridization and introgression with related native taxa, such as between species of Ulmus (Zalapa et al. 2010). According to Allendorf et al. (2001), there are three general patterns in hybridization between introduced and native species: (1) hybridization without introgression; (2) widespread introgression into the native species genome; and (3) complete admixture. To end up with complete admixture, the different phases of the process play over time and necessitate the adaptation and fertility of hybrids and advanced hybrids as gene exchange increases. Thus, the outcome of hybridization is highly diverse and depends on both the introduced species, other species involved in the hybridization and local environmental conditions.
The majority of studies on hybridization have been conducted on hybrids derived from crosses between an introduced and a native species. However, multiple related species may also be introduced to the same new environment, and hybridization between two introduced taxa may not be less uncommon than imagined. For example, Abbott (1992) calculated that of the 1264 nonnative plant taxa present in the British Isles in 1991, 21 (1.7%) were derived from hybridization between two introduced taxa. A rare documented example concerns radish (Raphanus raphanistrum and R. sativus) in which two nonnatives hybridized to form hybrid lineages with increased fitness (Campbell et al. 2006).
Moreover, few studies have considered secondary contacts between two related introduced species whose native ranges are geographically distinct (Cornuault et al. 2015). New secondary contact situations between sister species, whose flowering phenology evolved under different native climatic regimes, might alter reproductive isolation between them (Allendorf et al. 2001). Distinct flowering phenology among related species is an important prezygotic reproductive barrier maintaining species isolation by reducing cross‐pollination and gene flow. Under new climatic conditions, introduced species may display changes in flowering phenology (Cleland et al. 2007; Anderson et al. 2012), and altered differences in flowering phenologies could lead to hybridization (Lamont et al. 2003). Flowering time is a complex trait that is partially dependent on environmental factors (Petit et al. 1997), such as photoperiod (Imaizumi and Kay 2006), day length (Borchert et al. 2004), precipitation (Cowling et al. 2005), and temperature (Bustamante and Burquez 2008). These external signals influence a regulatory network so as to prevent a plant from flowering too early or too late in the season. The timing of the switch between vegetative and reproductive phases is crucial for efficient pollination and seed set for individuals and populations, so it is an important trait in plants and highly relevant for adaptation to climate change (Wolkovich et al. 2013). Evolution of locally adapted flowering times may occur over a relatively short period of time in plant species following introduction (Colautti and Barrett 2013). For example, in Brassica rapa, flowering phenology was shown to evolve rapidly in response to a multiyear drought (Franks et al. 2007). Thus, habitat‐induced flowering‐time shifts might promote new mating patterns and facilitate the evolution of local adaptation.
Coffee tree cultivation has a long history of introductions within multiple ecological contexts across the intertropical zone. Of the 125 Coffea species currently recognized (Davis et al. 2011), three are cultivated: C. arabica, C. canephora (Robusta) and, to a lesser extent, C. liberica, native to intertropical Africa. The characteristics and distributions of these three species are extremely diverse in terms of phenotypic and phenologic traits and niche occupation (Chevalier 1946; Davis et al. 2006). In particular, these species are seldom found sympatrically in African tropical forests, and the absence of flowering overlap, among other prezygotic barriers, is thought to generally prevent interspecific hybridization (Le Pierrès 1995). Only a few occurrences of spontaneous hybrids have been observed when these species are cultivated together, for example, the Timor hybrid on Timor Island (Cramer 1957; Bettencourt 1973) and in New Caledonia (Gomez et al. 2010a). Experimental hybridization between Coffea species has been reported and has produced relatively fertile hybrids, indicating the lack of complete postzygotic isolation barriers (Louarn 1992) and suggesting that prezygotic isolation, such as nonoverlapping flowering time, is important to maintain the integrity of species. Coffee tree flowering phenology is greatly controlled by climatic factors. The effects of light, soil moisture, and temperature on flowering success have been demonstrated in coffee agroforestry systems (Lin 2008). More specifically, coffee tree flowering generally occurs after a dry period releasing floral buds from dormancy, and the onset of occasional rains then triggers flowering and anthesis (Crisosto et al. 1992; Dinnan and Menzel 1994). The time between the triggering rain and flowering differs markedly between species and acts as the main reproductive barrier to gene flow in coffee species.
A unique situation has been characterized in the Sarraméa region of New Caledonia where three introduced coffee species were formerly cultivated. They presently coexist and hybridize spontaneously within abandoned plantations evolving only under the pressure of local environmental conditions (Gomez et al. 2010a,b). This situation of a secondary contact zone of introduced species with different evolutionary histories was investigated to understand the impact of environmental changes undergone by each species following its introduction in New Caledonia. We hypothesize that the changes in flowering phenology could have overcome the reproductive barriers between sister species.
The objectives of our study were to (1) investigate environmental changes undergone by each species following its introduction to New Caledonia through the comparison of both environmental envelopes and climatic niches between native and introduced hybrid zones; (2) evaluate the impact of climatic parameters on flowering phenology of sister species by monitoring the weather and their flowering patterns in the population of Sarraméa; and (3) evaluate the impact of flowering phenology on mating patterns in the three‐species population by genetic characterization of the extent and nature of hybridization events.
Methods
Study area and field sampling
Cultivated Coffea species, that is, C. arabica, C. canephora (Robusta), and to a lesser extent C. liberica, have been introduced from Africa into New Caledonia to support the local economy. First introduced in 1856 from La Réunion Island by Marist priests, coffee was widely cultivated during the colonial period, particularly by French “Feillet” colonists who settled in New Caledonia between 1894 and 1903. Native Melanesian tribes were also urged to cultivate coffee trees as a way for their communities to become integrated in a commercial economy (1931‐34) (Kohler and Pillon 1986; Leblic 2007). However, two pest introductions, that is, the coffee rust fungus (Hemileia vastatrix) in 1910 and the coffee berry borer (Hypothenemus hampei) in 1948, in addition to economic constraints, such as higher costs of labor, led to the decline of coffee cultivation. In particular, coffee plantations in the Sarraméa region were probably abandoned in the 1930s by the colonists' descendants. Trees from these plantations, previously managed in a “rustic coffee system” and then abandoned, have survived and hybridized for more than half a century without human intervention, leading to an unique hybrid zone (see Figure S1 in Supporting Information; Gomez et al. 2010a,b). Coffea liberica consists of two well‐differentiated subspecies, C. liberica ssp. liberica Hiern. and C. liberica ssp. dewevrei De Wild. and Dur. (N’ Diaye et al. 2005), but only C. liberica ssp. liberica has been introduced in Sarraméa (denoted hereafter as C. liberica) (Gomez et al. 2010a).
The reference three‐species (C. arabica, C. canephora, and C. liberica) population of Sarraméa (21°38.584′S, 165°51.733′E) was the focus of our genetic study. In this population, the circumference of individual trees was measured at 1 m height so as to reflect individual age, and only the 387 mature (i.e., flowering) individuals were genotyped, including some of the oldest trees (referred to as founders) and putative hybrids (assumed to be so on the basis of their morphological features). To ensure correct species assignments, we identified a representative subsample of specimens per species: two of C. arabica, 34 of C. canephora (representative of the diversity subgroups) (Gomez et al. 2009), and eight of C. liberica ssp. liberica (N’ Diaye et al. 2007). Both C. liberica and C. canephora are diploid species (2x = 2n = 22), while C. arabica is the only Coffea tetraploid species (allotetraploid; 2n = 4× = 44).
In this population, a subsample of 10 individuals of each species was also selected for monitoring flowering phenology.
Genetic analyses
Nuclear genetic variation was assessed at twelve microsatellite loci (M259, Es18, Es62, Es70, Es82, Es90, M314, M387, M394, M495, M764, and M809). They were selected for being evenly distributed throughout the Coffea genome (Denoeud et al. 2014) and showing good amplification and high polymorphism information content (PIC) according to Poncet et al. (2006, 2007). PCR conditions and all information on the markers are given in MoccaDB (http://moccadb.mpl.ird.fr; Plechakova et al. 2009) and in the coffee genome hub (Dereeper et al. 2015).
Two chloroplastic microsatellite (cpSSRs) loci, with species‐specific alleles, were designed based on sequences published by Tesfaye et al. (2007). The first cpSSR, MS2 (alleles 225, 227, and 229 bp for C. arabica, C. canephora, and C. liberica, respectively), is located in the trnS‐trnG intergenic spacer and was amplified with the following primers: F:GCAAGGGGGTCTTCTTTAGTTT, R:GTCCACTCAGCCATCTCTCC. The second cpSSR, MS4 (alleles 180 and 182 bp for C. liberica/C. arabica and C. canephora, respectively), is located in the trnG intron. The sequences of primers used for amplification were as follows: F:TGGAAGGCTAGGGGTTATAG and R:TTCAGACAAAAGCTGACATAGA. Amplifications were carried out with a 60–55°C touchdown protocol according to Poncet et al. (2006). Maternal inheritance of chloroplastic DNA in Coffea (Lashermes et al. 1996) was confirmed on progenies (data not provided) and enabled us to monitor the crossing direction.
For both nuclear and chloroplastic microsatellites, amplified fragments were separated by capillary electrophoresis on an ABI 3130 Genetic Analyzer (Applied Biosystems, Waltham, MA), and fragment sizes were assessed using genemapper version 3.21 (Applied Biosystems) according to a size standard GS‐500 LIZ (Applied Biosystems). Automated allele calling was visually checked for each sample by two independent scorings (two persons). We finally retained 367 Sarraméa samples with good amplification and consistent amplification profiles. As C. arabica is an allotetraploid species that contains a considerable amount of fixed heterozygosity with maximum two alleles at each studied microsatellite, all samples including reference samples were coded as diploid.
Genetic polymorphism, including the observed number of alleles (Na), observed heterozygosity (H O), and expected heterozygosity (H E, or gene diversity), was assessed for each nuclear marker locus within the Sarraméa population using powermarker v3.25 software (Liu and Muse 2005). Principle coordinate analysis (PCA) was conducted using GenAlEx 6.5 (Peakall and Smouse 2012) based on the genetic distance (GD) estimated between individuals.
We analyzed the genetic relationship among Sarraméa individuals and hybrid detection using Structure v2.2.3 (Pritchard et al. 2000; Falush et al. 2003). This program performs comparably to other hybrid detection methods when used in a two‐species system (Burgarella et al. 2009), but it is the only software that allows assessing hybridization among three or more species. The most likely number of genetic clusters was estimated both with and without the African referent species, based on methods described in Evanno et al. (2005). Admixture degrees were estimated directly on the Sarraméa sample. Default settings were as follows: admixture model and allele frequencies correlated, 30,000 burn‐in steps, and 1,000,000 MCMC replicates. We assigned each individual to the inferred clusters using a threshold q i > 0.80. In cases of admixed individuals, genotypes were considered as hybrids when the proportion of membership to each assigned group was 0.20 < q i < 0.85. A 90% confidence interval of the q i parameter was calculated for each individual.
Niche analyses
The niche specificity of each species, both in native and in introduced contexts, was assessed based on niche models.
Data sources
Native range occurrence points for Coffea arabica (n = 42), C. canephora (n = 54), and C. liberica ssp. liberica (n = 12) were compiled from records of field collections in Africa (Meyer 1968; Berthaud and Guillaumet 1978; Berthaud et al. 1983; Anthony et al. 1985; Berthaud 1986; de Namur et al. 1987; Le Pierrès et al. 1989; Musoli et al. 2009).
The introduced hybrid zone is located in Sarraméa Valley, in the central part of the New Caledonian mountain range (Gomez et al. 2010a,b). We selected within this area 71 sites including two (without C. liberica) or three species, in order to characterize environmental conditions in the “introduced hybrid range” (Gomez et al. 2010b).
Environmental variables
Twenty environmental variables were considered as predictors in the three species distribution models: elevation and 19 bioclimatic variables described as biologically meaningful to define ecophysiological tolerances (Graham and Hijmans 2006). These variables were downloaded for the current conditions (years 1950 to 2000) from the WorldClim database (www.worldclim.org) at 30 arc‐second resolution (Hijmans et al. 2005) and resampled at 10 km resolution over intertropical Africa and New Caledonia. The absence of spatial correlation between variables was checked using ENMTools (Warren et al. 2010).
Models
The potential distribution (realized niche) of each of the three African species was modeled using maxent 3.3.3k software (Phillips et al. 2006). Based on a maximum entropy criterion, maxent combines presence‐only data and environmental layers to generate the distributions. Compared with other presence‐only models maxent shows good predictive accuracy (Elith et al. 2006) while not being sensitive to sample size effects (Wisz et al. 2008). We used the default maxent settings with a random test set of 25% of the input localities. We chose the “raw” output format for following comparison tests, as suggested by Warren et al. (2008). Jackknifing was performed to measure the variable importance, and model validation was conducted by calculating the receiver operating characteristic (ROC) and the area under the curve (AUC) (Phillips et al. 2006). We defined a 1000‐km buffer zone around all African and New Caledonian occurrence points, whatever the species, to obtain spatially comparable ecological niche models between species. This area encompassed relevant regions that have likely been accessible to the three species over their evolutionary history.
Ecological niche modeling was also implemented to characterize the introduced hybrid zone in New Caledonia based on hybrid population occurrence points.
Comparing the niches of native and introduced populations
The native distributions of the three African species were compared to each other and to that of the introduced hybrid zone in New Caledonia. Pairwise ecological niche overlap was quantified using Schoener's D (Schoener 1968) and the I statistic modified from the Hellinger distance (Warren et al. 2008). Both statistics vary between 0 and 1, with 0 indicating no niche overlap and 1 indicating identical niches. Differences were statistically tested in ENMTools (Warren et al. 2010). Background tests in ENMTools were also applied to assess whether the niches of two species are more or less similar based on differences in the environmental range (Warren et al. 2010). These tests were conducted by comparing the predicted niche of a focal species/hybrid zone with a set of pseudoniches modeled based on random sampling of the other species/hybrid zone geographic range according to Nakazato et al. (2010). We established an a priori definition of the range of each species (defining the background) as any grid cell within 50 km of known occurrences.
Comparing environmental envelopes between native and introduced ranges
Principal component analysis (PCA) was performed on the environmental conditions at occurrence points to compare the environmental envelope of the three African species in their native range using the “ade4” library in R software (Chessel et al. 2004). To visualize differences between the native and introduced hybrid range in New Caledonia, we included the New Caledonian occurrence points as additional passive elements within the previously implemented PCA.
Flowering phenologies
We used several indices characterizing the patterns in flowering phenology, including frequency, duration, amplitude, synchrony, and regularity.
Flowering phenology was monitored on 11 individuals of Coffea liberica, 10 of C. canephora, and 10 of C. arabica of the Sarraméa population. Because of the heterogeneity of the hybrid types, involving each pair of species with various level of introgression (see below), not enough individual of each class could be monitored to infer trends with confidence. The individuals selected were randomly distributed in the population and representative of the size diversity sampled for each species. Observations were recorded during the 2008 flowering season from September to December. Several blossoming events may occur during a flowering season, which usually starts at the beginning of a rainy season (i.e., in September). Five events with different intensities were observed during the season.
An annotation grid was constructed according to the literature (Arcila‐Pulgarin et al. 2002) and known phenologies in Africa (Le Pierrès 1995), defining seven distinct stages of coffee bud development along a flowering event, as follows: stage 1 = green cluster, 2 = white cluster, 3 = first white candle, 4 = anthesis, 5 = end of pollen viability, 6 = end of style receptivity, 7 = pinhead fruits (Fig. 1).
Figure 1.
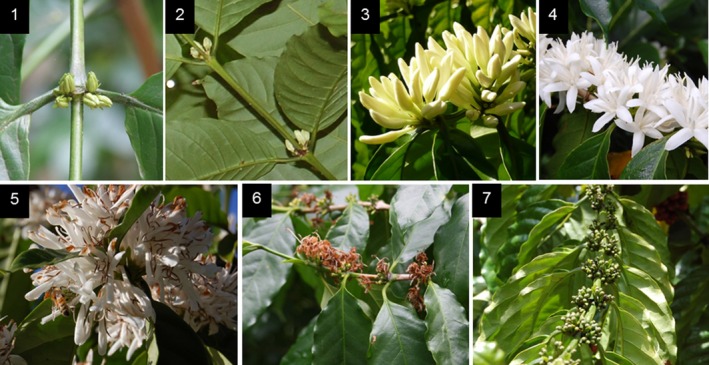
Flowering stages in coffee species. The seven distinct stages of coffee bud development along a flowering event were annotated as follows from bud initialization to fruit initialization: stage 1 = green cluster, 2 = white cluster, 3 = first white candle, 4 = anthesis, 5 = end of pollen viability, 6 = end of style receptivity, 7 = pinhead fruits.
Stage 4, which corresponds to male and female fertile stage, lasts only 1 day. Stage 5 is a female‐only fertile stage during which the style is still receptive but pollen is no longer viable. Observations were made daily during the blooming peaks (from stage 2 to stage 6) and weekly otherwise. Scoring was performed by consensus by two people. In order to maximize homogeneity, pictures of every observation were taken, allowing double‐checking and cross‐validation.
Flowering intensity classes were defined according to the number of flowers at anthesis (stage 4) observed on each tree: from 1 (only 1 to 3 flowers on the tree) to 4 (all branches blooming on the tree).
Under natural conditions, flower bud dormancy in Coffea is often broken by the first rains in the season following a dry period, sometimes associated with cool temperatures (DaMatta et al. 2007). To record temperature and precipitation sequences during the flowering season, a weather station (Davis Vantage Pro2, Davis Instruments, CIMA TECHNOLOGIE, Montanay, France) was installed next to the Sarraméa population.
Results
Genetic analysis
Admixture analyses of the Sarraméa population
Analysis of the 367 Sarraméa individuals revealed a total of 90 alleles for the 12 loci, giving an average of 7.5 alleles per locus, ranging from 3 to 11. The observed heterozygosity (H O) and gene diversity (H E) were also high, with an average of 0.48 and 0.70, respectively.
The analysis with STRUCTURE showed that three groups (K = 3) were genetically distinct based on SSR data (Fig. 2), both with and without African referent species. Individuals of each reference species, C. canephora, C. arabica, and C. liberica, clustered in one of the groups allowing the assignation of the Sarraméa individuals to each of the species. These distributions were congruent with principal coordinate analyses (see Figure S2). The admixture analysis was conducted using K = 3 on the Sarraméa individuals only. Three hundred and fifty‐two individuals were assigned to a species based on admixture coefficients above 0.85, while the remaining 15 (4%) were admixed among two species. Of the 352 individuals assigned to a “pure” species, 171 (48.6%) were C. canephora, 99 (28.1%) were C. arabica, and 82 (23.3%) were C. liberica (Fig. 2). Over the hybrid individuals, 12 were identified as admixed with over 0.20% ancestry from a second species, and the three other individuals with 15‐20%. These interspecific hybrids were represented with intermediate positions on the trispecific plot (Fig. 2). Admixture events occurred between each pair of species but, surprisingly, no F1 hybrid (an individual in which approximately half of the genome is from one species and half from another) was observed. Some individuals probably corresponded to a backcross hybrid of first generation (BC1), that is, having admixture values of 75% for one species and 25% for another, while others showed an advanced introgression level. The largest interspecific hybrid group was C. liberica × C. canephora, with seven individuals, compared to four C. canephora × C. arabica hybrids, and four C. liberica × C. arabica hybrids. The lack of detected F1 hybrids could be due to the fact that they might belong to the set of individuals that could not be properly amplified/genotyped, or that they were uprooted or cut when the plantation was still being managed, as noted by the many old coppiced C. arabica trees with double trunks.
Figure 2.
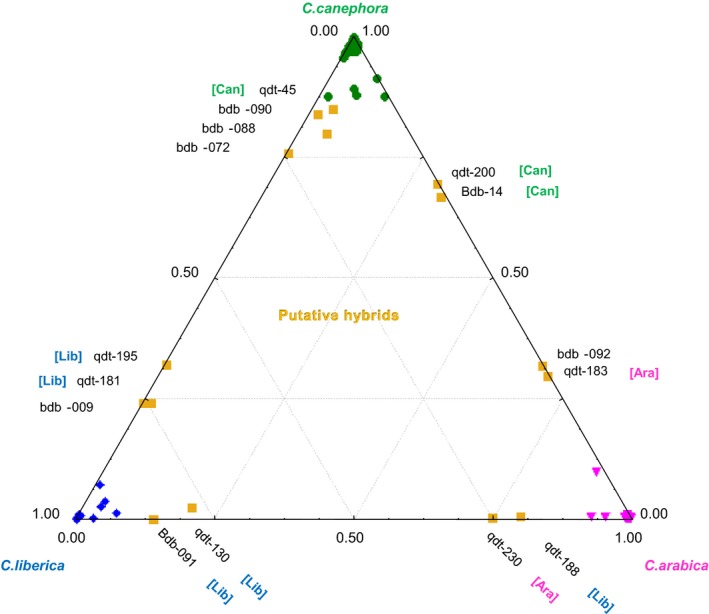
Genetic admixture analysis of the Sarraméa population (New Caledonia). Ternary plot of individual ancestry computed on the Sarraméa population (367 individuals) by structure with K = 3 and 12 microsatellite loci. Sample plotting at the apices have a proportion of membership close to qi = 1.0, that is, to pure species: Coffea canephora (green points), C. liberica (blue lozenges), and C. arabica (pink triangles). Hybrids and admixed individuals with at least 15% membership to a second species (yellow squares) are labeled with individual names and mother species chloroplastic origins are in brackets (C. canephora: [Can]; C. liberica: [Lib]; and C. arabica: [Ara]).
Genotypes at the chloroplastic microsatellite loci (cpSSR) allowed us to determine the last cross direction. Backcrosses of second generation toward a specific species had the cpDNA of this species (figures between brackets in Fig. 2) in nine of 10 cases. This was higher than the expected frequency of 75%, and might indicate that the backcrosses were asymmetric, with F1 hybrids more frequently acting as fathers in backcrosses, independently of the female species.
Influence on rainfall on the release, timing, and synchronization of anthesis
Flowering phenology was surveyed on 10 individual plants of each species within the Sarraméa population, while temperature and precipitation sequences were recorded from a nearby weather station. The general time sequence of flowering events over the study flowering season is presented in Figure 3.
Figure 3.
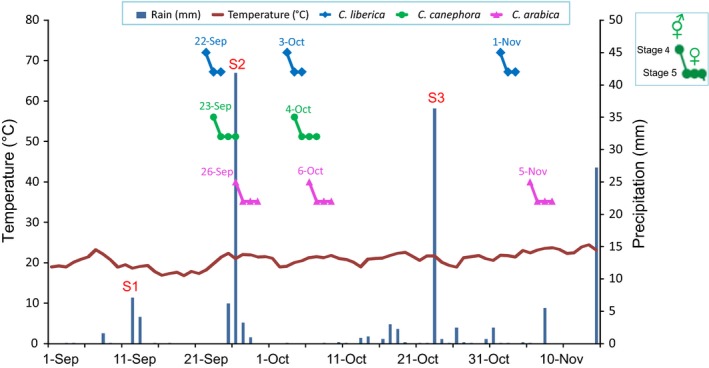
Time sequence of flowering patterns of the three Coffea species over a flowering season in Sarraméa. Flowering of Coffea canephora, C. liberica and C. arabica following rains during the blooming season at Sarraméa. Rainfall dates are indicated in S1–S3. Flowering stages 4 (anthesis, effective pollen and receptive style) and 5 (receptive style) are represented for the three flowering periods as validated on c. 10 individuals per species. Temperature and precipitation sequences were recorded by a nearby weather station (Davis Vantage Pro2, Davis Instruments).
Species flowering events
Coffee floral buds in many environments usually develop for about 2 months after initiation and then become dormant for weeks or months. Anthesis is generally associated with a cycle of drought followed by rainfall (Schuch et al. 1992). During the studied year in Sarraméa, two major flowering events were recorded for Coffea canephora (23 September and 4 October), while three were recorded for C. arabica (26 September, 6 October, 5 November) and C. liberica (22 September, 3 October, and 1 November). Two supplementary events of low intensity were recorded for the latter.
Although each species underwent several successive flowerings during the season, their most intense bloomings were not at the same periods. The first flowering period was the main blossom for C. canephora (flowering pick), while the main blossom was at the second period and third one for C. arabica and C. liberica, respectively (see Figure S3).
Rain‐triggered flowering over the season
Each of the flowering events occurred after a substantial rain (over 10 mm in a single day) following a dry period (under 0.6 mm on average per day over a period of over 11 days) (Fig. 3, see Table S1). Temperature was relatively stable over the flowering season, with an average of 20.8°C. After breaking of dormancy, the triggering rain stimulated development of the flower buds to anthesis (stage 4) within 7 to 14 days, depending on the species. After each precipitation event, the three species flowered in the same order regardless of the date: C. liberica flowered first (7–10 days after rain), followed by C. canephora, 1 day later (8–11 days after rain), and then C. arabica, 3–4 days later (10–14 days after rain).
Overlapping flowering sequences
The three species had particularly brief and well‐synchronized flowering, whatever the date. All individuals of a species we observed flowered synchronously with stage 4 lasting a single day (anthesis, male and female fertile stage). On average over the study season, stage 5 (receptive style) lasted 2 days for Coffea canephora, 2.5 days for C. liberica, and 3 days for C. arabica.
Because of the brief flowering and the distinct flowering dates between species, only partial overlapping within a sequence was observed. Stage 4 (anthesis with both sexes fertile) never coincided between species, but stage 5 (receptive style) of one species may have overlapped with stage 4 of the following species. Likewise, when two flowering periods were close enough due to close triggering rains, flowering stage 5 of the last species (C. arabica) could have overlapped with stage 4 of the first species of next sequence (C. liberica). Interspecific pollen flow would thus be oriented according to the species flowering sequence, with a majority of hybrids showing one of the three interspecific combinations: C. liberica (♀) × C. canephora (♂), C. canephora (♀) × C. arabica (♂), and C. arabica (♀) × C. liberica (♂).
The presence of interspecific hybrids was indeed detected between each pair of species using both nuclear and chloroplastic markers but, because of the absence of identified F1 individuals in the population, we were not able to confirm the interspecific crossing direction.
Niche comparisons
Environmental niche models (Phillips et al. 2006) were used to describe each species’ environmental requirements in their native ranges with the aim to assess environmental suitability for the species across their introduced zone in New Caledonia (Phillips et al. 2006).
Prediction and comparison of African native niches and environmental envelopes
Consistent with field observations and habitat descriptions of the species, we found substantial variation among the three Coffea species in terms of environmental requirement and predicted niche distribution (see Figure S4(A)). The C. liberica potential ecological niche was mostly located on coasts (mainly around the Gulf of Guinea), and the C. canephora putative ecological niche ranges from Guinea to Uganda, while that of C. arabica was mostly limited to East African highlands. Validation values were high for all models, with an AUC value of 0.99, 0.93, and 0.95 for C. liberica, C. canephora, and C. arabica models, respectively.
Randomization tests of niche identity confirmed that the members of each species pair were not ecologically equivalent (P < 0.01), regardless of the measure of similarity used (Schoener's D or I, Table 1). Although these differences could reflect evolutionary divergence of the species analyzed, they also might simply reflect the fact that populations of these species were exposed to different environmental backgrounds (see Figure S5). This hypothesis was however rejected by most of the background tests (Table 1), except for C. liberica and C. canephora, for which a small overlap was detected.
Table 1.
Niche overlap among African native niches and the hybrid introduced zone in New Caledonia. Pairwise ecological niche overlap was quantified using Schoener's D and I statistics. Both statistics vary between 0 and 1, with 0 indicating no niche overlap and 1 indicating identical niches. The background test results are given for a species according to the background of the other species
| Compared niches | Niche overlap index | Niche/Background | Background test | ||
|---|---|---|---|---|---|
| I | D | I | D | ||
| Native in Africa | |||||
| Can/Lib | 0.62* | 0.35 | Can/Lib | 0.87 ± 0.022 | 0.62 ± 0.04 |
| 0.79 ± 0.06* | 0.52 ± 0.014* | Lib/Can | 0.46 ± 0.09 | 0.24 ± 0.06 | |
| Can/Ara | 0.37* | 0.14* | Can/Ara | 0.87 ± 0.0022* | 0.62 ± 0.039* |
| 0.90 ± 0.027* | 0.66 ± 0.05* | Ara/Can | 0.8 ± 0.03* | 0.58 ± 0.041* | |
| Lib/Ara | 0.18* | 0.06* | Lib/Ara | 0.46 ± 0.0092* | 0.25 ± 0.06* |
| 0.71 ± 0.04* | 0.42 ± 0.04* | Ara/Lib | 0.79 ± 0.031 | 0.58 ± 0.041* | |
| Native/hybrid zone in NC | |||||
| Can/NC | 0.07* | 0.009* | Can/NC | 0.91 ± 0.016* | 0.72 ± 0.033* |
| 0.89 ± 0.32* | 0.66 ± 0.054* | NC/Can | 0.30 ± 0.016* | 0.11 ± 0.01* | |
| Lib/NC | 0.14* | 0.03* | Lib/NC | 0.41 ± 0.19 | 0.21 ± 0.11 |
| 0.64 ± 0.17* | 0.38 ± 0.14* | NC/Lib | 0.3 ± 0.16* | 0.11 ± 0.16* | |
| Ara/NC | 0.016* | 0.0028* | Ara/NC | 0.8 ± 0.062* | 0.56 ± 0.097* |
| 0.87 ± 0.07* | 0.62 ± 0.11* | NC/Ara | 0.30 ± 0.016* | 0.11 ± 0.01 | |
If marked with an asterisk *, the true calculated niche overlaps are outside the 95% confidence intervals and are therefore significant. Ara, Can, and Lib: native niches of Coffea arabica, C. canephora, and C. liberica, respectively; NC: hybrid zone niche in New Caledonia.
The PCA based on environmental parameters also suggested the proximity of C. canephora and C. liberica ecological niches by overlapping their environmental envelopes and differentiating both of them from C. arabica along PCA1 (Fig. 4). Altitude and temperature‐related variables (e.g., Bio2, Bio10, Bio1, or Bio11) contributed mainly to this axis.
Figure 4.
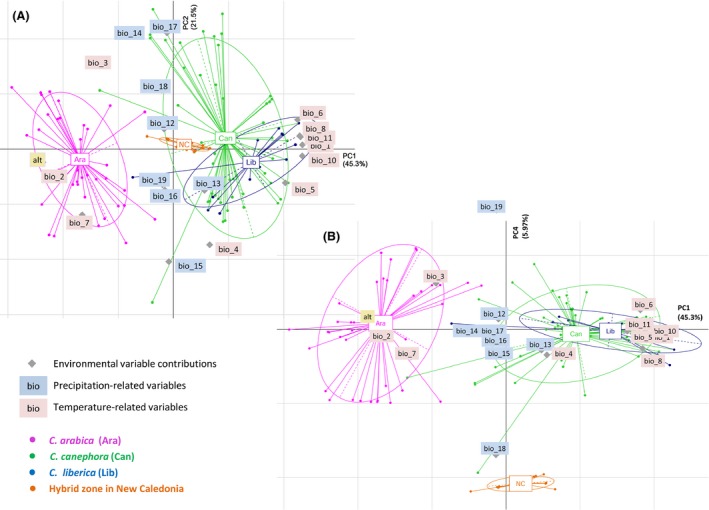
Principal component analysis (PCA) of the 19 bioclimatic variables and altitude in native and introduced (New Caledonia) records of Coffea canephora, C. liberica, and C. arabica occurrence. Distribution of the three species in the bioclimatic PCA space: (A) the X‐axis and Y‐axis show the first and the second principal components, accounting for 45.3% and 21.25% of the total variation, respectively (B) the X‐axis and Y‐axis show the first and the fourth principal components, accounting for 45.3% and 5.9% of the total variation, respectively. Native occurrence localities in Africa were treated as active variables while New Caledonian localities were treated as passive. Environmental variable contributions to both axes are represented on the same graph, while temperature‐related and precipitation‐related variables are shown in blue and pink, respectively. Ellipses representing environmental envelopes were automatically drawn.
How suitable is the hybrid zone for the introduced species?
Niche projection for the three species over the introduced hybrid zone in New Caledonia revealed weak suitability of the environment for all species, although slightly better for Coffea liberica (see Figure S4(B)). The New Caledonia niche was significantly different from all three species’ native niches based on identity tests (Table 1). However, while no background effect was detected for C. canephora and C. arabica in the background tests, environmental differences weakly explained the ecological niche differences when the niche of C. liberica was considered in a New Caledonian background.
The passive projection of New Caledonian environmental conditions into the PCA based on environmental parameters (Fig. 4) revealed intermediary conditions between C. canephora–C. liberica and C. arabica on PCA1, determined mainly by the contribution of altitude and temperature‐related variables (e.g., Bio2, Bio10, Bio1, or Bio11). While PCA2 and PCA3 did not differentiate New Caledonia from the three native range conditions, a clear shift was illustrated along the PCA4 (Fig. 4). The main variables contributing to this axis were specific precipitation‐related variables, with in particular a higher level of precipitation in New Caledonia during the warmest quarter and a lower level during the coldest one (Bio18 and Bio19).
The niche in the introduced hybrid zone in New Caledonia appeared to provide intermediate conditions between the three species’ native conditions for temperature‐related variables and divergent conditions for precipitation‐related ones.
Discussion
Environmental shift mainly due to precipitation
Discrepancies noted when comparing the modeled range distributions of Coffea arabica, C. canephora, and C. liberica ssp. liberica in Africa suggested that major evolutionary and/or ecological processes have shaped the native niches of the three related species since their speciation (Yu et al. 2011). While C. arabica has a current natural distribution restricted to East African highland forests (Ethiopia, South Sudan, and Kenya), C. liberica ssp. liberica naturally grows in the lowland Congolese region (Côte d'Ivoire, Liberia) of West Africa and C. canephora has the widest distribution area, ranging from the Republic of Guinea to Uganda and from Cameroon to Angola, adapted to various forest types (Berthaud 1986; Davis et al. 2006). The three species are generally geographically and/or ecologically isolated from one another. Indeed, according to the results of our comparative distribution modeling, their realized ecological niches in Africa are differentiated, although this is less pronounced between C. canephora and C. liberica ssp. liberica. This is probably resulting from their partial natural coexistence in West Africa and their phylogenetic proximity (Maurin et al. 2007; Noirot et al. 2015), while a combination of current exposure to different environmental conditions and ongoing evolutionary niche diversification might explain part of their niche divergence.
The three Coffea species studied here were introduced in New Caledonia decades ago and encountered weak environmental suitability compared to their native ranges, especially C. arabica and C. canephora, but were nevertheless able to establish sympatrically in the Sarraméa region. In fact, microenvironments in the Sarraméa area have been also found to be favorable for the coexistence and hybridization of Coffea species (Gomez et al. 2010a,b). The present results suggest that species coexistence might be explained by an intermediate niche, mostly due to temperature‐related variables in Sarraméa that are intermediate as compared to the native conditions. On the contrary, a well‐marked niche shift in precipitation‐related variables likely impacted flowering phenologies and consequently weakened interspecific reproductive barrier.
Flowering phenology tracks environmental conditions
Under different conditions from those experienced in the native range, selective processes can take place. The level of introduced genetic diversity and of phenotypic plasticity (Maron et al. 2004) would determine species adaptative abilities. Some species can evolve even over a short period by acclimatization, including shifts in gene expression, resource allocation, or morphology and physiology within the lifespan of an individual, especially for species that tend to be phenotypically plastic (Strayer et al. 2006). Flowering patterns over the year for the three Coffea species studied were shown to directly follow the timing and sequence of precipitation, tracing local climatic variations in Sarraméa, similar to what has been described in Africa (Le Pierrès 1995). The use of climatic cues to flower at a suitable time is critical to take advantage of environmental conditions that favor the production of fruits and seeds. It has been suggested that species that change their phenology in response to climate change are better at tracking suitable environmental conditions and therefore are more likely to persist when such changes occur (Cleland et al. 2012).
Diverse factors have been reported to contribute to flowering time regulation, particularly day length and vernalization pathways (e.g., Michaels 2009), but most studies have been conducted in temperate regions. Little is known about the way rain influences flowering time in tropical ecosystems. Unlike in other biomes such as temperate forests, phenology might be less sensitive to temperature and photoperiod, which tend to vary less as one gets closer to the equator, and more tuned to seasonal shifts in precipitation (Reich 1995; Sakai 2001). Within tropical forests, a broad spectrum of flowering patterns has been found (Sakai 2001), and observed variations in phenology may arise from phenotypic plasticity or from genetically based local adaptations or a combination thereof (e.g., Zalamea et al. 2011; Anderson et al. 2012).
Coffee flowering phenology has been characterized as highly dependent on climatic factors such as precipitation (Crisosto et al. 1992), photoperiod (Majerowicz and Söndahl 2005), and temperature (Lin 2008), and it is genetically controlled (Le Pierrès 1995). We obtained evidence of a genetic influence on flowering patterns, as seen in the way in which the three Coffea species studied flowered after a triggering rain. The time between this rain and the flowering date was well conserved, strictly species‐dependent, and followed a clear sequence in which C. liberica flowered first, followed by C. canephora and then C. arabica. This sequence has also been observed in Africa where blossoming occurs 5–6, 7, and 8 days after this rain for C. liberica, C. canephora, and C. arabica, respectively (Le Pierrès 1995). Moreover, all individuals of a species flowered synchronously. The genetic basis of the main flowering period was also recently suggested through interspecific controlled crosses between C. canephora and C. pseudozanguebariae (Akaffou et al. 2014). The fact that the flowering sequences were the same regardless of the environment – Africa or New Caledonia – and only depended on the intensity of the triggering rain suggests that Coffea species are able to track suitable environmental conditions, in particular precipitation, which might have facilitated the establishment of the species after their introduction.
Flowering patterns in Coffea thus appear to have a strong genetic component, causing the flowering times of each species to remain distinct. Moreover, flowering events over the study season showed distinct major peaks according to the species, which may suggest different period of attractiveness to pollinators. Partly asynchronous responses among species to key environmental factors would thus be expected to act as prezygotic barriers. However, we unexpectedly observed the contrary in the Sarraméa region. The clear climatic divergences regarding the precipitation regime between native and introduced ranges made these reproductive barriers less effective without weakening them.
Rainfall regime favors interspecific hybridization
Indeed, bioclimatic variables in the Sarraméa region in New Caledonia are characterized by a less marked dry season (lower precipitation seasonality and higher precipitation during driest period and warmest quarter) than in the native ranges of the three African species studied. This appears to be congruent with the direct precipitation records from a weather station and a previous comparative study based on climogram analysis (Gomez et al. 2010a). The lack of a well‐marked dry season is considered to influence flower bud formation by creating different levels of induction (Crisosto et al. 1992) and favoring multiple flowering events during a season.
Moreover, because the triggering rains are closely distributed in time, the period between the successive flowering sequences is shortened and an overlap between species flowering is more likely to occur. In particular, stage 5 (when the style is receptive) of one species may overlap with stage 4 (anthesis, with both sexes fertile) of the next species, thus enabling interspecific gene flow. In fact, across the Sarraméa population, 4% of interspecific hybrids (15 individuals of 367 genotyped individuals) have been observed between each pair of species, independently of their ploidy level and with various levels of introgression. The presence of later generation hybrids resulting from backcrossing of F1 and later hybrid individuals provides clear evidence of hybrid fertility and successful gene flow. This zone is of exceptional significance as no similar phenomenon of spontaneous interspecific hybridization between C. arabica and C. canephora has been noted elsewhere in the world, except for a rare event observed in Timor leading to the so‐called Timor hybrid (Cramer 1957). Interspecific gene flows are currently well studied in natural long‐standing hybrid zones and provide a better understanding of the hybridization levels in relation to ecological factors (Lexer et al. 2005; Gow et al. 2006). However, understanding these factors in a case of introduction of several ecologically divergent species gives additional clue about which components of the climate are likely to be most important in generating the hybridization.
Conclusion
Although the chances of adaptation and gene flow between the three Coffea species studied may have appeared a priori to have been relatively low in New Caledonia because of a lack of habitat suitability, the species coexist, persist, and hybridize spontaneously through the partial overlap of each species flowering sequence induced by the rainfall regime. In the future, shifts in precipitation are expected to occur worldwide concomitantly with increasing temperatures (Hartmann et al. 2013) and could generate new environmental situations affecting flowering patterns and thus reproductive barriers. Moreover, introgressive hybridization, by providing novel genetic combinations, might precede adaptation and evolutionary diversification and may result in a pathway to the rapid evolution of invasive forms (Ellstrand and Schierenbeck 2000). Although only 0.5% of the world's tree species are currently invasive outside of their natural range (Richardson and Rejmanek 2011), coffee trees may spread from planting sites and may become a threat like in the Indian Western Ghats (Joshi et al. 2009). Although coffee tree in the wild in New Caledonia does not seem to compete with native flora, it could be important to study the outcome of Sarraméa hybrids in terms of fitness and phenology, for example, in controlled conditions. This would help to predict and rank the invasiveness potential and future of the population, in terms of ecological and socioeconomic impacts by comparison with listed invasive species of New Caledonia (Meyer 2000).
Conflict of Interest
None declared.
Supporting information
Figure S1. Three‐species Sarraméa population.
Figure S2. Principal coordinate analysis of Sarraméa accessions and species referent samples based on their SSR polymorphism.
Figure S3. Bloom intensity over a flowering season in Sarraméa.
Figure S4. Species distribution predictions in their native and common introduced ranges.
Figure S5. Identity and background test for niche comparisons.
Table S1. Triggering showers and flowering of the three species.
Acknowledgments
The authors gratefully acknowledge the financial support of the DDR (Direction du Développement rural), Province Sud of New Caledonia (Convention 531‐PVF/DDR). We thank the members of the DDR at Port‐Laguerre Station, the botanical laboratory, and the genomic platform “plateforme du vivant” at IRD Nouméa for their assistance. We wish to express our sincere thanks to Joseph Ouckewen for his assistance in the field work. The authors thank Bourdeau for kindly hosting our weather station, and the Brinon, Delcuignié, and Bonnard families, as well as the people of the Sarraméa, Petit Couli, and Grand Couli tribes for their hospitality. We thank F. Munoz and an anonymous reviewer for a very detailed and comprehensive review.
References
- Abbott, R. J. 1992. Plant invasions, interspecific hybridization and the evolution of new plant taxa. Trends Ecol. Evol. 7:401–405. [DOI] [PubMed] [Google Scholar]
- Abbott, R. J. , James J. K., Milne R. I., and Gillies A. C.. 2003. Plant introductions, hybridization and gene flow. Philos. Trans. R. Soc. Lond. B Biol. Sci. 358:1123–1132. [DOI] [PMC free article] [PubMed] [Google Scholar]
- Akaffou, D. S. , Konate I., Sié R. S., Poncet V., Zoro Bi I. A., Keli J., et al. 2014. Flowering phenology and yield‐related traits in the interspecific cross between Coffea pseudozanguebariae Bridson and C. canephora Pierre. Aust. J. Crop Sci. 8:1272–1280. [Google Scholar]
- Allan, E. , and Pannell J. R.. 2009. Rapid divergence in physiological and life‐history traits between northern and southern populations of the British introduced neo‐species, Senecio squalidus . Oikos 118:1053–1061. [Google Scholar]
- Allendorf, F. W. , Leary R. F., Spruell P., and Wenburg J. K.. 2001. The problems with hybrids: setting conservation guidelines. Trends Ecol. Evol. 16:613–622. [Google Scholar]
- Anderson, J. T. , Inouye D. W., McKinney A. M., Colautti R. I., and Mitchell‐Olds T.. 2012. Phenotypic plasticity and adaptive evolution contribute to advancing flowering phenology in response to climate change. Proc. Biol. Sci. 279:3843–3852. [DOI] [PMC free article] [PubMed] [Google Scholar]
- Anthony, F. , Couturon E., and de Namur C. 1985. Les caféiers sauvages du Cameroun. Résultats d'une mission de prospection effectuée par l'ORSTOM en 1983. In: 11e Colloque ASIC, pp. 495–501, Lomé, Togo. [Google Scholar]
- Arcila‐Pulgarin, J. , Buhr L., Bleiholder H., Hack H., Meier U., and Wicke H.. 2002. Application of the extended BBCH scale for the description of the growth stages of coffee (Coffea spp.). Ann. Appl. Biol. 141:19–27. [Google Scholar]
- Benkman, C. W. , Siepielski A. M., and Parchman T. L.. 2008. The local introduction of strongly interacting species and the loss of geographic variation in species and species interactions. Mol. Ecol. 17:395–404. [DOI] [PubMed] [Google Scholar]
- Berthaud, J. 1986. Les ressources génétiques pour l'amélioration des caféiers africains diploïdes, Collection Travaux et documents edn. Orstom, Montpellier, France. [Google Scholar]
- Berthaud, J. , and Guillaumet J. L.. 1978. Les caféiers sauvages en Centrafrique. Résultats d'une mission de prospection (Janvier‐février 1975). Café Cacao Thé 22:171–186. [Google Scholar]
- Berthaud, J. , Anthony F., and Lourd M.. 1983. Les caféiers sauvages de Tanzanie. Résultats d'une mission de prospection effectuée du 5 mars au 11 avril 1982. Café Cacao Thé 27:245–258. [Google Scholar]
- Bettencourt, A. 1973. Cosideraçoes gerais sobre o “Hibrido de Timor”. Instituto Agronomico de Campinas, Circular No. 31, Campinas, 285.
- Blair, A. C. , and Hufbauer R. A.. 2010. Hybridization and invasion: one of North America's most devastating invasive plants shows evidence for a history of interspecific hybridization. Evol. Appl. 3:40–51. [DOI] [PMC free article] [PubMed] [Google Scholar]
- Borchert, R. , Meyer S. A., Felger R. S., and Porter‐Bolland L.. 2004. Environmental control of flowering periodicity in Costa Rican and Mexican tropical dry forests. Glob. Ecol. Biogeogr. 13:409–425. [Google Scholar]
- Broennimann, O. , Treier U. A., Muller‐Scharer H., Thuiller W., Peterson A. T., and Guisan A.. 2007. Evidence of climatic niche shift during biological invasion. Ecol. Lett. 10:701–709. [DOI] [PubMed] [Google Scholar]
- Burgarella, C. , Lorenzo Z., Jabbour‐Zahab R., Lumaret R., Guichoux E., Petit R. J., et al. 2009. Detection of hybrids in nature: application to oaks (Quercus suber and Q. ilex). Heredity (Edinb) 102:442–452. [DOI] [PubMed] [Google Scholar]
- Bustamante, E. , and Burquez A.. 2008. Effects of plant size and weather on the flowering phenology of the organ pipe cactus (Stenocereus thurberi). Ann. Bot. 102:1019–1030. [DOI] [PMC free article] [PubMed] [Google Scholar]
- Campbell, L. G. , Snow A. A., and Ridley C. E.. 2006. Weed evolution after crop gene introgression: greater survival and fecundity of hybrids in a new environment. Ecol. Lett. 9:1198–1209. [DOI] [PubMed] [Google Scholar]
- Chessel, D. , Dufour A.‐B., and Thioulouse J.. 2004. The ade4 package‐I‐One‐table methods. R. News, 4:5–10. [Google Scholar]
- Chevalier, A. . 1946. Ecologie et distribution géographique des caféiers sauvages et cultivés. Rev. Bot. Appl. Agric. Trop., 281:81–94. [Google Scholar]
- Cleland, E. E. , Chuine I., Menzel A., Mooney H. A., and Schwartz M. D.. 2007. Shifting plant phenology in response to global change. Trends Ecol. Evol. 22:357–365. [DOI] [PubMed] [Google Scholar]
- Cleland, E. E. , Allen J. M., Crimmins T. M., Dunne J. A., Pau S., Travers S. E., et al. 2012. Phenological tracking enables positive species responses to climate change. Ecology 93:1765–1771. [DOI] [PubMed] [Google Scholar]
- Colautti, R. I. , and Barrett S. C. H.. 2013. Rapid adaptation to climate facilitates range expansion of an invasive plant. Science 342:364–366. [DOI] [PubMed] [Google Scholar]
- Cooper, J. , Crafford J. E., and Hecht T.. 1992. Introduction and extinction of Brown Trout (Salmo trutta L) in an impoverished Sub‐Antarctic stream. Antarct. Sci. 4:9–14. [Google Scholar]
- Cornuault, J. , Khimoun A., Cuneo P., and Besnard G.. 2015. Spatial segregation and realized niche shift during the parallel invasion of two olive subspecies in south‐eastern Australia. J. Biogeogr. 42:1930–1941. [Google Scholar]
- Cowling, R. M. , Ojeda F., Lamont B. B., Rundel P. W., and Lechmere‐Oertel R.. 2005. Rainfall reliability, a neglected factor in explaining convergence and divergence of plant traits in fire‐prone mediterranean‐climate ecosystems. Glob. Ecol. Biogeogr. 14:509–519. [Google Scholar]
- Cramer, P. J. S. 1957. A review of literature of coffee research in Indonesia. SIC Editorial, Inter American Institute of Agricultural Sciences, Turrialba, Costa Rica. [Google Scholar]
- Crisosto, C. H. , Grantz D. A., and Meinzer F. C.. 1992. Effects of water deficit on flower opening in coffee (Coffea arabica L.). Tree Physiol. 10:127–139. [DOI] [PubMed] [Google Scholar]
- DaMatta, F. M. , Ronchi C. P., Maestri M., and Barros R. S.. 2007. Ecophysiology of coffee growth and production. Braz. J. Plant Physiol. 19:485–510. [Google Scholar]
- Davis, A. P. , Govaerts R., Bridson D. M., and Stoffelen P.. 2006. An annotated taxonomic conspectus of the genus Coffea (Rubiaceae). Bot. J. Linn. Soc. 152:465–512. [Google Scholar]
- Davis, A. P. , Tosh J., Ruch N., and Fay M. F.. 2011. Growing coffee: Psilanthus (Rubiaceae) subsumed on the basis of molecular and morphological data; implications for the size, morphology, distribution and evolutionary history of Coffea . Bot. J. Linn. Soc. 167:357–377. [Google Scholar]
- Denoeud, F. , Carretero‐Paulet L., Dereeper A., Droc G., Guyot R., Pietrella M., et al. 2014. The coffee genome provides insight into the convergent evolution of caffeine biosynthesis. Science 345:1181–1184. [DOI] [PubMed] [Google Scholar]
- Dereeper, A. , Bocs S., Rouard M., Guignon V., Ravel S., Tranchant‐Dubreuil C., et al. 2015. The coffee genome hub: a resource for coffee genomes. Nucleic Acids Res. 43:D1028–D1035. [DOI] [PMC free article] [PubMed] [Google Scholar]
- Dinnan, J. E. , and Menzel C. M.. 1994. Synchronization of anthesis and enhancement of vegetative growth in coffee (Coffea arabica L) following water‐stress during flora initiation. J. Hortic. Sci. 69:841–849. [Google Scholar]
- Elith, J. , Graham C. H., Anderson R. P., Dudik M., Ferrier S., Guisan A., et al. 2006. Novel methods improve prediction of species’ distributions from occurrence data. Ecography 29:129–151. [Google Scholar]
- Ellstrand, N. C. , and Schierenbeck K. A.. 2000. Hybridization as a stimulus for the evolution of invasiveness in plants? Proc. Natl Acad. Sci. USA 97:7043–7050. [DOI] [PMC free article] [PubMed] [Google Scholar]
- Evanno, G. , Regnaut S., and Goudet J.. 2005. Detecting the number of clusters of individuals using the software STRUCTURE: a simulation study. Mol. Ecol. 14:2611–2620. [DOI] [PubMed] [Google Scholar]
- Falush, D. , Stephens M., and Pritchard J. K.. 2003. Inference of population structure using multilocus genotype data: linked loci and correlated allele frequencies. Genetics 164:1567–1587. [DOI] [PMC free article] [PubMed] [Google Scholar]
- Franks, S. J. , Sim S., and Weis A. E.. 2007. Rapid evolution of flowering time by an annual plant in response to a climate fluctuation. Proc. Natl Acad. Sci. USA 104:1278–1282. [DOI] [PMC free article] [PubMed] [Google Scholar]
- Gomez, C. , Dussert S., Hamon P., Hamon S., de Kochko A., and Poncet V.. 2009. Current genetic differentiation of Coffea canephora Pierre ex A. Froehn in the Guineo‐Congolian African zone: cumulative impact of ancient climatic changes and recent human activities. BMC Evol. Biol. 9:167. [DOI] [PMC free article] [PubMed] [Google Scholar]
- Gomez, C. , Batti A., Le Pierres D., Campa C., Hamon S., de Kochko A., et al. 2010a. Favourable habitats for Coffea inter‐specific hybridization in central New Caledonia: combined genetic and spatial analyses. J. Appl. Ecol. 47:85–95. [Google Scholar]
- Gomez, C. , Mangeas M., Petit M., Corbane C., Hamon P., Hamon S., et al. 2010b. Use of high‐resolution satellite imagery in an integrated model to predict the distribution of shade coffee tree hybrid zones. Remote Sens. Environ. 114:2731–2744. [Google Scholar]
- Gow, J. L. , Peichel C. L., and Taylor E. B.. 2006. Contrasting hybridization rates between sympatric three‐spined sticklebacks highlight the fragility of reproductive barriers between evolutionarily young species. Mol. Ecol. 15:739–752. [DOI] [PubMed] [Google Scholar]
- Graham, C. H. , and Hijmans R. J.. 2006. A comparison of methods for mapping species ranges and species richness. Glob. Ecol. Biogeogr. 15:578–587. [Google Scholar]
- Guisan, A. , and Thuiller W.. 2005. Predicting species distribution: offering more than simple habitat models. Ecol. Lett. 8:993–1009. [DOI] [PubMed] [Google Scholar]
- Hartmann, D. , Klein Tank A., Rusticucci M., Alexander L., Brönnimann S., Charabi Y., et al. 2013. Observations: atmosphere and surface Pp. 159–254 in Stocker T., Qin D., Plattner G.‐K., Tignor M., Allen S., Boschung J., Nauels A., Xia Y., Bex V., and Midgley P., eds. Climate change 2013: the physical science basis. Contribution of working group I to the fifth assessment report of the intergovernmental panel on climate change. Cambridge University Press, Cambridge, UK: and New York, NY. [Google Scholar]
- Hijmans, R. J. , Cameron S. E., Parra J. L., Jones P. G., and Jarvis A.. 2005. Very high resolution interpolated climate surfaces for global land areas. Int. J. Climatol. 25:1965–1978. [Google Scholar]
- Imaizumi, T. , and Kay S. A.. 2006. Photoperiodic control of flowering: not only by coincidence. Trends Plant Sci. 11:550–558. [DOI] [PubMed] [Google Scholar]
- Joshi, A. A. , Mudappa D., and Raman T. R. S.. 2009. Brewing trouble: coffee invasion in relation to edges and forest structure in tropical rainforest fragments of the Western Ghats, India. Biol. Invasions 11:2387–2400. [Google Scholar]
- Kohler, J.‐M. , and Pillon P.. 1986. L'opération café. ORSTOM, Nouméa. [Google Scholar]
- Lamont, B. B. , He T., Enright N. J., Krauss S. L., and Miller B. P.. 2003. Anthropogenic disturbance promotes hybridization between Banksia species by altering their biology. J. Evol. Biol. 16:551–557. [DOI] [PubMed] [Google Scholar]
- Lashermes, P. , Cros J., Combes M. C., Trouslot P., Anthony F., Hamon S., et al. 1996. Inheritance and restriction fragment length polymorphism of chloroplast DNA in the genus Coffea L. Theor. Appl. Genet. 93:626–632. [DOI] [PubMed] [Google Scholar]
- Le Pierrès, D. 1995. Etude des hybrides interspécifiques tétraploïdes de première génération entre Coffea arabica L. et les caféiers diploïdes. Thèse Doctorale, Université Paris XI, Orsay (France).
- Le Pierrès, D. , Charmetant P., Yapo A., Leroy T., Couturon E., Bontems S., et al. 1989. Les caféiers sauvages de Côte‐d'Ivoire et de Guinée: bilan des missions de prospection effectuées de 1984 à 1987 Pp. 420–428. 13eme Colloque ASIC. Paipa, Colombie. [Google Scholar]
- Leblic, I. 2007. Café, développement et autochtonie en Nouvelle‐Cadédonie. Etud. Rurales 2:117–130. [Google Scholar]
- Lexer, C. , Fay M. F., Joseph J. A., Nica M. S., and Heinze B.. 2005. Barrier to gene flow between two ecologically divergent Populus species, P. alba (white poplar) and P. tremula (European aspen): the role of ecology and life history in gene introgression. Mol. Ecol. 14:1045–1057. [DOI] [PubMed] [Google Scholar]
- Lin, B. B. 2008. Microclimate effects on flowering success in coffee agroforestry systems. Am. Eurasian J. Agric. Environ. Sci. 3:148–152. [Google Scholar]
- Liu, K. , and Muse S. V.. 2005. PowerMarker: an integrated analysis environment for genetic marker analysis. Bioinformatics 21:2128–2129. [DOI] [PubMed] [Google Scholar]
- Louarn, J. 1992. La fertilité des hybrides interspécifiques et les relations génomiques entre caféiers diploïdes d'origine africaine (Genre Coffea L. sous‐genre Coffea). Thèse d'Etat, Montpellier II, Sciences et Techniques du Languedoc, Montpellier, France.
- Majerowicz, N. , and Söndahl M. R.. 2005. Induction and differentiation of reproductive buds in Coffea arabica L. Braz. J. Plant Physiol. 17:247–254. [Google Scholar]
- Mandle, L. , Warren D. L., Hoffmann M. H., Peterson A. T., Schmitt J., and von Wettberg E. J.. 2010. Conclusions about niche expansion in introduced Impatiens walleriana populations depend on method of analysis. PLoS ONE, 5:e15297. doi:10.1371/journal.pone.0015297. [DOI] [PMC free article] [PubMed] [Google Scholar]
- Maron, J. L. , Vila M., Bommarco R., Elmendorf S., and Beardsley P.. 2004. Rapid evolution of an invasive plant. Ecol. Monogr. 74:261–280. [Google Scholar]
- Maurin, O. , Davis A. P., Chester M., Mvungi E. F., Jaufeerally‐Fakim Y., and Fay M. F.. 2007. Towards a Phylogeny for Coffea (Rubiaceae): identifying well‐supported lineages based on nuclear and plastid DNA sequences. Ann. Bot. (Lond) 100:1565–1583. [DOI] [PMC free article] [PubMed] [Google Scholar]
- Meyer, F. 1968. FAO Coffee mission to Ethiopia, 1964–1965. Food and Agriculture Organization of the United Nations, Rome. [Google Scholar]
- Meyer, J.‐Y. 2000. Preliminary review of the invasive plants in the Pacific islands (SPREP Member Countries) Pp. 85–114 in Sherley G., ed. Invasive species in the Pacific: a technical review and draft regional strategy. SPREP, 2000. [Google Scholar]
- Michaels, S. D. 2009. Flowering time regulation produces much fruit. Curr. Opin. Plant Biol. 12:75–80. [DOI] [PMC free article] [PubMed] [Google Scholar]
- Musoli, P. , Cubry P., Aluka P., Billot C., Dufour M., De Bellis F., et al. 2009. Genetic differentiation of wild and cultivated populations: diversity of Coffea canephora Pierre in Uganda. Genome 52:634–646. [DOI] [PubMed] [Google Scholar]
- N’ Diaye, A. , Poncet V., Louarn J., Hamon S., and Noirot M.. 2005. Genetic differentiation between Coffea liberica var. liberica and C. liberica var. dewevrei and comparison with C. canephora . Plant Syst. Evol., 253:95–104. [Google Scholar]
- N’ Diaye, A. , Noirot M., Hamon S., and Poncet V.. 2007. Genetic basis of species differentiation between Coffea liberica Hiern and C. canephora Pierre: analysis of an interspecific cross. Genet. Resour. Crop Evol., 54:1011–1021. [Google Scholar]
- Nakazato, T. , Warren D. L., and Moyle L. C.. 2010. Ecological and Geographic Modes of Species Divergence in Wild Tomatoes. Am. J. Bot. 97:680–693. [DOI] [PubMed] [Google Scholar]
- de Namur, C. , Couturon E., Sita P., and Anthony F.. 1987. Résultats d'une mission de prospection des caféiers sauvages du Congo. Colloque Scientifique International sur le Café, pp. 397‐404. ASIC, 12, Montreux (CHE).
- Noirot, M. , Charrier A., Stoffelen P., and Anthony F.. 2015. Reproductive isolation, gene flow and speciation in the former Coffea subgenus: a review. Trees‐Struct. Funct. doi: 10.1007/s00468‐015‐1335‐8. [Google Scholar]
- Parmesan, C. 2006. Ecological and evolutionary responses to recent climate change. Annu. Rev. Ecol. Evol. Syst. 37:637–669. [Google Scholar]
- Peakall, R. , and Smouse P. E.. 2012. GenAlEx 6.5: genetic analysis in Excel. Population genetic software for teaching and research–an update. Bioinformatics 28:2537–2539. [DOI] [PMC free article] [PubMed] [Google Scholar]
- Pearman, P. B. , Guisan A., Broennimann O., and Randin C. F.. 2008. Niche dynamics in space and time. Trends Ecol. Evol. 23:149–158. [DOI] [PubMed] [Google Scholar]
- Petit, C. , Lesbros P., Ge X. J., and Thompson J. D.. 1997. Variation in flowering phenology and selfing rate across a contact zone between diploid and tetraploid Arrhenatherum elatius (Poaceae). Heredity 79:31–40. [Google Scholar]
- Petitpierre, B. , Kueffer C., Broennimann O., Randin C., Daehler C., and Guisan A.. 2012. Climatic niche shifts are rare among terrestrial plant invaders. Science 335:1344–1348. [DOI] [PubMed] [Google Scholar]
- Phillips, S. J. , Anderson R. P., and Schapire R. E.. 2006. Maximum entropy modeling of species geographic distributions. Ecol. Model. 190:231–259. [Google Scholar]
- Plechakova, O. , Tranchant‐Dubreuil C., Benedet F., Couderc M., Tinaut A., Viader V., et al. 2009. MoccaDB ‐ an integrative database for functional, comparative and diversity studies in the Rubiaceae family. BMC Plant Biol., 9:123. [DOI] [PMC free article] [PubMed] [Google Scholar]
- Poncet, V. , Rondeau M., Tranchant C., Cayrel A., Hamon S., de Kochko A., et al. 2006. SSR mining in coffee tree EST databases: potential use of EST‐SSRs as markers for the Coffea genus. Mol. Genet. Genomics 276:436–449. [DOI] [PubMed] [Google Scholar]
- Poncet, V. , Dufour M., Hamon P., Hamon S., de Kochko A., and Leroy T.. 2007. Development of genomic microsatellite markers in Coffea canephora and their transferability to other coffee species. Genome 50:1156–1161. [DOI] [PubMed] [Google Scholar]
- Pritchard, J. K. , Stephens M., and Donnelly P.. 2000. Inference of population structure using multilocus genotype data. Genetics 155:945–959. [DOI] [PMC free article] [PubMed] [Google Scholar]
- Reich, P. B. 1995. Phenology of tropical forests ‐ patterns, causes, and consequences. Can. J. Bot. 73:164–174. [Google Scholar]
- Richardson, D. M. , and Rejmanek M.. 2011. Trees and shrubs as invasive alien species ‐ a global review. Divers. Distrib. 17:788–809. [Google Scholar]
- Sakai, S. 2001. Phenological diversity in tropical forests. Popul. Ecol. 43:77–86. [Google Scholar]
- Schoener, T. 1968. The Anolis lizards of Bimini: resource partitioning in a complex fauna. Ecology 49:704–726. [Google Scholar]
- Schuch, U. K. , Fuchigami L. H., and Nagao M. A.. 1992. Flowering, ethylene production, and ion leakage of coffee in response to water‐stress and gibberellic‐acid. J. Am. Soc. Hortic. Sci. 117:158–163. [Google Scholar]
- Steeves, T. E. , Maloney R. F., Hale M. L., Tylianakis J. M., and Gemmell N. J.. 2010. Genetic analyses reveal hybridization but no hybrid swarm in one of the world's rarest birds. Mol. Ecol. 19:5090–5100. [DOI] [PubMed] [Google Scholar]
- Strayer, D. L. , Eviner V. T., Jeschke J. M., and Pace M. L.. 2006. Understanding the long‐term effects of species invasions. Trends Ecol. Evol. 21:645–651. [DOI] [PubMed] [Google Scholar]
- Tesfaye, K. , Borsch T., Govers K., and Bekele E.. 2007. Characterization of Coffea chloroplast microsatellites and evidence for the recent divergence of C. arabica and C. eugenioides chloroplast genomes. Genome 50:1112–1129. [DOI] [PubMed] [Google Scholar]
- Warren, D. L. , Glor R. E., and Turelli M.. 2008. Environmental niche equivalency versus conservatism: quantitative approaches to niche evolution. Evolution 62:2868–2883. [DOI] [PubMed] [Google Scholar]
- Warren, D. L. , Glor R. E., and Turelli M.. 2010. ENMTools: a toolbox for comparative studies of environmental niche models. Ecography 33:607–611. [Google Scholar]
- Wisz, M. S. , Hijmans R. J., Li J., Peterson A. T., Graham C. H., Guisan A., et al. 2008. Effects of sample size on the performance of species distribution models. Divers. Distrib. 14:763–773. [Google Scholar]
- Wolkovich, E. M. , Davies T. J., Schaefer H., Cleland E. E., Cook B. I., Travers S. E., et al. 2013. Temperature‐dependent shifts in phenology contribute to the success of exotic species with climate change. Am. J. Bot. 100:1407–1421. [DOI] [PubMed] [Google Scholar]
- Yu, Q. Y. , Guyot R., de Kochko A., Byers A., Navajas‐Perez R., Langston B. J., et al. 2011. Micro‐collinearity and genome evolution in the vicinity of an ethylene receptor gene of cultivated diploid and allotetraploid coffee species (Coffea). Plant J. 67:305–317. [DOI] [PubMed] [Google Scholar]
- Zalamea, P. C. , Munoz F., Stevenson P. R., Paine C. E., Sarmiento C., Sabatier D., et al. 2011. Continental‐scale patterns of Cecropia reproductive phenology: evidence from herbarium specimens. Proc. Biol. Sci. 278:2437–2445. [DOI] [PMC free article] [PubMed] [Google Scholar]
- Zalapa, J. E. , Brunet J., and Guries R. P.. 2010. The extent of hybridization and its impact on the genetic diversity and population structure of an invasive tree, Ulmus pumila (Ulmaceae). Evol. Appl. 3:157–168. [DOI] [PMC free article] [PubMed] [Google Scholar]
Associated Data
This section collects any data citations, data availability statements, or supplementary materials included in this article.
Supplementary Materials
Figure S1. Three‐species Sarraméa population.
Figure S2. Principal coordinate analysis of Sarraméa accessions and species referent samples based on their SSR polymorphism.
Figure S3. Bloom intensity over a flowering season in Sarraméa.
Figure S4. Species distribution predictions in their native and common introduced ranges.
Figure S5. Identity and background test for niche comparisons.
Table S1. Triggering showers and flowering of the three species.