Abstract
For strongly correlated oxides, it has been a long-standing issue regarding the role of the chemical ordering of the dopants on the physical properties. Here, using unit cell by unit cell superlattice growth technique, we determine the role of chemical ordering of the Pr dopant in a colossal magnetoresistant (La1−yPry)1−xCaxMnO3 (LPCMO) system, which has been well known for its large length-scale electronic phase separation phenomena. Our experimental results show that the chemical ordering of Pr leads to marked reduction of the length scale of electronic phase separations. Moreover, compared with the conventional Pr-disordered LPCMO system, the Pr-ordered LPCMO system has a metal–insulator transition that is ∼100 K higher because the ferromagnetic metallic phase is more dominant at all temperatures below the Curie temperature.
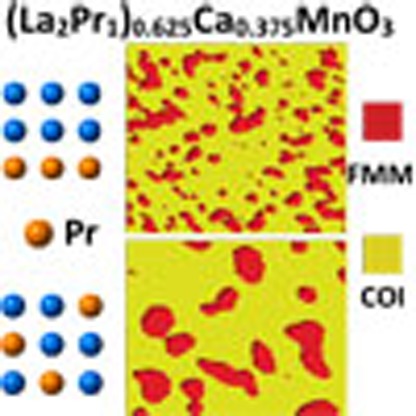 In oxide materials, cation doping strongly influences the electronic correlations which promote diverse phenomena such as colossal magnetoresistance and superconductivity. Here, the authors use magnetic microscopy to image the effects of spatially ordered doping on electronic phase separation in oxide superlattices.
For most of the strongly correlated systems, including colossal magnetoresistive (CMR) manganites1,2,3,4 and high-Tc superconductors5,6,7,8,9,10, their remarkable physical properties often originate from and depend sensitively on chemical doping. In general, the spatial locations of the chemical dopants are random, which generates a certain kind of disorder in the system. For CMR mangnanites, it has been shown that the ordering of chemical dopants, or the cation ordering has strong influence on the physical properties for both bulk11,12,13,14,15,16,17 and superlattice structures18,19,20,21,22,23,24,25,26. However, very few work has dealt the correlation between cation ordering and the electronic phase separation (EPS)27, despite of the fact that EPS is important for both understanding the mechanism of strong electronic correlation and for tuning the physical properties.
Because of its importance, great amount of effort has been made to study EPS phenomena, including their physical appearance and dynamics28,29,30,31,32. In most manganites systems, the length scale of EPS has been observed to be a few tens of nanometres or less33,34,35. However, several CMR manganites exhibit large EPS domains up to micron scale30,36,37,38,39. Considering the fact that the randomness of the spatial distribution of the chemical dopants is limited within nanometre scale, such large-scale EPS is energetically unfavourable and is thus under debate, regarding its physical origin40,41,42.
One of the most studied large length-scale EPS system is (La1−yPry)1−xCaxMnO3 (LPCMO)36,37,38,39. The physical properties of the LPCMO system appear to depend sensitively on the Pr doping38,43. Here, to examine how spatial distribution of the Pr dopants affect the length-scale of EPS in the LPCMO system, we prepare spatially ordered Pr-doped LPCMO system by growing alternating 2 unit cell La0.625Ca0.375MnO3 (LCMO) and 1 unit cell Pr0.625Ca0.375MnO3 (PCMO) superlattices (ordered LPCMO or O-LPCMO), and compare their EPS domain size with that of the conventional LPCMO system (random LPCMO or R-LPCMO), with the same nominal doping concentration. Real space imaging by magnetic force microscopy (MFM) shows that the length scale of the EPS in the O-LPCMO system is considerably smaller than that of the R-LPCMO. Our numerical simulation based on the random-field Ising model (RFIM)44 indicates that the spatial distribution of Pr dopants has strong influence on the bandwidth modulation, leading to different length scale of EPS in the O- and R-LPCMO systems. The chemical ordering of Pr has marked effect on the physical properties of the LPCMO system as well, as the metal–insulator transition (MIT) temperature (TP) of the O-LPCMO is ∼100 K higher than that of the R-LPCMO.
Results
Structural characterizations
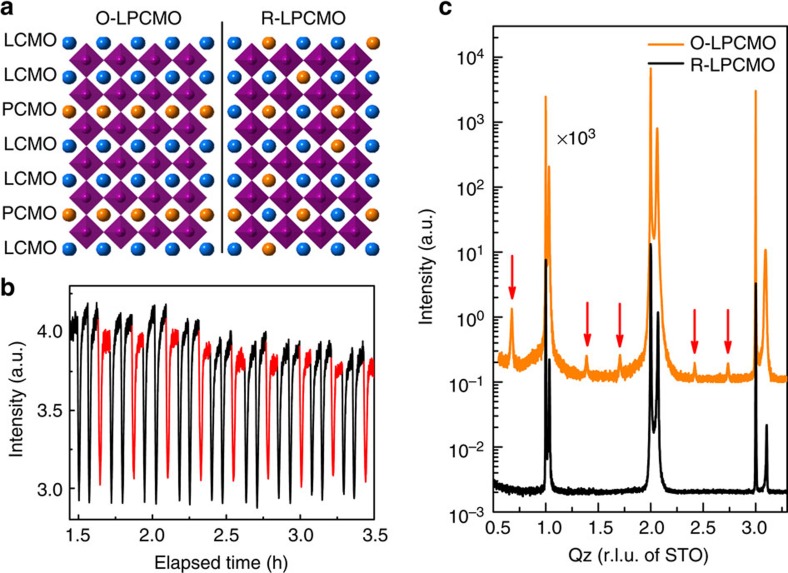
[(LCMO)2/(PCMO)1]53 superlattices are epitaxially grown on SrTiO3(100) substrates, using laser molecular beam epitaxy. The La/Pr cations form fully ordered two-dimensional layers while preserving their ratio to be 2:1. For comparison, conventional LPCMO thin films with same thickness and same nominal doping concentration of Pr are also epitaxially grown on the SrTiO3 substrates. Figure 1a shows the schematic view of the crystal structures of the O-LPCMO and the R-LPCMO. Figure 1b shows the in situ reflection high-energy electron diffraction intensity oscillations reflecting the unit cell by unit cell growth of the LCMO (black) and the PCMO (red) layers. The precise control of the growth allows the formation of high quality [(LCMO)2/(PCMO)1]53 superlattices, as proven by the distinct X-ray diffraction (XRD) superlattice peaks in Fig. 1c (indicated by red arrows, detailed analysis see Supplementary Figs 1 and 2; Supplementary Note 1; Supplementary Table 1). The R-LPCMO films, while also having high quality, do not exhibit superlattice peaks as expected. The reciprocal space mapping of the two sample are shown in Supplementary Fig. 3 and Supplementary Note 2. The calculated Poisson's ratio for the biaxially strained film R-LPCMO and O-LPCMO are ∼0.372 and ∼0.325, respectively. So both samples are well strained from the SrTiO3 substrate. Moreover, we have performed X-ray refraction measurements and our fitting results indicate that the LCMO/PCMO interfaces in the O-LPCMO are really sharp and almost have no intermixing (∼0.01 nm).The details can be found in Supplementary Fig. 4 and Supplementary Note 3.
Figure 1. Crystal structure and growth of O-LPCMO and R-LPCMO thin films.
(a) Schematic view of crystal structure of the O-LPCMO and the R-LPCMO. The orange and blue spheres represent Pr(Ca) and La(Ca) atoms, respectively. The La/Pr cations form fully ordered two-dimensional layers while preserving the ratio between La and Pr to be 2:1 in O-LPCMO. (b) RHEED intensity oscillation during the unit cell by unit cell growth of LCMO (black) and PCMO (red). (c) X-ray diffraction of O-LPCMO (orange) and R-LPCMO (black), with red arrows indicating the superlattice peaks. The intensity of O-LPCMO is enlarged 1,000 times for contrast.
Transport and magnetic properties
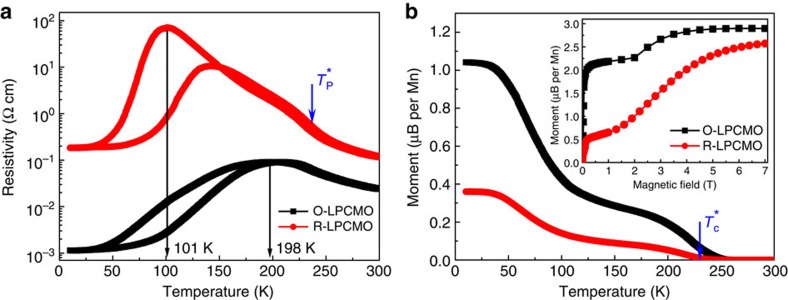
The transport and magnetic properties of the R-LPCMO and the O-LPCMO films are markedly different. As shown by the temperature-dependent resistivity (R–T) measurement in Fig. 2a, the MIT temperature and the resistivity of the O-LPCMO are ∼100 K higher and approximately three orders of magnitude smaller than those of the R-LPCMO thin film, respectively. The temperature-dependent magnetization measurement of the two films are shown in Fig. 2b, with the inset showing the initial magnetization curves at 10 K. (We also measured the transport and magnetic properties of 40-nm pure LCMO film, and compare the properties among pure LCMO, O-LPCMO and R-LPCMO, see Supplementary Fig. 5 and Supplementary Note 4.) The initial steep rise of the magnetization in the initial magnetization curves reflects the response of the ferromagnetic metallic (FMM) phase in the system, which can be aligned with a relatively smaller field. With increasing field, the charge-ordered insulating (COI) phase is melted and transforms into FMM phase, leading to a plateau followed by a further increase of magnetization towards saturation45. The volume fraction of the FMM phase can thus be estimated by the ratio between the initial low-field-induced steep rise of magnetization and the final high-field saturation. The FMM phase is clearly more dominant in the O-LPCMO system, as the FMM volume fraction of the O-LPCMO is more than three times larger than that of the R-LPCMO. This is consistent with the temperature-dependent magnetization measurement, which shows that the magnetization of the O-LPCMO remains more than three time higher than that of the R-LPCMO in the whole-temperature range below the Curie temperature (TC). The significantly higher MIT temperature in the O-LPCMO system can thus be easily understood by its much larger volume fraction of the FMM phase.
Figure 2. Transport and magnetic properties of O-LPCMO and R-LPCMO films.
(a) Temperature-dependent resistivity measurement at zero magnetic field. (b) Temperature-dependent magnetization measurement at 100 Gs. The insert shows the initial magnetization curves measured at 10 K after cooling from room temperature under zero magnetic field, indicating that O-LPCMO has much higher FMM volume fraction than that of the R-LPCMO.  and
and  , with blue arrow symbols indicating the Curie temperature and MIT temperature in bulk LPCMO.
Magnetic force microscopic studies
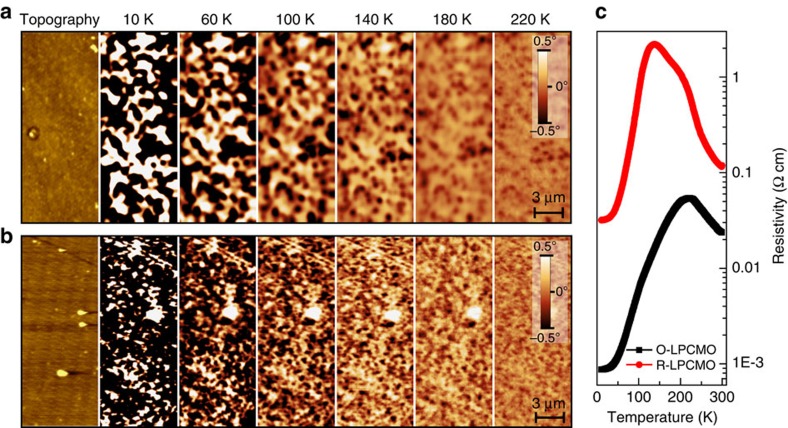
The greatly enhanced volume fraction of the FMM phase in the O-LPCMO system is confirmed by MFM imaging. Figure 3a,b shows the temperature-dependent MFM images acquired under 1 T field from the R-LPCMO and the O-LPCMO film, respectively. The areas with negative-phase signals are the ferromagnetic (FM) states, while the areas with zero-phase signal or positive-phase signals are antiferromagnetic (AFM) charge-ordered (CO) states, the imaging process and magnetic contrast inversion see Supplementary Fig. 6 and Supplementary Note 5. The atomic force microscope (AFM) morphological images of the two samples (from the same area as the MFM scan) are included, which clearly shows that the EPS-induced contrast in the MFM images are not correlated with the surface morphology. The corresponding R-T curves measured under 1 T field are shown in Fig. 3c for reference. Based on the MFM images, we can make a direct estimation of the volume fraction of the FMM phase and its temperature dependence. This is compared with the FMM volume fraction estimated from superconducting quantum interference device (SQUID) initial magnetization curves (Supplementary Fig. 7; Supplementary Note 6). In both MFM and SQUID measurements, the FMM volume fraction of the O-LPCMO is considerably larger than that of the R-LPCMO film. The slight difference between the MFM and SQUID data is caused by the different signal counting of these two methods. Because 1 T in-plane field does not fully align the magnetization of the FMM volume along the field direction, the SQUID data will underestimate the actual FMM volume fraction. The MFM measurement of the FMM volume fraction, however, is not affected by the anisotropy because the perpendicular components induced by the 1 T perpendicular field are adequate for MFM imaging.
Figure 3. MFM images of R-LPCMO and O-LPCMO.
Temperature-dependent MFM images of (a) R-LPCMO and (b) O-LPCMO under 1 T field cooling (the magnetic field was applied perpendicular to sample surface). Scanning areas are 7 × 14 μm. The negative signal indicates FMM state, while positive signal is AFM-CO state. The AFM morphological images are measured from the same area as the MFM scan. (c) Temperature-dependent resistivity measured under 1 T field cooling.
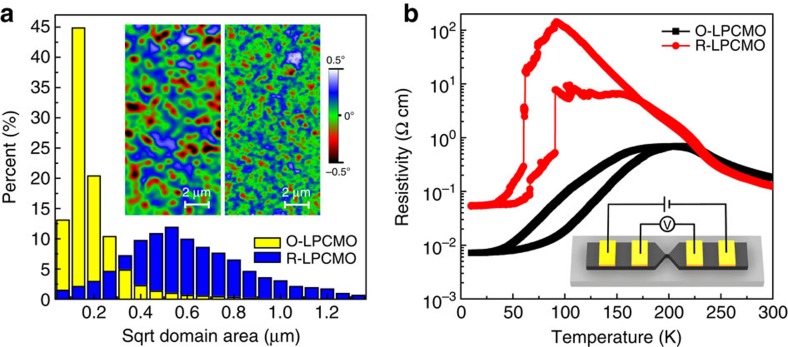
The most remarkable observation from the MFM study is the marked reduction of the domain size of the FMM phase in the O-LPCMO system. While the visual impression of this fact is already clear from the MFM images in Fig. 3, we make a quantitative comparison of the domain size of the R-LPCMO and the O-LPCMO films when they are in the vicinity of their corresponding MIT temperatures, that is, 140 and 220 K, respectively. We compare the FMM domain size at the same T/Tp rather than T/Tc, because it is hard to determine the domain size after percolation (or below MIT temperature) when most domains join together. Figure 4a shows the histogram of the size distribution of the FMM domains for the two films, with the inset showing the corresponding MFM images in colour scale (the details of domain size comparison at both 140 and 220 K can be found in Supplementary Fig. 8 and Supplementary Note 7). The average area per FMM domain is estimated to be ∼0.392 and ∼0.031 μm2 for the R-LPCMO and the O-LPCMO, respectively. While the FMM domains in the R-LPCMO film are in submicron scale as expected, the FMM domains of the O-LPCMO are significantly smaller.
Figure 4. Comparison of the FMM domain size.
(a) Histogram of FMM domain size distribution of O-LPCMO (yellow) and R-LPCMO (blue). The domain size was analysised from five images for both samples at each temperature. The scanning region is 20 × 20 μm for each image. Inset show MFM images (7 × 14 μm) of R-LPCMO at 140 K and O-LPCMO at 220 K under 1 T field. (b) Temperature-dependent resistivity of O-LPCMO strip (black) and R-LPCMO strip (red).
The transport data further confirm the difference in domain size of the two types of films. The Fig. 4b shows the R-T curves of the two films when they are fabricated into 1 μm wide strips using photolithography. The R-LPCMO strip exhibits distinct jumps from individual EPS domains due to the comparable size between the strip width and the EPS domain size, as known before46,47. In stark contrast, the O-LPCMO strip shows very smooth R-T curve because the individual domains are much smaller than the strip width and the MITs of individual EPS domains are thus smeared out.
Numerical simulations
We now turn to discuss the correlation between the ordering of Pr dopants with the size of EPS domains. Generally, in a clean limit system, the phase boundary of a first-order phase transition is ideally sharp, with an infinite large domain of FM or CO phase1,2,48. The disorder in real materials can make this phase boundary blurred, rendering coexisting FM plus CO clusters1. The size of coexisting cluster should be inversely proportional to the intensity of disorder2,48. However, in the current experiment, the size of cluster is smaller in Pr-ordered superlattice, which seems to be in opposite to theoretical expectation.
The disorder in manganites arises from the chemical difference among La3+, Pr3+ and Ca2+, which is twofold meaning. On one hand, the valence difference will directly affect the on-site potential (and thus electron occupancy) of neighbour Mn sites49,50. On the other hand, the ionic size mismatch will modulate the Mn–O–Mn bonds (thus the overlap of electronic waves). Although both effects can tune the physical properties, the first one should be the dominant one to govern the local disorder49,50, considering the strong Coulombic interaction. In contrast, the modulation of A-site size is mainly to tune the bandwidth1. In this sense, the physical difference between LPCMO film and LCMO/PCMO superlattice can be understood as the following. First, in both LCMO layers, PCMO layers and LPCMO film, the disorder due to valence and size differences between La3+ (or Pr3+) and Ca2+ always exist. Second, the average bandwidth is modulated: larger in LCMO; smaller in PCMO; between these two limits in LPCMO.
On the basis of this scenario, a numerical simulation is performed using the random field Ising model (RFIM)44, which can successfully describe the disorder driven phase separation in the phenomenological level. In the RFIM, the FMM and COI phases are mapped to spin-up and spin-down sites of an Ising lattice, respectively. Physically, the competition between exchanges and on-site potential contributed by several items (see the Methods section and Supplementary Note 8. for more details) determines the coexisting clusters.
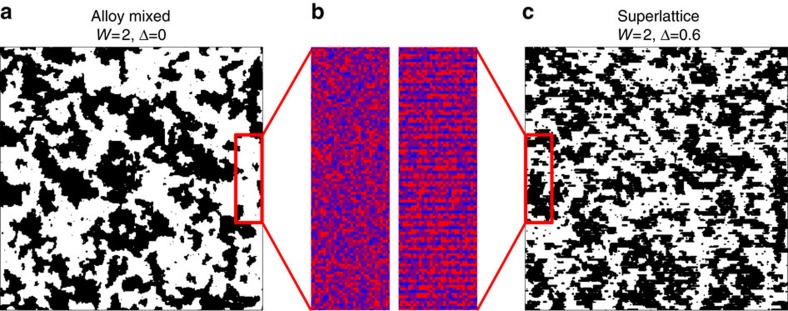
Here, a constant window for random potential is adopted for LPCMO and superlattice, implying that the intrinsic tendency for phase separation is identical in these two closely similar systems. This intrinsic disorder is mainly determined by the chemical disorder between La3+ (or Pr3+) and Ca2+, not between La3+ and Pr3+. Then the sole physical difference is attributed to the periodic modulation of bandwidth in the superlattice, namely the LCMO (PCMO) layers prefer ferromagnetic (charge ordered) phase locally, as its intrinsic properties.
Discussion
The typical simulation results are show in Fig. 5. First, the large coexisting clusters can be obtained using the RFIM, whose pattern looks qualitatively similar to the experimental MFM images. Second, the superlattice indeed exhibits relatively smaller ferromagnetic clusters than that of the Pr-random alloy case, in agreement with the experimental observation. In superlattice, the ordered modulation of random potential, that is, the ferromagnetic tendency is a little stronger in the LCMO layers but weaker in the PCMO layers, will suppress the large-scale phase separation, by preventing the free (random) growth of clusters.
Figure 5. Simulation of disorder-related phase separation.
(a) Alloy-mixture case. (c) Superlattice case. Black: ferromagnetic region; white: charge-ordered region. Here the concentrations of ferromagnetic phase are ∼45% for both cases, while the conclusion will not be altered when the concentrations changes. The superlattice one owns smaller clusters in general. (b) Magnified contour views of potential (Ri+Pi+h). The atomic-scale superlattice modulation (Pi) can be evidenced in the superlattice, but does not exist in the alloy-mixed case. This partially ordered random potential suppresses the growth of clusters.
To conclude, our results give strong indications that the random distribution of the dopants in complex oxides plays critical role in the physical appearance of EPS in these systems. Whether total ordering of chemical dopants would completely suppress the EPS in the LPCMO system; however, needs further study because the Ca dopants are still disordered in our superlattice system.
Methods
Sample preparation
The 60 nm [(LCMO)2/(PCMO)1]53 superlattices were grown on single crystal SrTiO3 (100) substrates by laser molecular beam epitaxy (ultraviolet laser in 248 nm, 2 J cm−2 fluence, 2 Hz) at 800 °C. The oxygen pressure was 3 × 10⁻³ torr, including 8% ozone. In situ reflection high-energy electron diffraction was used to monitor the unit by unit growth process. The samples were post annealed at 950 °C for 3 h in the oven with 1 atm oxygen after growth. For comparison, the conventional LPCMO thin films with the same nominal doping concentration have also been grown and characterized.
Device fabrication
The LPCMO stripes were fabricated by the conventional optical lithography and KI:HCl:H2O (1:1:1) wet etching. Au electrodes with Cr buffer layers were evaporated and patterned on the samples for transport measurements by electron beam lithography and lift-off technique.
MFM and transport measurements
MFM images and the transport measurements were carried out in Physical Property Measurement System with Scanning Probe Microscope (Quantum Design). Commercial Co/Cr-coated tips were used in the MFM dual pass mode with a lift height of 100 nm to subtract the morphology contribution from MFM signals. The MFM-phase signal of SrTiO3 (100) substrates was used as the zero base line so that the areas with negative signals could be identified as FMM regions.
XRD measurements
Synchrotron XRD measurements were carried out at beamline BL14B1 of Shanghai Synchrotron Radiation Facility at room temperature, using 10 keV X-rays (1.2389 Å).
Peak shift model
The X-ray diffraction intensity from the superlattice follows:
 |
where i, n are the indices for atoms and unit cells, respectively. Since  , one can rewrite equation 1 as
 |
where  . The first term
  is often called structure factor that determines the diffraction intensity; the second term
  normally determines the diffraction angle.
Model simulation
The Hamiltonian for RFIM is written as:
 |
where the first item is the standard exchange and the coefficient J is simply taken as the unit 1. The second one is the on-site potential energy with three components. Ri is a random number uniformly drawn from a region [−W, W]. Pi is an extra potential modulation in ordered superlattice, but not absent in the alloy-mixed case. Pi is set as Δ for LCMO layer but −2Δ for PCMO (to keep the average to be zero in the whole lattice). h is a uniform biased ‘field' to control the volume ratio of coexisting phases. The last two components (Pi and h) are appended to the original model used in ref. 44. A two-dimensional square L × L lattice (L=300) is adopted and the standard Markov Chain Monte Carlo method was performed to simulate the phase separation.
Additional information
How to cite this article: Zhu, Y. et al. Chemical ordering suppresses large-scale electronic phase separation in doped manganites. Nat. Commun. 7:11260 doi: 10.1038/ncomms11260 (2016).
Supplementary Material
Supplementary Figures 1-8, Supplementary Notes 1-8, Supplementary Table 1, and Supplementary References
Acknowledgments
We are especially thankful to R. Wu for valuable discussions. This work was supported by the National Basic Research Program of China (973 Program) under the grant nos. 2013CB932901 and 2014CB921104, National Natural Science Foundation of China (91121002, 11274071, 11504053 and 11274060) and Shanghai Municipal Natural Science Foundation (14JC1400500).
Footnotes
Author contributions Y.Z., K.D., K.Z. and H.L. prepared the samples; Y.Z., J.N. and J. Shao fabricated the device; Y.Z. H.L. and K.D. made the MFM images; Y.Z. and Y.K. made the magnetic and transport measurement; Y.Z., H.L., T.Y., X.G. and W.W. made the XRD measurement; Y.Z., X.X. and X.W. made the XRD analysis, S.D. designed the simulation model and L.L. performed the simulation; J. Shen guided the project; Y.Z., S.D., L.Y. and J. Shen analysed the data and wrote the paper.
References
- Tokura Y. Critical features of colossal magnetoresistive manganites. Rep. Prog. Phys. 69, 797–851 (2006). [Google Scholar]
- Dagotto E., Hotta T. & Moreo A. Colossal magnetoresistant materials: The key role of phase separation. Phys. Rep.-Rev. Sec. Phys. Lett. 344, 1–153 (2001). [Google Scholar]
- Prellier W., Lecoeur P. & Mercey B. Colossal-magnetoresistive manganite thin films. J. Phys.-Condes. Matter 13, 915–944 (2001). [Google Scholar]
- Murakami Y. et al. Ferromagnetic domain nucleation and growth in colossal magnetoresistive manganite. Nat. Nanotechnol.. 5, 37–41 (2010). [DOI] [PubMed] [Google Scholar]
- Lu D. H. et al. Electronic structure of the iron-based superconductor LaOFeP. Nature 455, 81–84 (2008). [DOI] [PubMed] [Google Scholar]
- Lang K. M. et al. Imaging the granular structure of high-Tc superconductivity in underdoped Bi2Sr2CaCu2O8+delta. Nature 415, 412–416 (2002). [DOI] [PubMed] [Google Scholar]
- Kamihara Y. et al. Iron-based layered superconductor: LaOFeP. J. Am. Chem. Soc. 128, 10012–10013 (2006). [DOI] [PubMed] [Google Scholar]
- Dai P. C., Hu J. P. & Dagotto E. Magnetism and its microscopic origin in iron-based high-temperature superconductors. Nat. Phys. 8, 709–718 (2012). [Google Scholar]
- Shen Z. X., Spicer W. E., King D. M., Dessau D. S. & Wells B. O. Photoemission studies of high-Tc superconductors: the superconducting gap. Science 267, 343–350 (1995). [DOI] [PubMed] [Google Scholar]
- Takahashi H. et al. Superconductivity at 43 K in an iron-based layered compound LaO1-xFxFeAs. Nature 453, 376–378 (2008). [DOI] [PubMed] [Google Scholar]
- Akahoshi D. et al. Random potential effect near the bicritical region in perovskite manganites as revealed by comparison with the ordered perovskite analogs. Phys. Rev. Lett. 90, 177203 (2003). [DOI] [PubMed] [Google Scholar]
- Aliev A. M., Gamzatov A. G., Batdalov A. B., Kalitka V. S. & Kaul A. R. Direct and inverse magnetocaloric effects in A-site ordered PrBaMn2O6 manganite. J. Alloy. Compd 509, 1–3 (2011). [Google Scholar]
- Gao Q. Q. et al. Spin glass behavior in A-site ordered YBaMn2O6 compound. J. Appl. Phys. 114, 053901 (2013). [Google Scholar]
- Nakajima T., Kageyama H. & Ueda Y. Dramatic change of magnetic property in the A-site ordered/disordered manganites PrBaMn2O6/Pr0.5Ba0.5MnO3. J. Magn. Magn. Mater. 272, 405–406 (2004). [Google Scholar]
- Truong K. D., Laverdiere J., Singh M. P., Jandl S. & Fournier P. Impact of Co/Mn cation ordering on phonon anomalies in La2CoMnO6 double perovskites: Raman spectroscopy. Phys. Rev. B 76, 132413 (2007). [Google Scholar]
- Trukhanov S. V. et al. Study of A-site ordered PrBaMn2O6-delta manganite properties depending on the treatment conditions. J. Phys.-Condes. Matter 17, 6495–6506 (2005). [Google Scholar]
- He Z. B., Tian H., Deng G. C., Xu Q. & Van Tendeloo G. Microstructure of bilayer manganite PrCa2Mn2O7 showing charge/orbital ordering. Appl. Phys. Lett. 102, 212902 (2013). [Google Scholar]
- Tang F. L. et al. Spin/orbital coupling and charge ordering in LaMnO3/SrMnO3 superlattice. J. Magn. Magn. Mater. 333, 8–12 (2013). [Google Scholar]
- Nelson-Cheeseman B. B. et al. Cation-ordering effects in the single layered manganite La2/3Sr4/3MnO4. Appl. Phys. Lett. 98, 072505 (2011). [Google Scholar]
- Belyea D. D., Santos T. S. & Miller C. W. Magnetocaloric effect in epitaxial La0.56Sr0.44MnO3 alloy and digital heterostructures. J. Appl. Phys. 111, 07A935 (2012). [Google Scholar]
- Koida T. et al. Effect of A-site cation ordering on the magnetoelectric properties in[(LaMnO3)(m)/(SrMnO3)(m)](n) artificial superlattices. Phys. Rev. B 66, 144418 (2002). [Google Scholar]
- Smadici S., Nelson-Cheeseman B. B., Bhattacharya A. & Abbamonte P. Interface ferromagnetism in a SrMnO3/LaMnO3 superlattice. Phys. Rev. B 86, 174427 (2012). [Google Scholar]
- Cao D. et al. Uniaxial strain-modulated conductivity in manganite superlattice (LaMnO3/SrMnO3). Appl. Phys. Lett. 98, 031910 (2011). [Google Scholar]
- Nanda B. R. K. & Satpathy S. Electronic and magnetic structure of the (LaMnO3)(2n)/(SrMnO3)(n) superlattices. Phys. Rev. B 79, 054428 (2009). [Google Scholar]
- May S. J. et al. Enhanced ordering temperatures in antiferromagnetic manganite superlattices. Nat. Mater. 8, 892–897 (2009). [DOI] [PubMed] [Google Scholar]
- Huhn S. et al. Modeling of colossal magnetoresistance in La0.67Ca0.33MnO3/Pr0.67Ca0.33MnO3 superlattices: Comparison with individual (La1-yPry)0.67Ca0.33MnO3 films. J. Appl. Phys. 113, 17D701 (2013). [Google Scholar]
- Moshnyaga V. et al. A-site ordering versus electronic inhomogeneity in colossally magnetoresistive manganite films. Phys. Rev. Lett. 97, 107205 (2006). [DOI] [PubMed] [Google Scholar]
- Loudon J. C., Mathur N. D. & Midgley P. A. Charge-ordered ferromagnetic phase in La0.5Ca0.5MnO3. Nature 420, 797–800 (2002). [DOI] [PubMed] [Google Scholar]
- Ghivelder L. & Parisi F. Dynamic phase separation in La5/8-yPryCa3/8MnO3. Phys. Rev. B 71, 184425 (2005). [Google Scholar]
- Ward T. Z. et al. Elastically driven anisotropic percolation in electronic phase-separated manganites. Nat. Phys. 5, 885–888 (2009). [Google Scholar]
- Yunoki S. et al. Phase separation in electronic models for manganites. Phys. Rev. Lett. 80, 845–848 (1998). [Google Scholar]
- Moreo A., Yunoki S. & Dagotto E. Phase separation scenario for manganese oxides and related materials. Science 283, 2034–2040 (1999). [DOI] [PubMed] [Google Scholar]
- Tao J. et al. Direct Imaging of nanoscale phase separation in La0.55Ca0.45MnO3: relationship to colossal magnetoresistance. Phys. Rev. Lett. 103, 097202 (2009). [DOI] [PubMed] [Google Scholar]
- Bibes M. et al. Nanoscale multiphase separation at La2/3Ca1/3MnO3/SrTiO3 interfaces. Phys. Rev. Lett. 87, 067210 (2001). [DOI] [PubMed] [Google Scholar]
- Dagotto E. Nanoscale Phase Separation and Colossal Magnetoresistance Springer (2003). [Google Scholar]
- Zhang L. W., Israel C., Biswas A., Greene R. L. & de Lozanne A. Direct observation of percolation in a manganite thin film. Science 298, 805–807 (2002). [DOI] [PubMed] [Google Scholar]
- Wu W. D. et al. Magnetic imaging of a supercooling glass transition in a weakly disordered ferromagnet. Nat. Mater. 5, 881–886 (2006). [DOI] [PubMed] [Google Scholar]
- Uehara M., Mori S., Chen C. H. & Cheong S. W. Percolative phase separation underlies colossal magnetoresistance in mixed-valent manganites. Nature 399, 560–563 (1999). [Google Scholar]
- Du K. et al. Visualization of a ferromagnetic metallic edge state in manganite strips. Nat. Commun. 6, 6179 (2015). [DOI] [PubMed] [Google Scholar]
- Milward G. C., Calderon M. J. & Littlewood P. B. Electronically soft phases in manganites. Nature 433, 607–610 (2005). [DOI] [PubMed] [Google Scholar]
- Burgy J., Moreo A. & Dagotto E. Relevance of cooperative lattice effects and stress fields in phase-separation theories for CMR manganites. Phys. Rev. Lett. 92, 097202 (2004). [DOI] [PubMed] [Google Scholar]
- Ahn K. H., Lookman T. & Bishop A. R. Strain-induced metal-insulator phase coexistence in perovskite manganites. Nature 428, 401–404 (2004). [DOI] [PubMed] [Google Scholar]
- Kim K. H., Uehara M., Hess C., Sharma P. A. & Cheong S. W. Thermal and electronic transport properties and two-phase mixtures in La5/8-xPrxCa3/8MnO3. Phys. Rev. Lett. 84, 2961–2964 (2000). [DOI] [PubMed] [Google Scholar]
- Moreo A., Mayr M., Feiguin A., Yunoki S. & Dagotto E. Giant cluster coexistence in doped manganites and other compounds. Phys. Rev. Lett. 84, 5568–5571 (2000). [DOI] [PubMed] [Google Scholar]
- Ma J. X., Gillaspie D. T., Plummer E. W. & Shen J. Visualization of localized holes in manganite thin films with atomic resolution. Phys. Rev. Lett. 95, 237210 (2005). [DOI] [PubMed] [Google Scholar]
- Zhai H. Y. et al. Giant discrete steps in metal-insulator transition in perovskite manganite wires. Phys. Rev. Lett. 97, 167201 (2006). [DOI] [PubMed] [Google Scholar]
- Ward T. Z. et al. Reemergent metal-insulator transitions in manganites exposed with spatial confinement. Phys. Rev. Lett. 100, 247204 (2008). [DOI] [PubMed] [Google Scholar]
- Dagotto E. Open questions in CMR manganites, relevance of clustered states and analogies with other compounds including the cuprates. New J. Phys. 7, 67 (2005). [Google Scholar]
- Bouzerar G. & Cepas O. Effect of correlated disorder on the magnetism of double exchange systems. Phys. Rev. B.. 76, 020401 (2007). [Google Scholar]
- Dong S. et al. Magnetism, conductivity, and orbital order in (LaMnO3)2n/(SrMnO3)n superlattices. Phys. Rev. B.. 78, 201102 (2008). [Google Scholar]
Associated Data
This section collects any data citations, data availability statements, or supplementary materials included in this article.
Supplementary Materials
Supplementary Figures 1-8, Supplementary Notes 1-8, Supplementary Table 1, and Supplementary References


