Abstract
Introduction
Chronic pancreatitis (CP) is an intractable and multi-factorial disorder. Developing appropriate animal models is an essential step in pancreatitis research, and the best ones are those which mimic the human disorder both aetiologically and pathophysiologically. The current study presents an optimised protocol for creating a murine model of CP, which mimics the initial steps of chronic pancreatitis in alcohol chronic pancreatitis and compares it with two other mouse models treated with cerulein or ethanol alone.
Material and methods
Thirty-two male C57BL/6 mice were randomly selected, divided into four groups, and treated intraperitoneally with saline (10 ml/kg, control group), ethanol (3 g/kg; 30% v/v), cerulein (50 µg/kg), or ethanol + cerulein, for six weeks. Histopathological and immunohistochemical assays for chronic pancreatitis index along with real-time PCR assessments for mRNA levels of inflammatory cytokines and fibrogenic markers were conducted to verify the CP induction.
Results
The results indicated that CP index (CPI) was significantly increased in ethanol-cerulein mice compared to the saline, ethanol, and cerulein groups (p < 0.001). Interleukin 1β (IL-1β), tumor necrosis factor α (TNF-α), transforming growth factor β (TGF-β), α-smooth muscle actin (α-SMA), and myeloperoxidase activity were also significantly greater in both cerulein and ethanol-cerulein groups than in the saline treated animals (p < 0.001). Immunohistochemical analysis revealed enhanced expression of TGF-β and α-SMA in ethanol-cerulein mice compared to the saline group.
Conclusions
Intraperitoneal (IP) injections of ethanol and cerulein could successfully induce CP in mice. IP injections of ethanol provide higher reproducibility compared to ethanol feeding. The model is simple, non-invasive, reproducible, and time-saving. Since the protocol mimics the initial phases of CP development in alcoholics, it can be used for investigating basic mechanisms and testing new therapies.
Keywords: mouse model, chronic pancreatitis, fibrosis, ethanol, cerulein
Introduction
Long-lasting or recurrent episodes of acute pancreatitis (AP) eventually leads to an intractable condition characterised by uneven fibrosis, acinar loss, and pancreatic insufficiency, called chronic pancreatitis (CP) [1]. Several varieties of CP have been characterised so far. Therefore, an aetiology-based terminology has been offered, namely alcohol chronic pancreatitis (ACP), hereditary chronic pancreatitis (HCP), autoimmune pancreatitis (AIP), obstructive chronic pancreatitis (OCP), and so on [2, 3]. Thus, CP is considered a heterogeneous and complex disorder with multiple entities. In all types, there is a progressive destruction of normal pancreatic tissue by persistent inflammation that causes irreversible morphologic changes [1, 4, 5].
Thanks to many in vivo and in vitro models, our understanding of the pathogenesis of chronic pancreatitis has significantly advanced in recent years [6]. However, their benefits to the patients have not matched the theoretical improvements [7, 8]. In trying to explain this discrepancy, a few causes have been proposed, including the heterogeneous and multifactorial nature of CP, as well as weak relevance of the used animal models to human disease [8, 9]. This awareness has prompted a forceful search for ideal and more relevant animal models.
Although ethanol abuse has been known as the main cause of CP, its pathogenesis remains elusive until now [10, 11]. Nearly 70% of CP cases are related to ethanol drinking, but less than 10% of heavy alcoholics develop CP [10]. The development of ACP is thought to be a multi-step process that starts with single episodes of AP, which progressively develop into a more chronic presentation with gradual loss of pancreatic function [12]. Since only a minority of heavy drinkers develop CP, ethanol has been regarded a predisposing factor; however, triggering factors play a key role in CP development. Therefore, for induction of CP in animals, this fact should be taken into account. Formerly presented animal models were established by ethanol feeding, repeated injections of cerulein or L-arginine, or direct injections of bile acids, oleic acid, or sodium taurocholate (NaTc) into the pancreatic duct [9, 13]. Ligation of the common bile duct or pancreatic duct have been used frequently [14–16]. It is validated that adding ethanol to other triggering factors, including cerulein, L-arginine bacterial, or viral infections worsens presentations of chronic pancreatitis, i.e. tissue fibrosis, inflammation, and acinar loss [9, 17]. The most widely used substance for induction of pancreatitis is cerulein, which is a cholecystokinin (CCK) analogue [18]. This decapeptide stimulates smooth muscles and increases digestive secretions [19].
Trying to find a clinically relevant mouse model, we tested most of the models presented thus far. Although each one has its strengths and weaknesses, some of them do not take into account the usual aetiology, and others are unable to produce distinctive pathological criteria of human CP. The time courses of several models are too short to induce CP [7, 8, 13].
The most widely used protocol for CP induction uses twice weekly treatments of cerulein for 10 weeks [20]. Although parenchymal fibrosis and CP criteria were prominently observed, this model did not take into account the natural pathobiology and aetiology of human CP, so its relevance to the human condition is under suspicion [8]. On the other hand, CP induction by ethanol alone does not seem feasible, being attributed to the absence of triggering factors [7, 21].
Consequently, we tried to find an optimised mouse model of chronic pancreatitis using intraperitoneal (IP) injections of ethanol and cerulein, aiming to imitate initial stages of CP development in ACP. After numerous preliminary studies we finally developed a simple, reproducible, time-saving, and clinically relevant CP mouse model that mimics the initial steps of ACP in humans. Herein, we present the optimised model and compare it with two other mouse models treated with cerulein or ethanol alone.
Material and methods
Pilot studies
To determine the toxic concentrations of ethanol, as well as the best route of ethanol administration, several preliminary studies were conducted. Different doses and concentrations of ethanol, as well as the route of ethanol administration (i.e. gavage vs. IP) were compared. The purpose of these preliminary studies was to determine the maximum concentrations and doses of ethanol that were not fatal during the experimentation. In addition, the goal of comparing gavage versus IP route of administration was the selection of the most reproducible route of ethanol administration that is also effective. The dose of cerulein was selected based on literature and our previous studies [20, 22].
Animals
A total of thirty-two male C57BL/6 mice, 20-23 g body weight, 6-7 weeks old, obtained from the Pasteur Institute (Tehran, Iran), were enrolled in the study. They were kept in customary cages, in a humidity-controlled situation, 23 ±2°C temperature, and 12-hour light/dark cycles. The mice were nourished with typical laboratory food and given unrestricted access to water. After one week of entrance, the mice were put into the experimentation. All studies were done in compliance with the Guide for the US National Institute of Health (NO 85-23, revised 1985) and approved by the Ethics Committee of Kurdistan University of Medical Sciences.
Experimental design and CP induction
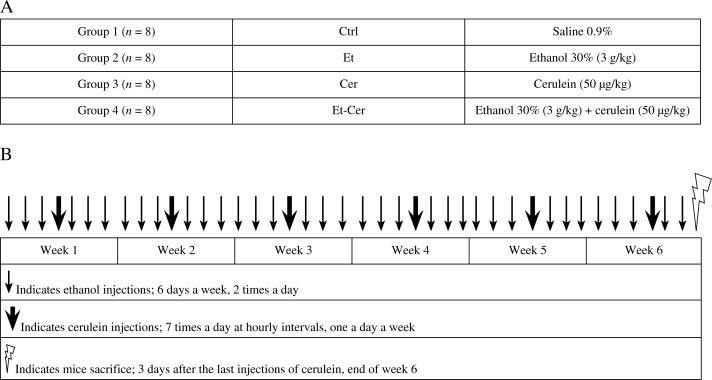
The research design and animal grouping are depicted in Fig. 1. In brief, the mice were randomly allocated into four groups (n = 8): control (Ctrl), ethanol (Et), cerulein (Cer), and ethanol-cerulein (Et-Cer), as presented in Diagram 1A. Et and Et-Cer mice received two intraperitoneal (IP) injections of 150 µl, i.e. 3 g/kg, 33% ethanol (at 8 a.m. and 8 p.m.), six days a week for six weeks. In addition, Et-Cer mice received seven IP injections of 50 µg/kg cerulein (Bachem, Torrance, USA) at hourly intervals, one day a week. The Ctrl group received the same number and amount of isotonic saline instead of cerulein and ethanol. The mice were sacrificed at the end of the sixth week.
Fig. 1.
Animal grouping and experimental design. (A) The mice were randomly allocated into 4 groups of 8 animals: control (Ctrl), ethanol (Et), cerulein (Cer), and ethanol + cerulein (Et-Cer). (B) Schematic flowcharts depict the experimental design and timing of liquid injections during 6 weeks of experimentation
Body weight measurement
Before launching the experimentation, at the end of each week and ahead of the final sacrifice, the body weights of all mice were recorded.
Blood collection
At the end of the sixth week all mice were anesthetised using a combination of Ketamine (100 mg/kg) and Xylazine (10 mg/kg). The animals were sacrificed by exsanguination through the cardiac puncture and killed by neck dislocation.
Biochemical assays
Levels of serum glucose, blood urea nitrogen (BUN) (mg/dl), aspartate aminotransferase (AST), alanine aminotransferase (ALT), alkaline phosphatase (ALP), amylase, and lipase (U/l) were determined using commercial kits (Pars Azmoon, Tehran, Iran) following the manufacturer's instructions, with a Hitachi 912 Chemistry Analyser (Roche Diagnostics, Indianapolis, USA).
Tissue preparation
Immediately after scarification the pancreas tissues were removed. One part was fixed in 10% buffered formalin for 24 hours, routinely processed, and embedded in paraffin. Serial paraffin sections of 4 µm thickness were prepared and stained with haematoxylin and eosin (H&E) and Masson trichrome (M-T) staining for histopathological examination according to standard procedures. Additional tissue sections were also prepared on poly-l-lysine-coated slides for immunohistochemical (IHC) staining of transforming growth factor β (TGF-β) and α-smooth muscle actin (α-SMA). The other parts were promptly frozen in liquid nitrogen and kept at −80°C for additional experimentation including RNA extraction, quantitative real-time PCR (qRT-PCR) analysis, and MPO assay [23].
Histopathological examination
CP induction was examined and classified using a semi-quantitative scoring system, according to the published criteria [24], by a skilled pathologist who was blinded to the samples’ identities (Table 1). Briefly, the chronic pancreatitis index (CPI) was expressed as a sum of scores regarding acinar loss, infiltration of inflammatory cells, and parenchymal fibrosis. Intensity of stromal fibrosis was ranked based on M-T staining. Acinar loss and infiltration of inflammatory cells were assessed on H&E-stained slides and MPO assay.
Table 1.
Histopathological scoring criteria for grading the severity of chronic pancreatitis
| Score | Infiltration of inflammatory cells/HPF† | Intensity of stromal fibrosis (%) | Extent of acinar loss (%) |
|---|---|---|---|
| 0 | < 5 | absent | absent |
| 1 | 5-50 | < 5 | < 10 |
| 2 | 50-100 | 5-15 | 10-30 |
| 3 | > 100 | > 15 | > 30 |
High-power field (magnification 400×)
Immunohistochemistry
Immunohistochemical (IHC) staining was performed using an Ultra Tek HRP, and anti-α-SMA (1: 200, Abcam, Cambridge, MA, USA) and TGF-β (1: 200, Santa Cruz Biotechnology, Santa Cruz, USA) antibodies, according to the producer's recommendations, as described previously [25]. In brief, 4-µm thick paraffin embedded sections were prepared from blocks, mounted on charged slides, and fixed for 1-2 hours at 65°C. The sections were deparaffinised in xylene and then rehydrated in graded ethanol solutions and washed two times in PBS for five minutes. After antigen recovery by heating at 95°C in citrate buffer (PH = 6) for 15 minutes, endogenous peroxidase was blocked by treatment of sections with 3% hydrogen peroxidase for 10 minutes. After blocking with 2% BSA for 10 minutes, the slides were incubated with either mouse monoclonal anti- -TGF-β antibody (1: 200), anti-α-SMA antibody (1: 200), or mouse isotype antibody (1: 100) diluted in antibody diluents (Dako, Glostrup, Denmark) overnight in a humid chamber at 4°C. Slides were washed and then incubated with anti-mouse biotinylated secondary antibody for 20 minutes, washed three times, and then incubated with HRP-conjugated streptavidin for 20 minutes. Slides were washed and treated with 3,3’-diaminobenzidine (DAB) chromogen for five minutes and counterstained with Mayer's haematoxylin and mounted. The slides were precisely observed by a skilled pathologist who was blinded to the protocol. The average of positive cells per five fields of each slide was reported as the mean ± SEM.
Quantitative reverse transcription-polymerase chain reaction (qRT-PCR)
Total RNA was extracted from pancreatic tissues using Pars Tous RNA extraction kit (Mashhad, Iran) according to the producer's instructions, as previously stated [26, 27]. In a total volume of 20 µl, 2 µg of extracted RNA of each sample was transcribed into cDNA using Pars Tous RT kit (Pars-Tous, Mashhad, Iran) with oligo(dT) primers. Synthesised cDNA samples were subjected to PCR amplification with mouse specific primers for TGF-β, α-SMA, IL-1β, TNF-α, and β2M for 40 cycles of amplifications in a Rotor-Gene 6000 real-time PCR system using SYBR-Green real-time PCR Master Mix (Sinaclon, Tehran, Iran). PCR products were electrophoresed on a 1.5% agarose gel, visualised with Erythrogel (Sinaclon, Tehran, Iran) under ultraviolet (UV) light using a UVitech gel Documentation System (UVItec Cambridge) and FireReader V4 software (UVItec Cambridge) [28]. Expression of mRNA of the genes of each sample was normalised to endogenous reference, β2-microglobulin. Relative changes in expression levels were calculated using the comparative Ct method by Pfaffl. Primer sequences for qPCR analysis and real-time PCR conditions are outlined in Table 2.
Table 2.
Oligonucleotide primer sequences and amplicon length
| mRNA | Primer sequences (5’ … 3’) | Length (bp) | |
|---|---|---|---|
| α-SMA (mouse) | Sense | CATGTGCTACCCTTAACTTG | 170 |
| Anti-sense | CTGTTGAAGTGATTGATGCC | ||
| TGF-β1 (mouse) | Sense | GCAACATGTGGAACTCTACC | 149 |
| Anti-sense | GTATTCCGTCTCCTTGGTTC | ||
| TNF-α (mouse) | Sense | GTCGTAGCAAACCACCAAG | 145 |
| Anti-sense | AGAGAACCTGGGAGTAGAC | ||
| IL-1β (mouse) | Sense | TGTTTTCCTCCTTGCCTCTG | 135 |
| Anti-sense | ACACGTTGACAGCTAGGTTC | ||
| β2M (mouse) | Sense | ACCCGCCTCACATTGAAATCC | 146 |
| Anti-sense | GGCGTATGTATCAGTCTCAGTG |
Statistical analysis
All statistical analysis was performed using SPSS v.16 (NY, USA). Results were expressed as means ± SEM. Differences between studied groups were evaluated using one-way analysis of variance (ANOVA) with Tukey's HSD Post-hoc test (Honest Significant Differences) test. Values of p < 0.05 were accepted as statistically significant.
Results
Pilot studies
After abundant preliminary studies and comparing different doses, concentrations, and routes of ethanol and cerulein administrations, six weeks treatments of ethanol and cerulein as depicted in Diagram 1B was chosen for CP induction (data of preliminary studies are not shown).
Body weights
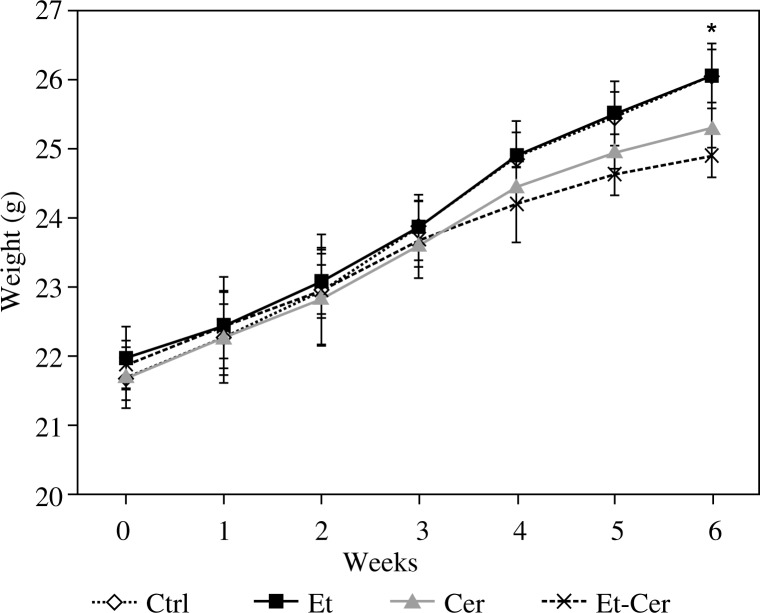
In order to examine if there are any decreases in body weight gain of mice, we compared the body weights of all mice before starting the experimentation, at the end of each week, and before final sacrifice of mice (Fig. 2). All treated groups (Et, Cer, and Et-Cer) gained weight at the same rate as the Ctrl group until the fourth week. After that, the weight gains were obviously higher in the Et and Ctrl mice compared to Cer and Et-Cer mice, but the differences were not significant until the sixth week, i.e. before the final sacrifice (p < 0.05).
Fig. 2.
Animals’ body weight during experimentation. One-way ANOVA showed significant differences in body weights between Et-Cer group compared to Ctrl mice only at the end of testing, i.e. 6th week (*p < 0.05). Error bars represent the standard error of the mean
Serum biochemical markers
To test the effects of treatments on liver, kidney, and pancreas we analysed serum levels of glucose, BUN, AST, ALT, amylase, and lipase. The obtained results revealed that there were no significant differences in serum glucose, BUN, AST, ALT, amylase, and lipase between the studied groups (p > 0.05); so the data are not shown.
Induction of chronic pancreatitis
Histopathological assessment
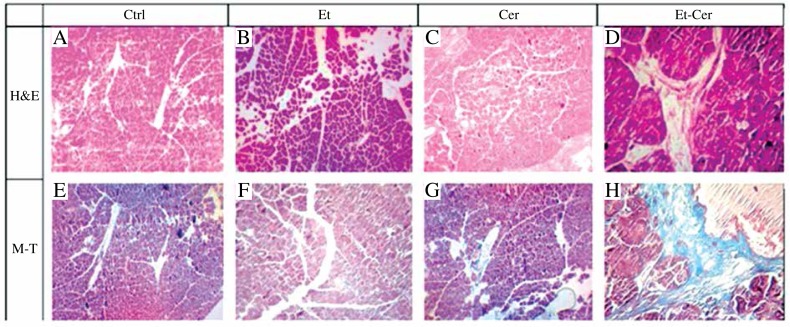
Haematoxylin and eosin staining of the pancreas tissues revealed profound acinar loss, infiltration of inflammatory cells, and parenchyma fibrosis in the Et-Cer group and to a lesser extent in the Cer group (Fig. 3A-D). Some other architectural changes including glandular atrophy, enlarged interstitial spaces, degeneration, and necrosis of epithelial cells were also observed in the Et-Cer and Cer groups. Tangible decrease in chronic pancreatitis development was observed in mice treated with Cer (Fig. 3C) compared to Et-Cer mice (Fig. 3D). Et and Ctrl mice did not show perceptible signs of chronic pancreatitis (Fig. 3A, B).
Fig. 3.
Representative light microscopic appearances of the pancreas stained with haematoxylin and eosin (A-D) and Masson trichrome (E-H) in the studied groups. A and B: Original magnification was 100× for all pictures except D and H (original magnification 400×)
Masson trichrome (M-T) staining of pancreas sections (Fig. 3E-H) showed extensive trichrome-positive staining (a marker of stromal fibrosis) in Et-Cer (Fig. 3H) and to a lesser extent in Cer (Fig. 3E) mice compared to Ctrl and Et groups (Fig. 3E, F). The pancreas tissues in Et and Ctrl mice showed faint positive trichrome staining in the parenchyma and interlobular fibro-connective tissues (Fig. 3E, F).
Chronic Pancreatitis Index
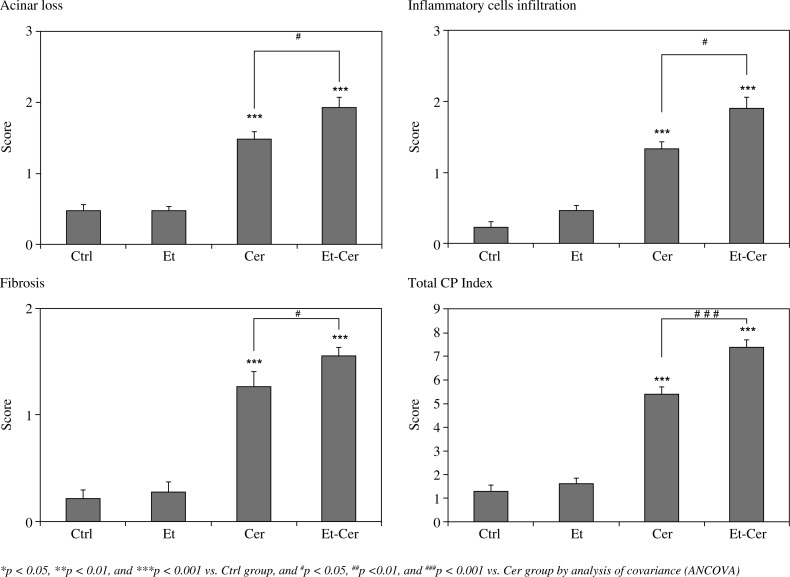
The severity of chronic pancreatitis was also semi-quantitatively investigated based on previously published CPI criteria [24] (Fig. 4). Cer and Et-Cer mice displayed a significant increase in CPI score compared to Ctrl and Et groups (p < 0.001). Interestingly CPI was significantly higher in Et-Cer mice compared to the Cer group (p < 0.001), displaying successful and more robust induction of CP by adding ethanol to cerulein treatments.
Fig. 4.
Histograms show histopathological changes of the pancreas tissues. Chronic pancreatitis index (CPI) points to sum of histopathological changes representative of chronic pancreatitis. Presented boxes and bars indicate mean ± SEM (n = 8)
Myeloperoxidase activity
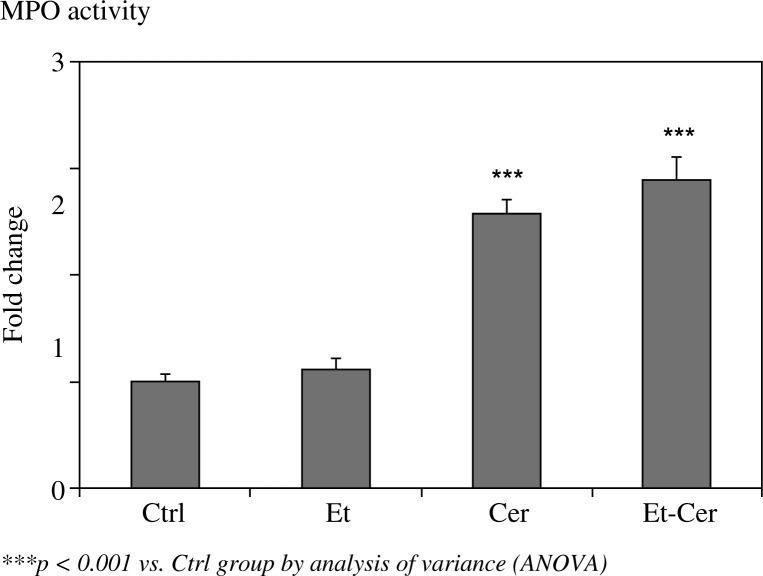
MPO activity was increased in Et-Cer and Cer mice compared to Ctrl (p < 0.001) (Fig. 5). There were no significant differences in MPO activity between Et and Ctrl mice (p = 0.941) and Et-Cer and Cer mice (p = 0.394).
Fig. 5.
Myeloperoxidase (MPO) activity as fold changes over Ctrl. Presented boxes and bars indicate mean ± SEM (n = 8)
Immunohistochemical analysis
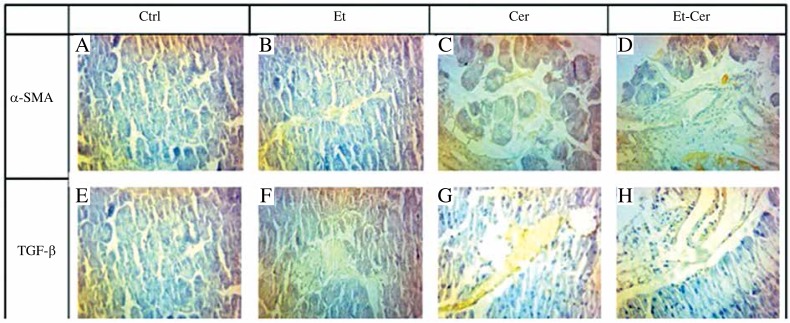
IHC staining for the possible expression of TGF-β and α-SMA in pancreas tissues of studied groups (Fig. 6) revealed a noticeable increase in expression of α-SMA, (Fig. 6A-D), and TGF-β (Fig. 6E-H), in Cer and Et-Cer mice compared to Ctrl and Et groups. Interestingly, more TGF-β- and α-SMA-positive areas were seen in Et-Cer mice compared to Cer group (Fig. 6C, D, G, and H).
Fig. 6.
Representative light microscopic appearances of the IHC stained sections for a-SMA (A-D) and TGF- (E-H) in studied groups. Original magnification was 400× for all pictures
Real-time PCR analyses
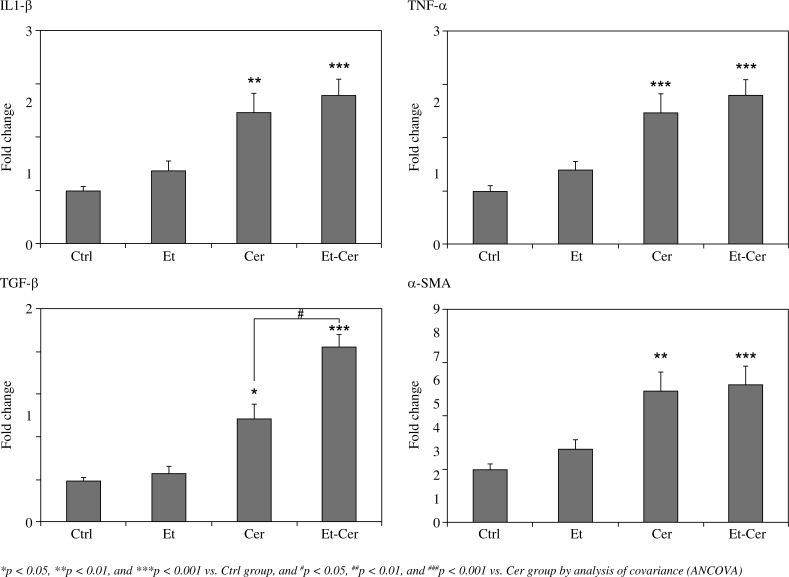
Quantitative real-time RT-PCR analyses (Fig. 7) showed that the expression of mRNA of inflammatory cytokines (IL-1β and TNF-α) were significantly increased in the pancreas tissue of Cer and Et-Cer mice compared to Ctrl (p < 0.05). As depicted in Fig. 7, these increases were higher in Et-Cer mice than in the Cer group, but they were not statistically significant (p = 0.80 and p = 97, respectively).
Fig. 7.
Expression of inflammatory (IL-1 and TNF-a), fibrogenic cytokines (TGF-), and the marker of activated pancreatic stellate cells (a-SMA) in the pancreata of studied groups by real-time RT-PCR analysis. Presented boxes and bars indicate mean ± SEM (n = 8)
The expression of TGF-β and α-SMA mRNA levels were also increased in Cer and Et-Cer mice compared to the Ctrl group (p < 0.05). Remarkably, more than a three-fold increase in the expression of TGF-β was observed in Et-Cer mice compared to Ctrl (p < 0.001). Moreover, the differences between the expression of TGF-β among Et-Cer and Cer mice were statistically significant (p = 0.014).
Discussion
Heavy alcohol drinking is the main aetiological factor related to CP [29]. As the exact pathophysiological mechanisms underlying ACP are not fully understood, there is a high demand for studies of the injurious effects of ethanol on the pancreas. Moreover, due to the anatomical location of the human pancreas and clinical concerns about obtaining tissue biopsies, our understanding regarding the pathogenesis of CP largely relies on animal models [6, 9].
To date, numerous CP animal models have been introduced. Even though each model has its own shortcomings, it can provide valuable information as well. Despite considerable efforts, few satisfactory and widely accepted models have been presented. The relevance of most of the models to human disease is under suspicion [8, 9, 13, 30]. On the other hand, as CP is a heterogeneous and multi-cause disorder, different animal models are recommended [31–33]. The first efforts to induce CP by only ethanol feeding were not successful [21, 34]. It is well known that ethanol predisposes the pancreas to injuries by other harmful agents [6, 35].
With the aim of reproducing the human disease, we optimised a new protocol to induce CP in mice. To the best of our knowledge, the protocol is unique. The authors believe that some shortcomings of the previously reported models of ACP have been dissolved. IP injections of ethanol (instead of feeding) noticeably increase the reproducibility and simplicity.
The results of histological, immunohistochemical, and gene expression assays revealed that adding ethanol to cerulein enhanced CP development more than was observed in mice that received cerulein alone. These results are in accordance with previously reported models of ethanol feeding alongside cerulein injections [7, 30, 36].
Real-time PCR and immunohistochemical analyses revealed that inflammatory cytokines including IL-1β and TNF-α, as well as TGF-β and α-SMA, contribute to the pathogenesis of CP and fibrogenesis process in the pancreas. Although the mechanism of fibrosis is poorly understood, current evidence suggests that TGF-β stimulates the process [37, 38]. It is known that TGF-β activates pancreas stellate cells (PSCs), which are thought to be the main cause of pancreatic fibrosis [39]. The activated PSCs secrete extracellular matrix (ECM) components such as type I collagen, fibronectin, laminin, and various matrix metalloproteinases (MMPs) [40]. It has been shown that α-SMA is a marker of activated PSCs [41]. Increased expression of TGF-β and α-SMA in cerulein and ethanol-cerulein mice, but not in the ethanol group, revealed the involvement of TGF-β signalling pathway in pancreatic fibrogenesis induced by cerulein. This observation has also been confirmed by pancreatic fibrosis in transgenic mice overexpressing TGF-β in islet cells [42]. Consistently, increased TGF-β expression has been observed in acinar cells adjacent to fibrotic regions in the pancreas of patients suffering from CP [43, 44]. Lack of significant differences in expression of inflammatory and fibrogenic cytokines between ethanol (Et) and saline (Ctrl) mice suggest diametrically opposed pathophysiological mechanisms in sensitising of the pancreas, by ethanol, to acute pancreatic injury.
Although the ethanol group did not show any pathological signs of CP, it can be used for investigating early effects of ethanol on the pancreas, i.e. pathophysiological mechanisms by which ethanol might either cause pancreatitis itself or sensitise the pancreas to injuries by other agents. As the reproducibility of ethanol administration by intraperitoneal injections is obviously higher than feeding or gavage, it seems superior [45].
Because MPO activity is an indicator of sequestration and infiltration of inflammatory cells to the tissue, its increase in Et-Cer and Cer mice confirmed the results of pathological and gene expression assays.
The model comprises six weeks of ethanol injections in order to sensitise the pancreas to acute pancreatic injury by six bouts of cerulein. All three main pathological criteria of human CP, including parenchyma fibrosis, loss of acinar cells, and infiltration of inflammatory cells, were observed in ethanol-cerulein mice, and to a lesser extent in cerulein mice, showing successful induction of CP in these two groups. Deposition of collagen was observed in interlobular and intralobular regions of the pancreatic parenchyma of these models. The pattern of cytokine expression, in both mRNA and protein levels, exposed an inflammatory and fibrogenic array. As these changes were not observed in ethanol mice, they were attributed to cerulein in addition to enhancement by ethanol. The results revealed higher sensitivity of pancreas to ethanol + cerulein, as seen in significantly increased CPI in ethanol-cerulein mice compared to the cerulein group.
The lack of pathological changes of CP in the ethanol group is in accordance with the fact that only a small portion of chronic alcoholics develop CP, and ethanol alone cannot be the sole aetiology of CP, i.e. ethanol is only part of the cause and predisposes the gland to other damaging agents [45, 46].
As the decrease in weight gain is a sign of CP, our results showed successful CP development with the combination of ethanol and cerulein. Our results were in accordance with the previous studies which showed that ethanol containing diets lead to CP only if combined with acute pancreatic injuries [1, 32].
Our findings provide some evidence of the pathophysiological mechanisms that are involved in the development of CP. We found that recurrent injections of cerulein (induction of AP), along with ethanol or without ethanol injections, led to increased expression of α-SMA, the key marker of pancreatic stellate cells (PSCs) activation. We also realised that, even in the absence of ethanol injection, repeated bouts of cerulein led to upregulated expression of TGF-β, the most powerful fibrogenic cytokine. These observations are in accordance with the previously reported ones by Perides et al. and Neuschwander-Tetri et al. in ethanol-dependent and independent mouse models, respectively [20, 36]. Perides et al. found that increased expression of TGF-β was only temporary when the mice were injected by repeated cerulein injections and had not been exposed to ethanol. They suggest that ethanol may contribute to the development of CP by sensitising the pancreas to AP injuries (i.e. by converting temporary changes into persistent changes) [36]. We, in accordance with their findings, found that α-SMA and TGF-β expression were upregulated and were more persistent in animals that received ethanol and cerulein compared with those that received cerulein injections alone. Our observations, in accordance with others, confirm the hypothesis that ethanol by itself cannot induce CP and pancreatic fibrosis [17, 35]. In detail, repetitive events of AP prompt mechanistic changes compatible with induction of CP, but these changes are temporary in the absence of ethanol [45, 46]. So, ethanol provides the milieu that the temporary changes convert into persistent ones. The precise pathophysiological mechanisms of these processes are obscure at present. Comparative molecular investigations using the three groups optimised in the present study may provide useful evidence in this context.
Recently it has been shown that many agents including parathyroid hormone-related protein may play a role in sensitising pancreatic cells to the effects of ethanol on the pancreas. These agents may induce a dose-dependent sensitisation of the pancreas in response to cholecystokinin or cerulein-mediated hyper-stimulation of acinar cells, leading to cell damage [46].
A literature review and our pilot studies guide us to the idea that CP may also be induced by frequent episodes of AP in the absence of ethanol [20, 47]. However, they cause merely temporary reversible alterations. On the other hand, when the episodes of AP superimpose on a contextual setting of chronically increased levels of ethanol and its metabolites in the blood, it leads to provocation of CP [47].
In summary, our optimised protocol could successfully induce chronic pancreatitis in C57BL/6 mice. Both models of CP showed specific and non-specific markers of the disorder. However, the pathological changes were more noticeable in the ethanol-dependent (ethanol-cerulein) group than the ethanol-independent group (cerulein). IP injections of ethanol in ethanol-cerulein mice appeared to stimulate fibrogenic responses that are provoked by repeated acute pancreatic injury.
Because our optimised murine model presents the full spectrum of pathological changes typical of CP and benefits from the natural aetiological process of CP induction in humans, it appears to be a reliable model of ethanol-dependent CP with strong clinical relevance. In spite of the typical limitations that murine models of CP have, our optimised model seems valuable and useful for future studies aimed at elucidating the pathophysiological mechanisms responsible for ACP. In addition, it seems applicable in genetically modified mouse strains.
The main limitation of the present model, as well as all other murine models, is the significant anatomical differences between human and mouse pancreases. Due to the short period of treatment such models are suitable for studying only the initial steps of CP development.
This work was supported by a research grant from the Cellular and Molecular Research Centre, Kurdistan University of Medical Sciences, Sanandaj, Iran. The authors would like to thank Dr. K. Hassanzadeh and Dr. M. Abdi for their guidance and friendship during the design of the study and experimentation. The authors declare that there are no conflicts of interest.
The authors declare no conflict of interest.
References
- 1.Brock C, Nielsen LM, Lelic D, et al. Pathophysiology of chronic pancreatitis. World J Gastroenterol. 2013;19:7231–7240. doi: 10.3748/wjg.v19.i42.7231. [DOI] [PMC free article] [PubMed] [Google Scholar]
- 2.Ahmed SA, Wray C, Rilo HL, et al. Chronic pancreatitis: recent advances and ongoing challenges. Curr Probl Surg. 2006;43:127–238. doi: 10.1067/j.cpsurg.2005.12.005. [DOI] [PubMed] [Google Scholar]
- 3.Ammann RW. Diagnosis and management of chronic pancreatitis: current knowledge. Swiss Medical Weekly. 2006;136:166–174. doi: 10.4414/smw.2006.11182. [DOI] [PubMed] [Google Scholar]
- 4.Behrman SW, Fowler ES. Pathophysiology of chronic pancreatitis. Surg Clin North Am. 2007;87:1309–1324. doi: 10.1016/j.suc.2007.09.001. [DOI] [PubMed] [Google Scholar]
- 5.Dong F, Chen QQ, Zhuang ZH, et al. Multiple gene mutations in patients with type 2 autoimmune pancreatitis and its clinical features. Cent Eur J Immunol. 2014;39:77–82. doi: 10.5114/ceji.2014.42129. [DOI] [PMC free article] [PubMed] [Google Scholar]
- 6.Siegmund SV, Haas S, Singer MV. Animal models and their results in gastrointestinal alcohol research. Dig Dis. 2005;23:181–194. doi: 10.1159/000090165. [DOI] [PubMed] [Google Scholar]
- 7.Lerch MM, Gorelick FS. Models of acute and chronic pancreatitis. Gastroenterology. 2013;144:1180–1193. doi: 10.1053/j.gastro.2012.12.043. [DOI] [PubMed] [Google Scholar]
- 8.Saluja AK, Dudeja V. Relevance of Animal Models of Pancreatic Cancer and Pancreatitis to Human Disease. Gastroenterology. 2013;144:1194–1198. doi: 10.1053/j.gastro.2013.01.070. [DOI] [PMC free article] [PubMed] [Google Scholar]
- 9.Otsuki M, Yamamoto M, Yamaguchi T. Animal models of chronic pancreatitis. Gastroenterol Res Pract. 2010;2010:403295. doi: 10.1155/2010/403295. [DOI] [PMC free article] [PubMed] [Google Scholar]
- 10.Olesen AE, Brokjaer A, Fisher IW, et al. Pharmacological challenges in chronic pancreatitis. World J Gastroenterol. 2013;19:7302–7307. doi: 10.3748/wjg.v19.i42.7302. [DOI] [PMC free article] [PubMed] [Google Scholar]
- 11.Clemens DL, Wells MA, Schneider KJ, et al. Molecular mechanisms of alcohol associated pancreatitis. World J Gastrointest Pathophysiol. 2014;5:147–157. doi: 10.4291/wjgp.v5.i3.147. [DOI] [PMC free article] [PubMed] [Google Scholar]
- 12.Witt H, Apte MV, Keim V, et al. Chronic pancreatitis: challenges and advances in pathogenesis, genetics, diagnosis, and therapy. Gastroenterology. 2007;132:1557–1573. doi: 10.1053/j.gastro.2007.03.001. [DOI] [PubMed] [Google Scholar]
- 13.Zhao JB, Liao DH, Nissen TD. Animal models of pancreatitis: can it be translated to human pain study? World J Gastroenterol. 2013;19:7222–7230. doi: 10.3748/wjg.v19.i42.7222. [DOI] [PMC free article] [PubMed] [Google Scholar]
- 14.Nepomnyashchikh LM, Lushnikova EL, Viskunov VG, et al. Ultrastructure of acinar cell injuries in experimental acute pancreatitis created by common bile duct ligation. Bull Exp Biol Med. 2011;150:747–752. doi: 10.1007/s10517-011-1240-0. [DOI] [PubMed] [Google Scholar]
- 15.Aghdassi AA, Mayerle J, Christochowitz S, et al. Animal models for investigating chronic pancreatitis. Fibrogenesis Tissue Repair. 2011;4:26. doi: 10.1186/1755-1536-4-26. [DOI] [PMC free article] [PubMed] [Google Scholar]
- 16.Moloudi MR, Hasanzadeh K, Rouhani S, et al. Effect of chloroformic extract of Cichorium intybus on liver function tests and serum level of TNF-α in obstructive cholestasis in rat. Scientific Journal of Kurdistan University of Medical Sciences. 2014;19:10–19. [Google Scholar]
- 17.Jerrells TR, Chapman N, Clemens DL. Animal model of alcoholic pancreatitis: role of viral infections. Pancreas. 2003;27:301–304. doi: 10.1097/00006676-200311000-00005. [DOI] [PubMed] [Google Scholar]
- 18.Elsasser HP, Haake T, Grimmig M, et al. Repetitive Cerulein-Induced Pancreatitis and Pancreatic Fibrosis in the Rat. Pancreas. 1992;7:385–390. doi: 10.1097/00006676-199205000-00017. [DOI] [PubMed] [Google Scholar]
- 19.Kim H. Cerulein Pancreatitis: Oxidative Stress, Inflammation, and Apoptosis. Gut and Liver. 2008;2:74–80. doi: 10.5009/gnl.2008.2.2.74. [DOI] [PMC free article] [PubMed] [Google Scholar]
- 20.Neuschwander-Tetri BA, Burton FR, Presti ME, et al. Repetitive self-limited acute pancreatitis induces pancreatic fibrogenesis in the mouse. Dig Dis Sci. 2000;45:665–674. doi: 10.1023/a:1005423122127. [DOI] [PubMed] [Google Scholar]
- 21.Kono H, Nakagami M, Rusyn I, et al. Development of an animal model of chronic alcohol-induced pancreatitis in the rat. Am J Physiol Gastrointest Liver Physiol. 2001;280:G1178–86. doi: 10.1152/ajpgi.2001.280.6.G1178. [DOI] [PubMed] [Google Scholar]
- 22.Fakhari S, Abdolmohammadi K, Panahi Y, et al. Glycyrrhizin attenuates tissue injury and reduces neutrophil accumulation in experimental acute pancreatitis. Int J Clin Exp Pathol. 2014;7:101–109. [PMC free article] [PubMed] [Google Scholar]
- 23.Hassanzadeh A, Shahvaisi K, Hassanzadeh K, et al. Effects of rebamipide and encapsulating rebamipide with chitosan capsule on inflammatory mediators in rat experimental colitis. Sci J Kurdistan Univ Med Sci. 2015;20:94–104. [Google Scholar]
- 24.Bai H, Chen X, Zhang L, et al. The effect of sulindac, a non-steroidal anti-inflammatory drug, attenuates inflammation and fibrosis in a mouse model of chronic pancreatitis. BMC Gastroenterol. 2012;12:115. doi: 10.1186/1471-230X-12-115. [DOI] [PMC free article] [PubMed] [Google Scholar]
- 25.Nikkhoo B, Jalili A, Fakhari S, et al. Nuclear pattern of CXCR4 expression is associated with a better overall survival in patients with gastric cancer. J Oncol. 2014;2014:808012. doi: 10.1155/2014/808012. [DOI] [PMC free article] [PubMed] [Google Scholar]
- 26.Shafie A, Moradi F, Izadpanah E, et al. Neuroprotection of donepezil against morphine-induced apoptosis is mediated through Toll-like receptors. Eur J Pharmacol. 2015;764:292–297. doi: 10.1016/j.ejphar.2015.07.027. [DOI] [PubMed] [Google Scholar]
- 27.Shirzad H, Bagheri N, Azadegan-Dehkordi F, et al. New insight to IL-23/IL-17 axis in Iranian infected adult patients with gastritis: effects of genes polymorphisms on expression of cytokines. Acta Gastroenterol Belg. 2015;78:212–218. [PubMed] [Google Scholar]
- 28.Ahmadi A, Zandi F, Gharib A, et al. Relationship between polymorphism in promoter region of E-Cadherin (Cdh1) gene and helicobacter pylori infection in Kurdish population of Iran. Life Sci J. 2013;10:552–556. [Google Scholar]
- 29.Vonlaufen A, Wilson JS, Pirola RC, et al. Role of alcohol metabolism in chronic pancreatitis. Alcohol Res Health. 2007;30:48–54. [PMC free article] [PubMed] [Google Scholar]
- 30.Sun Y, Xing GM, Bai J, et al. A New Mouse Model of Chronic Pancreatitis in C57BL/6J Strain That Mimics the Human Pathology. Pancreas. 2014;43:148–150. doi: 10.1097/MPA.0b013e318296991e. [DOI] [PubMed] [Google Scholar]
- 31.Wan MH, Huang W, Latawiec D, et al. Review of experimental animal models of biliary acute pancreatitis and recent advances in basic research. HPB (Oxford) 2012;14:73–81. doi: 10.1111/j.1477-2574.2011.00408.x. [DOI] [PMC free article] [PubMed] [Google Scholar]
- 32.Singh S, Kumar R, Choudhuri G, et al. Chronic pancreatitis: A new pathophysiology. Indian J Hum Genet. 2012;18:380–382. doi: 10.4103/0971-6866.108056. [DOI] [PMC free article] [PubMed] [Google Scholar]
- 33.Lysy PA, Weir GC, Bonner-Weir S. Concise review: pancreas regeneration: recent advances and perspectives. Stem Cells Transl Med. 2012;1:150–159. doi: 10.5966/sctm.2011-0025. [DOI] [PMC free article] [PubMed] [Google Scholar]
- 34.Haber P, Nakamura M, Tsuchimoto K, et al. Alcohol and the pancreas. Alcohol Clin Exp Res. 2001;25:244S–250S. doi: 10.1097/00000374-200105051-00039. [DOI] [PubMed] [Google Scholar]
- 35.Pandol SJ, Gukovsky I, Satoh A, et al. Animal and in vitro models of alcoholic pancreatitis: role of cholecystokinin. Pancreas. 2003;27:297–300. doi: 10.1097/00006676-200311000-00004. [DOI] [PubMed] [Google Scholar]
- 36.Perides G, Tao X, West N, et al. A mouse model of ethanol dependent pancreatic fibrosis. Gut. 2005;54:1461–1467. doi: 10.1136/gut.2004.062919. [DOI] [PMC free article] [PubMed] [Google Scholar]
- 37.Pohlers D, Brenmoehl J, Loffler I, et al. TGF-beta and fibrosis in different organs - molecular pathway imprints. Biochim Biophys Acta. 2009;1792:746–756. doi: 10.1016/j.bbadis.2009.06.004. [DOI] [PubMed] [Google Scholar]
- 38.Gordon KJ, Blobe GC. Role of transforming growth factor-beta superfamily signaling pathways in human disease. Biochim Biophys Acta. 2008;1782:197–228. doi: 10.1016/j.bbadis.2008.01.006. [DOI] [PubMed] [Google Scholar]
- 39.Omary MB, Lugea A, Lowe AW, et al. The pancreatic stellate cell: a star on the rise in pancreatic diseases. J Clin Invest. 2007;117:50–59. doi: 10.1172/JCI30082. [DOI] [PMC free article] [PubMed] [Google Scholar]
- 40.Tahara H, Sato K, Yamazaki Y, et al. Transforming growth factor-alpha activates pancreatic stellate cells and may be involved in matrix metalloproteinase-1 upregulation. Lab Invest. 2013;93:720–732. doi: 10.1038/labinvest.2013.59. [DOI] [PubMed] [Google Scholar]
- 41.Omary MB, Lugea A, Lowe AW, et al. The pancreatic stellate cell: a star on the rise in pancreatic diseases. J Clin Invest. 2007;117:50–59. doi: 10.1172/JCI30082. [DOI] [PMC free article] [PubMed] [Google Scholar]
- 42.Miralles F, Battelino T, Czernichow P, et al. TGF-beta plays a key role in morphogenesis of the pancreatic islets of Langerhans by controlling the activity of the matrix metalloproteinase MMP-2. J Cell Biol. 1998;143:827–836. doi: 10.1083/jcb.143.3.827. [DOI] [PMC free article] [PubMed] [Google Scholar]
- 43.Woods LT, Camden JM, El-Sayed FG, et al. Increased Expression of TGF-beta Signaling Components in a Mouse Model of Fibrosis Induced by Submandibular Gland Duct Ligation. PLoS One. 2015;10:e0123641. doi: 10.1371/journal.pone.0123641. [DOI] [PMC free article] [PubMed] [Google Scholar]
- 44.Lee H, Lim C, Lee J, et al. TGF-beta signaling preserves RECK expression in activated pancreatic stellate cells. J Cell Biochem. 2008;104:1065–1074. doi: 10.1002/jcb.21692. [DOI] [PubMed] [Google Scholar]
- 45.Schneider L, Dieckmann R, Hackert T, et al. Acute alcohol-induced pancreatic injury is similar with intravenous and intragastric routes of alcohol administration. Pancreas. 2014;43:69–74. doi: 10.1097/MPA.0b013e3182a85ad7. [DOI] [PubMed] [Google Scholar]
- 46.Falzon M, Bhatia V. Role of parathyroid hormone-related protein signaling in chronic pancreatitis. cancers (Basel) 2015;7:1091–1108. doi: 10.3390/cancers7020826. [DOI] [PMC free article] [PubMed] [Google Scholar]
- 47.Schneider KJ, Scheer M, Suhr M, et al. Ethanol administration impairs pancreatic repair after injury. Pancreas. 2012;41:1272–1279. doi: 10.1097/MPA.0b013e31824bde37. [DOI] [PMC free article] [PubMed] [Google Scholar]


