

Abstract
Gliomas represent approximately 30% of all central nervous system tumors and 80% of malignant brain tumors1. To understand the molecular mechanisms underlying the malignant progression of low-grade gliomas with mutations in IDH1 (encoding isocitrate dehydrogenase 1), we studied paired tumor samples from 41 patients, comparing higher-grade, progressed samples to their lower-grade counterparts. Integrated genomic analyses, including whole-exome sequencing and copy number, gene expression and DNA methylation profiling, demonstrated nonlinear clonal expansion of the original tumors and identified oncogenic pathways driving progression. These include activation of the MYC and RTK-RAS-PI3K pathways and upregulation of the FOXM1- and E2F2-mediated cell cycle transitions, as well as epigenetic silencing of developmental transcription factor genes bound by Polycomb repressive complex 2 in human embryonic stem cells. Our results not only provide mechanistic insight into the genetic and epigenetic mechanisms driving glioma progression but also identify inhibition of the bromodomain and extraterminal (BET) family as a potential therapeutic approach.
Gliomas have traditionally been classified into low-grade versus malignant, high-grade tumors on the basis of cellular density, nuclear atypia, mitotic index and presence of necrosis, defining pathological grades I through IV (ref. 2). Among these, grade IV glioma, or glioblastoma multiforme (GBM), remains one of the deadliest cancers, with median survival times of only 12.2 to 18.2 months3-5. Although most GBMs are primary and occur de novo, about 20% are secondary, arising through the progression of preexisting lower-grade gliomas of grade II or III (ref. 2). The genetic and epigenetic landscapes of grade II and III gliomas have been extensively studied6-8. Genetically, 80% harbor neomorphic IDH1 mutations affecting Arg132, which coexist either with TP53 and ATRX mutations along with chromosome 17p loss of heterozygosity (LOH) in astrocytic tumors or with CIC and FUBP1 mutations as well as chromosome 1p and 19q deletions in oligodendroglial tumors6-8. Epigenetically, IDH1-mutant gliomas exhibit a CpG island methylator phenotype (CIMP), characterized by increased global DNA methylation9. In the absence of effective treatments, most grade II and III gliomas eventually progress to more aggressive GBMs10.
To uncover the molecular mechanisms underlying the malignant transformation of gliomas, we first sequenced the exomes of 41 IDH1-mutant grade II and III gliomas (20 with matching blood DNA samples) obtained at initial diagnosis and their progressed counterparts collected up to 10 years later, reaching 154-fold coverage on average (Supplementary Fig. 1 and Supplementary Tables 1 and 2). We identified a median of 31 and 80 somatic protein-altering mutations in tumors with and without matching normal DNA samples, respectively. Overall, considering all 82 sequenced gliomas, we confirmed frequent mutations in several driver genes previously reported to be mutated in gliomas6-8 (Fig. 1a). We also identified NOTCH1 and NOTCH2 mutations, occurring within sequences encoding the EGF-like domains, consistent with inactivating mutations identified in squamous cell carcinomas6,11-14 (Fig. 1b). Interestingly, a highly conserved Phe357 residue in EGF-like domain 9 of NOTCH1, near the calcium-binding domain, was recurrently altered in four patients15 (Fig. 1b). Additionally, several target genes of NOTCH signaling were downregulated in NOTCH1- and NOTCH2-mutant tumors (Supplementary Fig. 2). Lastly, we identified new mutations in FAT receptor genes, including FAT1, FAT2 and FAT3 (Fig. 1a)16. Besides coding mutations, we also detected copy number alterations (CNAs), including 1p and 19q deletions in oligodendroglial tumors (q = 5.7 × 10⁻¹⁶ and 2.0 × 10⁻¹², respectively, two-sided Fisher’s exact test) and copy-neutral LOH at the TP53 locus on chromosome 17p (q = 1.4 × 10⁻⁷) in astrocytic tumors6-8 (Fig. 1c, d and Supplementary Fig. 3). Of note, deletion of the CDKN2A-CDKN2B tumor-suppressor locus (9p), despite being the most frequent CNA event, occurring in 44% of all tumors analyzed, did not show any enrichment within a particular glioma subtype (q = 0.6) (Fig. 1c, d and Supplementary Fig. 4). Similarly, amplification of the MYC oncogene (8q) (26%; q = 1.0) was observed in both subtypes (Fig. 1c, d and Supplementary Fig. 4).
Figure 1.
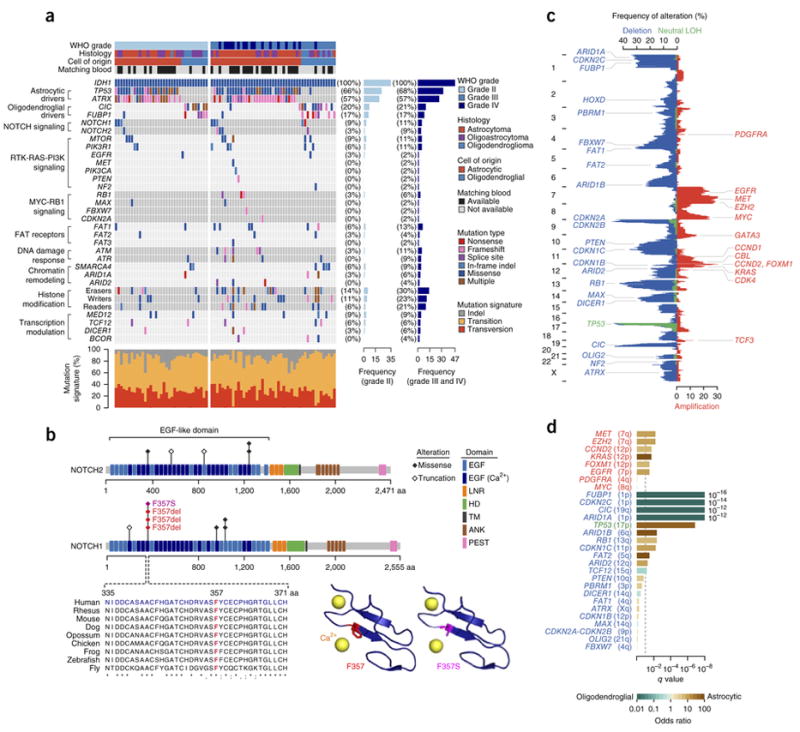
Genomic landscape of IDH1-mutant gliomas (n = 82 tumors). (a) Recurrently mutated genes. For PIK3R1, PIK3CA, EGFR, MET, NF2 and MAX, only data for known hotspot mutations are plotted. Recurrently mutated genes, which are grouped on the basis of molecular pathways, are shown on the left. Their mutation frequencies in grade II tumors and in grade III and IV tumors are shown on the right. Each tumor’s clinicopathological characteristics are shown at the top, and mutation signatures are indicated at the bottom. (b) Alterations encoded by recurrent mutations in the NOTCH1 and NOTCH2 genes. Protein domains and mutated residues are color-coded and depicted at the top. At the bottom left, multispecies conservation of the Phe357 mutation hotspot in EGF-like domain 9 is shown. At the bottom right, the Phe357 residue is mapped onto a crystal structure of NOTCH1 EGF-like domain 13 (Protein Data Bank (PDB), 2VJ3). The wild-type residue is shown in red, and the p.Phe357Ser missense alteration is shown in magenta. EGF, EGF-like domain; EGF (Ca2+), Ca2+-binding EGF-like domain; LNR, Lin12/Notch repeat; HD, heterodimerization domain; TM, transmembrane domain; ANK, ankyrin repeat; PEST, proline, glutamic acid, serine, threonine–rich degradation motif. (c) Overall pattern of CNAs. The vertical axis represents the genome. The horizontal axis indicates the frequency of chromosomal deletions (blue) or copy-neutral LOH events (green), as well as amplifications (red). Consensus cancer-related genes located within corresponding genomic regions are indicated. (d) Association of CNAs with cell of origin. The horizontal axis represents association significance, calculated using two-sided Fisher’s exact test. The dashed line corresponds to a q value of 0.1. The colored bars represent association odds ratios (green, enriched in oligodendroglial tumors; brown, enriched in astrocytic tumors).
Next, to identify genomic alterations that drive IDH1-mutant glioma progression, we compared progressed tumors with their corresponding lower-grade counterparts with respect to mutations and CNAs (Figs. 2 and 3). Excluding three hypermutated tumors, gliomas acquired a median of 21 protein-altering mutations as they progressed (Fig. 2a). Notably, although on average 27% of the mutations and 30% of the CNAs present in the initial tumors were no longer detected during progression, the recurrent IDH1 mutation affecting Arg132 was never lost during progression and remained clonal in all progressed tumors6,17 (Fig. 2 and Supplementary Fig. 5). Mutations acquired during progression also showed significantly different trinucleotide signatures from those that were lost (P = 0.05 and 1.0 × 10⁻⁵ for non-hypermutated and hypermutated samples, respectively, two-sided χ2 test) (Supplementary Fig. 6). Furthermore, during progression, 27% of the higher-grade gliomas acquired different coding mutations in the same glioma driver genes, such as TP53, ATRX, CIC and FUBP1, in which mutations were observed in their lower-grade counterparts6,17 (Fig. 2c and Supplementary Fig. 5). These findings suggest that genomic heterogeneity, which is known to occur in gliomas, has a substantial role during progression6,17. Although patients who underwent adjunct therapy after initial diagnosis, such as chemotherapy and/or radiation therapy, tended to acquire more mutations upon progression than patients who did not (P = 2.1 × 10⁻³, two-sided Wilcoxon rank-sum test), the patterns of CNAs remained the same (Supplementary Fig. 7).
Figure 2.

Patterns of nonlinear clonal evolution during glioma progression. (a) The number of protein-altering mutations and percentage of the genome with CNAs specific to the initial or progressed tumor are shown for all 41 patients. Alterations specific to progressed or initial tumors are shown in dark blue (above the horizontal axis) or in gray (below the horizontal axis), respectively. (b) Branched evolution of glioma driver genes during progression. Recurrently mutated driver genes are labeled along the horizontal axis. The vertical axis represents mutation recurrence. Mutations are colored according to whether they are specific to the initial, lower-grade tumor (gray) or the progressed, higher-grade tumor (dark blue) or are shared by the two (light blue). HM, histone modification. (c) Examples of branched clonal evolution during glioma progression. For each patient shown, CNAs in the initial and progressed tumors, as well as changes during progression, are indicated in the top panel (blue, deletion; red, amplification; green, copy-neutral LOH). Each point in the bottom panel represents a coding mutation. The horizontal and vertical axes represent estimated clonal frequency for each mutation (the fraction of tumor cells carrying the mutation) in the initial and progressed tumors, respectively. Oncogenic driver mutations are color-coded.
Figure 3.

Genomic changes during malignant progression of IDH1-mutant gliomas (n = 41 tumor pairs). (a) Genes that acquired mutations during progression, which are grouped according to molecular pathways, are shown on the left. Mutation frequencies are shown on the right. Each tumor’s clinicopathological characteristics are shown at the top. (b) Overall pattern of CNAs during malignant progression. The vertical axis represents the genome. The horizontal axis indicates the frequency of chromosomal deletions (blue), copy-neutral LOH events (green) and amplifications (red) during progression. Consensus cancer-related genes located within corresponding genomic regions are indicated. (c) Association of CNAs with glioma progression. The horizontal axis represents the significance of association, calculated using conditional logistic regression and likelihood-ratio test. The dashed line corresponds to a q value of 0.1.
During glioma progression, the receptor tyrosine kinase (RTK)-RAS–phosphoinositide 3-kinase (PI3K) pathway, the NOTCH pathway and FAT receptors were most frequently altered (in 22%, 12% and 10% of the patients, respectively) (Fig. 3a). Genes involved in epigenetic patterning, including histone modifiers and components of the SWI/SNF chromatin-remodeling complex (44% and 5%, respectively), as well as genes involved in transcriptional modulation (12%), were also mutated18-23 (Fig. 3a).
The most frequently amplified genomic region during progression was the MYC locus on chromosome 8q (22% of patients), and amplification was significantly associated with progression (q = 1.7 × 10⁻³, likelihood-ratio test) (Fig. 3b,c). We also observed additional genomic alterations that could potentially activate the MYC pathway, including deletions affecting the FBXW7 gene, a MYC suppressor located on chromosome 4q (29% of patients; q = 6.2 × 10⁻⁴), as well as the MAX gene, encoding a MYC-associated factor and tumor suppressor, located on 14q (24%; q = 9.5 × 10⁻⁴)24 (Fig. 3b,c). In addition to MYC-related loci, the FOXM1 gene locus on 12p was amplified in 20% of patients, and amplification was significantly associated with progression (q = 2.7 × 10⁻³) (Fig. 3b,c). The most commonly deleted region during progression was chromosome 9p, encompassing the CDKN2A-CDKN2B locus (61%; q = 1.1 × 10⁻⁷) (Fig. 3b,c). PTEN (10q) was also frequently deleted (39%), and deletion was associated strongly with tumor progression (q = 6.2 × 10⁻⁴) (Fig. 3b,c). Chromosome 10q deletion has previously been identified as a marker for poor prognosis in low-grade gliomas25. Finally, we observed deletions affecting the FAT receptor genes FAT1 (4q; 34%; q = 3.9 × 10⁻³) and FAT2 (5q; 29%; q = 6.8 × 10⁻⁴) (Fig. 3b,c).
To characterize transcriptional changes during progression, we compared the gene expression profiles of the progressed gliomas with the profiles of their corresponding initial tumors (n = 28 pairs) (Fig. 4). Gene set enrichment analysis (GSEA) as well as analysis of differential gene expression indicated that cell cycle processes, including the FOXM1 and E2F transcription factor networks and the MYC signaling pathway, were enriched (Fig. 4 and Supplementary Figs. 8 and 9). This finding is consistent with the observation that genomic loci harboring several pathway components were themselves altered through CNAs during progression (Fig. 3b,c). Among these pathways, both the FOXM1 and E2F networks have important roles in promoting G1/S cell cycle transition, with the former also being a key regulator of the G2/M transition, acting synergistically with MYC signaling26-32. Besides being a major determinant of mitotic cell fate and a transcriptional amplifier, MYC is also required for the maintenance of glioma stem cells32-36. Indeed, genes important for stem cell identity were upregulated during progression (Fig. 4). Differentially downregulated genes included genes that function in the neuronal system (q = 1.1 × 10⁻²⁴, hypergeometric test) and genes that are targets of Polycomb repressive complex 2 (PRC2) in human embryonic stem cells (hESCs) (q = 1.4 × 10⁻¹¹) (Fig. 4b).
Figure 4.

Gene expression during glioma progression (n = 28 tumor pairs). (a) GSEA of transcriptional changes during progression. Significantly enriched gene sets (empirical P < 0.05 and false discovery rate (FDR) < 0.05) are labeled and colored according to their normalized enrichment scores. (b) Differential gene expression during progression. A volcano plot comparing gene expression in progressed versus paired initial tumors is shown on the top. Significantly upregulated genes are colored in red, whereas significantly downregulated genes are colored in blue. q values were calculated using paired two-sided moderated Student’s t test. Functional enrichments of differentially expressed genes are shown at the bottom. Enrichment q values were calculated by hypergeometric test.
We next compared the DNA methylation profiles of progressed gliomas with the profiles of their corresponding initial tumors (n = 24 pairs), correlating methylation and gene expression changes (Fig. 5). Interestingly, whereas the overall methylation level decreased during progression (P = 2.6 × 10⁻³, paired two-sided Student’s t test), a small fraction (0.6%) of the 307,250 CpG sites measured became significantly hypermethylated (Fig. 5a and Supplementary Figs. 10 and 11). To understand the biological functions associated with these hypermethylated CpGs, we performed genomic region enrichment analysis, identifying enrichment for key developmental transcription factor families (q = 4.4 × 10−225, hypergeometric test), including homeotic genes in all four of the HOX clusters, as well as large subsets of the FOX, PAX, NKX, SOX, TALE, TALX and TBX family genes37 (Supplementary Fig. 12). These transcription factors regulate a wide variety of developmental processes, including pattern formation, cell fate specification and neurogenesis. In addition, hypermethylated CpGs were also enriched in promoters marked by histone H3 lysine 27 trimethylation (H3K27me3) in hESCs (q = 4.1 × 10−234, hyper-geometric test) as well as PRC2 targets in hESCs (q = 7.4 × 10−204) (Fig. 5a). Indeed, by aggregating Encyclopedia of DNA Elements (ENCODE) hESC H3K27me3 chromatin immunoprecipitation and sequencing (ChIP-seq) data, we observed enhanced H3K27me3 signal around CpGs that became hypermethylated during glioma progression38 (Fig. 5b). We obtained similar results using the ChIP-seq hESC data sets for EZH2 and SUZ12 (subunits of PRC2)38 (Fig. 5b). Notably, acquisition of DNA hypermethylation at PRC2 target genes in hESCs has been previously observed in colorectal, ovarian and breast cancers39-41.
Figure 5.

DNA methylation during glioma progression. (a) Differential DNA methylation during progression (n = 24 tumor pairs). A volcano plot comparing DNA methylation in progressed versus paired initial tumors is shown on the left. Significantly hypermethylated CpG sites are colored in magenta, whereas significantly hypomethylated CpG sites are colored in green. q values were calculated using paired two-sided moderated Student’s t test. Genomic region enrichment analysis of differentially methylated CpGs is shown on the right. Enrichment q values were calculated by hypergeometric test. Gene sets marked with an asterisk and colored in blue are enriched not only in hypermethylated CpGs but also in transcriptionally downregulated genes during progression. (b) Aggregation of hESC ChIP-seq signals around DNA methylation sites. Shown are average H3K27me3, EZH2 and SUZ12 ChIP-seq signals in hESCs near hypermethylated (magenta), hypomethylated (green) and remaining (gray) CpG sites during glioma progression. (c) Schematics depicting aberrant PRC2–DNA methyltransferases (DNMT) crosstalk during glioma progression. Me, methyl group. (d) Fold change in EZH2 expression during progression (n = 28 tumor pairs). The q value is from the differential gene expression analysis, calculated by paired two-sided moderated Student’s t test.
The observed changes in DNA methylation correlated with alterations in gene expression (Supplementary Fig. 13). Namely, PRC2 target genes in hESCs that became hypermethylated were also transcriptionally downregulated during progression (Figs. 4b and 5a, and Supplementary Fig. 13). When we restricted our analysis to CpGs located at promoter regions instead of considering all CpGs, we observed similar correlations (Supplementary Fig. 14).
In hESCs, PRC2 binds to the promoters of key developmental transcription factor genes and deposits repressive H3K27me3 marks, thereby maintaining stem cell identity41 (Fig. 5c). Our observations suggest that, during glioma progression, genes that are bound by PRC2 in hESCs become further hypermethylated, replacing reversible gene repression with permanent silencing, which in turn could ‘lock’ glioma cells into a perpetual state of self-renewal39-41 (Fig. 5c). Furthermore, in 65% of the patients, we also identified increased expression (log2 (fold change) >0.5) of the catalytic subunit of PRC2, EZH2 (q = 2 × 10⁻⁴, paired two-sided moderated Student’s t test) during progression (Fig. 5d). EZH2 is known to interact with DNA methyltransferases, associating with their aberrant activities in prostate cancer42,43.
By combining mutation, CNA, and gene expression and DNA methylation alteration data, we were able to uncover oncogenic pathways that drive glioma progression (Fig. 6a). The MYC signaling pathway became activated in 56% of the patients and showed one of the strongest associations with progression (q = 8.2 × 10⁻⁸, likelihood-ratio test) (Fig. 6a,b). As mentioned above, alterations in the individual MYC signaling components MYC, FBXW7 and MAX were each independently associated with progression (q < 1.0 × 10⁻³ for each) (Fig. 3b,c). Additionally, the RTK-RAS-PI3K pathway and FAT receptors were altered in 68% and 54% of the patients, respectively (q = 1.8 × 10⁻⁵ for both), regardless of whether patients had received adjunct treatment, except for a weak association of RTK-RAS-PI3K pathway activation with treatment (q = 0.05, Fisher’s exact test) (Fig. 6a,b and Supplementary Fig. 7). This observation suggests that alterations in these pathways are not driven by adjunct therapy but instead reflect genomic changes that underlie glioma progression. Downstream of the MYC and RTK-RAS-PI3K signaling pathways, genes involved in cell cycle regulation were altered in nearly all of the patients (88%; q = 1.6 × 10⁻⁹, likelihood-ratio test) (Fig. 6a,b). Further downstream, the FOXM1 and E2F2 networks were upregulated in 85% and 73% of the patients, respectively, promoting G2/M and G1/S transitions (Fig. 6a). Upregulation of EZH2, observed in 65% of patients, could also lead to aberrant crosstalk with DNA methyltransferases, which in turn is linked to hypermethylation of developmental transcription factors required for differentiation, as observed in 75% of patients, reprogramming glioma cells into an hESC-like state (Fig. 6a).
Figure 6.

Oncogenic networks during glioma progression and response to BET inhibition. (a) The oncogenic pathways driving glioma progression are summarized. Major functional pathways and their components affected by gene mutation, CNA, or alterations in RNA expression or DNA methylation are depicted. (b) Association of oncogenic pathways with glioma progression. The horizontal axis represents association significance, calculated using conditional logistic regression and likelihood-ratio test. The dashed line corresponds to a q value of 0.1. (c) Therapeutic inhibition of IDH1-mutant glioma cell growth. Shown are 72- or 120-h survival curves of patient-derived IDH1-mutant glioma primary cell cultures (TM-61 and TM-74) as well as an established cell line (TS-603) after treating with BET inhibitors or TMZ. All cells were treated with compounds for 72 h unless otherwise specified. Error bars represent s.e.m., calculated over four replicates per compound per dosage. BETi-JQ1, BET inhibitor JQ1; BETi-GS, BET inhibitor GS-626510; TMZ, temozolomide.
Having identified oncogenic pathways driving IDH1-mutant glioma progression and taking into account previous studies indicating the therapeutic potential of BET inhibition in primary GBMs, we tested the sensitivity of IDH1-mutant glioma cells to two BET inhibitors, the well-established JQ1 compound and GS-626510, a novel inhibitor44-47. Using six patient-derived IDH1-mutant primary glioma cultures, as well as a well-characterized IDH1-mutant glioma cell line, we observed high sensitivity of IDH1-mutant cells to both BET inhibitors in vitro, with half-maximal inhibitory concentration (IC50) values less than 250 nM and achieving maximum cell death of 31 to 77% (ref. 48) (Fig. 6c and Supplementary Table 3). Although previous studies have reported BET inhibition to target MYC signaling in hematopoietic malignancies, further studies will be needed to identify the exact therapeutic target of BET inhibition as well as the effectiveness of this inhibition in vivo in gliomas46,47,49.
In summary, through direct comparison of the genomic landscape of progressed gliomas with that of their corresponding lower-grade counterparts, we identified a plethora of convergent alterations, including activation of the MYC and RTK-RAS-PI3K signaling pathways, alterations in cell cycle regulators such as CDKN2A-CDKN2B, upregulation of the FOXM1- and E2F2-mediated cell cycle transitions, and epigenetic silencing of key developmental transcription factors. Overall, our observations suggest that these pathways converge upon opposing but synergistic cellular effects that stimulate proliferation while inhibiting differentiation during glioma progression. In addition to dissecting these fundamental molecular mechanisms underlying IDH1-mutant glioma malignant progression, our results further suggest BET inhibition as a potential therapeutic approach.
URLs
FASTX-Toolkit, http://hannonlab.cshl.edu/fastx_toolkit/; cutadapt, https://cutadapt.readthedocs.org/en/stable/; GRCh37 human reference genome, http://www.ncbi.nlm.nih.gov/projects/genome/assembly/grc/human/; Stampy, http://www.well.ox.ac.uk/project-stampy; Burrows-Wheeler Aligner (BWA), http://bio-bwa.sourceforge.net/; Picard tools, http://broadinstitute.github.io/picard/; Genome Analysis Toolkit (GATK), https://www.broadinstitute.org/gatk/; GATK best-practices pipeline, https://www.broadinstitute.org/gatk/guide/best-practices; Ensembl, http://useast.ensembl.org/index.html; Variant Effect Predictor (VEP), http://useast.ensembl.org/info/docs/tools/vep/index.html; ANNOVAR, http://annovar.openbioinformatics.org/en/latest/; 1000 Genomes Project, http://www.1000genomes.org/; Exome Variant Server, http://evs.gs.washington.edu/EVS/; Exome Aggregation Consortium database (ExAC), http://exac.broadinstitute.org/; Catalogue of Somatic Mutations in Cancer (COSMIC), http://cancer.sanger.ac.uk/cosmic/; Molecular Signature Database (MSigDB), http://www.broadinstitute.org/gsea/msigdb/index.jsp; Cytoscape, http://www.cytoscape.org/; ReactomeFI plugin, http://apps.cytoscape.org/apps/reactomefiplugin; Genomic Regions Enrichment of Annotations Tool (GREAT), http://great.stanford.edu/great/public/html/; ENCODE data portal, http://genome.ucsc.edu/ENCODE/index.html; Cis-Regulatory Element Annotation System (CEAS), http://liulab.dfci.harvard.edu/CEAS/; cBioPortal for Cancer Genomics, http://www.cbioportal.org/; R software, http://www.r-project.org/; DNAcopy R package, http://www.bioconductor.org/packages/release/bioc/html/DNAcopy.html; qpure R package, http://sourceforge.net/projects/qpure/; survival R package, https://cran.r-project.org/web/packages/survival/index.html; limma R package, http://master.bioconductor.org/packages/release/bioc/html/limma.html; sva R package, http://www.bioconductor.org/packages/release/bioc/html/sva.html; GSA R package, https://cran.r-project.org/web/packages/GSA/index.html; WGCNA R package, http://cran.r-project.org/web/packages/WGCNA/index.html; methylumi R package, http://www.bioconductor.org/packages/release/bioc/html/methylumi.html; beta-mixture quantile model (BMIQ), https://code.google.com/p/bmiq/downloads/detail?name=BMIQ.R; IMA R package, https://rforge.net/IMA/; drc R package, http://cran.r-project.org/web/packages/drc/index.html.
ONLINE METHODS
Tumor sample acquisition and quality control
Tumor samples and clinical information used in this study were obtained under informed consent and approval of the institutional review board of the University of Bonn Medical School, the University Hospital of Cologne and the Acibadem University School of Medicine. Clinical information is shown in Supplementary Table 1. All tumor samples were collected during surgical resection and were either snap frozen or formalin fixed and paraffin embedded. Sections stained with hematoxylin and eosin or formalin-fixed, paraffin-embedded tissues were reviewed again by neuropathologists at Yale University to confirm the clinical diagnosis and to assess percentage of tumor nuclei and percentage of necrosis. For samples with a low percentage of tumor nuclei or a high percentage of necrosis, tumor regions were isolated using laser-capture microdissection.
DNA, RNA and protein extraction
Frozen tissues were first homogenized using the QIAShredder (Qiagen, 79656). Tumor DNA, RNA and protein samples were subsequently extracted using the AllPrep DNA/RNA/Protein Mini kit (Qiagen, 80004). For formalin-fixed, paraffin-embedded tissues, tumor DNA was extracted using the BiOstic FFPE Tissue DNA Isolation kit (MO BIO Laboratories, 12250-50). Extracted DNA was repaired using BioLabs PreCR Repair Mix (New England BioLabs, M0309S) with human alkyladenine DNA glycosylase (hAAG) (New England BioLabs, M0313S). Repaired DNA was subsequently purified using the QIAquick Nucleotide Removal kit (Qiagen, 28304). Normal blood DNA samples were extracted from patient-matched peripheral blood mononuclear cells using the QIAamp DNA Blood Mini kit (Qiagen, 51104).
Whole-exome sequencing and mutation calling
Exome capture was performed using NimbleGen SeqCap EZ Human Exome Library v2.0 (Roche NimbleGen, 05860504001), following the manufacture’s protocol with modifications, as described previously50. The library was sequenced on Illumina HiSeq 2000 or 2500 instruments using 74-bp paired-end reads. Sequencing reads were evaluated using the FASTX-Toolkit and trimmed using cutadapt (version 1.2.1) to remove low-quality 3′-end bases and PCR primer–contaminated sequences51. Preprocessed paired-end reads were aligned to the human reference genome (GRCh37) using Stampy (version 1.0.21) in a hybrid mode with Burrows-Wheeler Aligner (BWA; version 0.5.9-r16)52,53. All aligned reads were subsequently processed using both the Picard suite (version 1.86) and the Genome Analysis Toolkit (GATK; version 2.5-2), including deduplication, alignment quality assessment, multisequence local realignment and base quality recalibration54. Quality control metrics are shown in Supplementary Table 2.
Mutation calling was performed using the GATK HaplotypeCaller tool for tumor samples with matching normal DNA samples and the UnifiedGenotyper tool for tumor samples without matching normal samples54. For blood-matched tumor samples, genotype likelihood–based somatic scores were also calculated55. Detected variants were annotated on the basis of Ensembl annotations (version 69) using Variant Effect Predictor (VEP; version 2.7)56. Variants were filtered on the basis of allelic and overall depths of coverage, strand bias, somatic score, mapping quality and coverage-adjusted variant quality, as well as location within repeat or segmental duplicated regions, as described previously57,58. Variants with overall alternate allele frequency >0.01 in the 1000 Genome Project database or in the National Heart, Lung, and Blood Institute (NHLBI) Exome Variant Server (ESP6500SI-V2) database were also excluded59. Variants detected in >4 individuals in the Exome Aggregation Consortium database (ExAC; release 0.3) or mapping to genes with >100 conserved alleles in an internal database of over 2,000 exomes were excluded as well. Additionally, consensus oncogenic genes and variants were identified on the basis of the Catalogue of Somatic Mutations in Cancer (COSMIC) database60. Lastly, for tumor samples without matched normal DNA samples, variants detected in >2 individuals in the ExAC database, unless also reported in the COSMIC database, were excluded60. All detected mutations are shown in Supplementary Table 4.
Validation of mutations identified by whole-exome sequencing
To confirm mutations identified by exome sequencing, we made use of either Sanger sequencing or high-throughput sequencing of the NimbleGen SeqCap EZ Comprehensive Cancer Design (Roche NimbleGen, 4000007080), which captures 578 cancer genes. High-throughput sequencing was performed on an Illumina HiSeq 2500 instrument, reaching 617-fold coverage on average. Read alignment and mutation calling were performed using the GATK ‘best-practices’ pipeline54,61. Detected mutations were annotated using ANNOVAR (version 2015Mar22)62. Sequencing quality control metrics as well as results are shown in Supplementary Tables 5 and 6. For Sanger sequencing, target genomic DNA encompassing mutations was PCR amplified. We also tested recurrent TERT promoter mutations in 16 tumor pairs6-8. Amplicons were cycle sequenced on Applied Biosystems 9800 Fast Thermal Cyclers and analyzed on an Applied Biosystems 3730xl DNA Analyzer. Primer sequences as well as the results of the Sanger sequencing are shown in Supplementary Table 7. The results of mutation validation are summarized in Supplementary Table 8.
Trinucleotide mutation signatures
Each single-nucleotide substitution was categorized into one of 96 possible trinucleotide mutations, C>A/G>T, C>G/G>C, C>T/G>A, T>A/A>T, T>C/A>G or T>G/A>C, taking into account the bases immediately 5′ and 3′ to each substitution. Patterns of trinucleotide signatures for mutations specific to progressed tumors were compared to those of mutations specific to initial tumors by two-sided χ2 test with 100,000 simulations.
Copy number analysis and tumor purity estimation
For all samples, the whole-exome sequencing read depth was calculated for each captured target region. For 43 glioma DNA samples and 15 blood DNA samples, genome-wide SNP array analysis was also performed using the HumanOmniExpress-24 v1.1 BeadChip (Illumina, WG-315-1101), following the manufacturer’s instructions. CNAs were detected on the basis of either sequencing depth estimates or SNP array signal intensities using circular binary segmentation (CBS) as implemented in the DNAcopy package in R. For each CNA segment, the minor allele frequency (MAF) was calculated to exclude false positive CNA events. On the basis of MAF within deleted chromosomal regions, tumor purity was also estimated using the qpure package in R (ref. 63). By chromosomal amplifications and deletions, we refer to copy number gains and losses, respectively, of any length and amplitude64. Lastly, consensus cancer-related genes within each CNA were identified on the basis of the COSMIC database60.
Validation of MYC copy number by genomic DNA quantitative PCR
MYC gene copy number was assessed in 24 randomly selected glioma samples by quantitative PCR (qPCR), using the Applied Biosystems 7900HT Fast Real-Time PCR System with iQ SYBR Green Supermix (Bio-Rad, 1708880). Copy number of the ZNF423 locus, a region with normal copy number, was assessed as well. Additionally, to determine the qPCR threshold cycle, copy number in female reference DNA (Promega, G1521) in four serial dilutions was also measured. All reactions were run in triplicate. For each sample, the copy number of MYC was calculated and normalized to that of ZNF423. Primer sequences and results are shown in Supplementary Figure 4c.
Mutation clonal frequency estimation
Each mutation’s clonal frequency—the fraction of tumor cells carrying the mutation—was estimated on the basis of its mutant allele frequency, taking into account the chromosomal copy number at the mutation site, as well as tumor purity, as described previously65. We considered a mutation to be specific to the progressed tumor if there were no mutant reads in the paired initial tumor and vice versa.
Association of gene alterations with cell of origin
Association of 28 recurrent CNAs with cell of origin was investigated by two-sided Fisher’s exact test. Multiple testing was corrected for using the Benjamini-Hochberg method; q < 0.1 was considered significant. In addition, we considered an event to be enriched in astrocytic tumors, as opposed to oligodendroglial ones, if the odds ratio was larger than 1 and vice versa.
Association of gene alterations with glioma progression
For 29 recurrent CNAs, we tested the statistical association of each with progression using conditional logistic regression, matching initial and progressed tumors from the same patient. Likelihood-ratio test P values were calculated using the clogit function in the survival package in R and were corrected for multiple testing using the Benjamini-Hochberg method; CNAs with q < 0.1 were considered significant66. Using a similar approach, we tested the association of pathways with progression, by first grouping 77 genes into ten categories on the basis of the pathways to which they belong.
Statistical relationships between gene alterations during glioma progression
We tested the statistical relationships among 42 genes altered through mutation and/or CNA during progression. The results are shown in Supplementary Figure 15.
Pairwise co-occurrence and mutual exclusivity
For every gene pair, we performed a Fisher’s exact test to discover co-occurring or mutually exclusive relationships. We tested for these relationships using genomic alterations acquired during progression. Gene pairs with nominal P < 0.05 were considered co-occurring or mutually exclusive and were excluded from the following bivariate conditional logistic regression analysis.
Two-gene models
For every gene pair, we tested whether one gene contributed independently to progression by conditioning on the other gene. Specifically, we performed bivariate conditional logistic regression without an interaction term. Likelihood-ratio test P values were calculated using the clogit function in R and were corrected for multiple testing using the Benjamini-Hochberg method66. For each gene pair, if both genes showed q < 0.1, we considered them to each independently contribute to progression, whereas, if only one gene showed q < 0.1, we considered this gene to have ‘masked’ the effect of the other gene.
Gene expression analysis
High-quality RNA (RNA integrity number (RIN) ≥7.5) from 62 exome-sequenced glioma samples (28 initial-progressed tumor pairs plus three initial and three progressed tumors) was used for gene expression array analysis, on the HumanHT-12 v4 Expression BeadChip (Illumina, BD-103-0204). Gene expression data were processed using the limma and sva packages in R, including background correction, quantile normalization and batch effect removal67,68. After excluding undetected microarray probes (detection P > 0.05 in over 90% of the samples), a total of 18,416 probes, representing 16,202 genes, remained.
Consensus clustering and multidimensional scaling
The top 1,000 probes showing large variation, as measured by standard deviation, across the data set were selected for consensus clustering and multidimensional scaling (MDS). Consensus clustering was performed using a hierarchical clustering method based on the Pearson correlation coefficients of the selected probes, using the ConsensusClusterPlus package in R (ref. 69). MDS was performed using the R command cmdscale on the Euclidean distances of the selected probes. The results are shown in Supplementary Figure 16.
Gene set enrichment analysis
GSEA was conducted using the GSA package in R with the Molecular Signatures Database (MSigDB; version 5.0) c2 gene set collection70,71. Empirical P values of enrichment were calculated by 100,000 gene set permutations70,71. FDRs were also estimated70,71.
Differential expression analysis
Differentially expressed genes were identified by comparing the expression profiles of 28 progressed tumors with the profiles of their corresponding initial tumors, using linear models and empirical Bayes methods, as implemented in the limma package in R (ref. 72). Gene significance was determined on the basis of logarithm of odds (LOD) scores, as well as P values calculated by paired two-sided moderated Student’s t test, corrected for multiple testing using the Benjamini-Hochberg method (Supplementary Table 9)72. Functional enrichment of differentially expressed genes was determined using the hypergeometric test in R with the MSigDB c2 gene sets70. Multiple testing was adjusted for using the Benjamini-Hochberg method. Gene interaction networks were constructed using the ReactomeFI plugin (version 4.1.1.beta) in Cytoscape (version 3.0.1)73,74. FDRs for identified interaction networks were also calculated using ReactomeFI73,74.
Co-expression network analysis
A co-expression network was constructed on the basis of the pairwise Pearson correlation coefficients of all genes, using the WGCNA package in R (ref. 75). Modules of highly correlated genes in gliomas were identified75. The first principal component of each module, also known as the module eigengene, was calculated75. Association of module eigengenes with glioma progression or with cell of origin was assessed using paired and unpaired two-sided Student’s t tests, respectively, to identify relevant gene clusters75. The results are shown in Supplementary Figure 17.
RT-qPCR validation of gene expression microarrays
RNA from eight randomly selected initial-progressed glioma pairs was reverse transcribed using SuperScript III Reverse Transcriptase (Thermo Fisher Scientific, 18080044). qPCR was performed using the Applied Biosystems 7900HT Fast Real-Time PCR System with iQ SYBR Green Supermix. Primer sequences are shown in Supplementary Table 10. Each primer pair had three technical replicates per tumor sample. Fold change in mRNA levels during progression was calculated and normalized to the level of ACTB. P values were calculated by two-sided Wilcoxon rank-sum test, with a null distribution of zero. The results are shown in Supplementary Figure 18.
DNA methylation analysis
Genome-wide DNA methylation profiling was performed on 48 glioma samples (24 initial-progressed tumor pairs) using the Infinium HumanMethylation450 BeadChip (Illumina, WG-314-1003). Generated raw intensity (idat) files were converted into R software–compatible format using the methylumi package76. DNA methylation sites with missing values, located within repeat regions or on sex chromosomes were excluded. Probes containing common SNPs were also filtered out, with a total of 307,250 probes retained. Methylation data were subsequently converted into β values, ranging from 0 (unmethylated) to 1 (fully methylated), and these values were normalized using a beta-mixture quantile normalization method (BMIQ)77.
Consensus clustering and multidimensional scaling
The top 12,000 most variable probes were selected and analyzed using the same methods as with gene expression data. The results are shown in Supplementary Figure 19.
Differential CpG methylation analysis
Differentially methylated CpGs were identified by comparing the methylation profiles of 24 progressed tumors with the profiles of their corresponding initial tumors, using the same methods as with differential gene expression analysis72,78. The results are shown in Supplementary Table 11. Analysis of functional enrichment of differentially methylated CpGs was performed using the Genomic Regions Enrichment of Annotations Tool (GREAT), taking all 307,250 methylation sites as the background37.
Analysis of differential promoter methylation
Promoter CpGs were defined as CpGs no more than 200 bp upstream of transcription start sites. For genes with more than one promoter CpG, mean β values were calculated78. The results are shown in Supplementary Table 12. Functional enrichment was determined using the MSigDB c2 gene sets, as with differential gene expression analysis70.
Gene-level correlation of promoter methylation with gene expression
For each gene, promoter methylation alterations during progression were correlated with downstream gene expression changes (n = 22 tumor pairs). Spearman’s correlation coefficients (ρ), as well as P values, were calculated. Multiple testing was adjusted for using the Benjamini-Hochberg method. The results are shown in Supplementary Figure 20.
Human embryonic stem cell ChIP-seq signal aggregation
hESC (H1-hESC) H3K27me3, EZH2 and SUZ12 ChIP-seq data (bigwig files) were downloaded from the ENCODE data portal38. Average ChIP-seq signals surrounding hypermethylated, hypomethylated and all remaining DNA methylation sites were calculated using the Cis-Regulatory Element Annotation System (CEAS)79.
Survival analysis of the TCGA cohort
Genetic and clinical data for grade II and III gliomas in The Cancer Genome Atlas (TCGA) cohort were accessed through the cBioPortal for Cancer Genomics7,80,81. Grade II and III gliomas carrying IDH1 mutations affecting Arg132 (n = 219) were selected. Using cBioPortal, we generated Kaplan-Meier curves, comparing overall survival rates in patients with and without genetic alterations of interest80,81. Log-rank test P values were also calculated80,81. The results are shown in Supplementary Figure 21.
Pharmacological inhibition of glioma cell growth
Glioma cultures were derived from tumor samples different from the whole exome–sequenced samples. This was because the paired tumors were obtained from international collaborators in Germany and Turkey, who collected the samples from 6 to 27 years ago. Because viable cultures could not be established from these patients, we instead derived glioma cell cultures from freshly resected glioma tissues at the Yale–New Haven Hospital. In addition, TS-603 and TS-667, previously established IDH1-mutant and wild-type glioma cell lines, respectively, were kindly provided by the laboratory of T.A.C. (ref. 48). Specifically, the TS-603 line was derived from a grade III oligodendoglioma, which harbored the IDH1 mutation encoding p.Arg132His, whereas the TS-667 line was derived from a primary GBM48. Both cell lines have been karyotyped, and their IDH1 mutation status was confirmed using Sanger sequencing. The cell lines have also tested negative for mycoplasma contamination. In summary, a total of seven IDH1-mutant glioma cell cultures and 13 cultures with wild-type IDH1 were tested for sensitivity to BET inhibition.
Cell culture
Glioma cells were treated with Accutase (EMD Millipore, SCR005) and triturated to generate single-cell suspensions. Cells were assessed for viability by Trypan blue exclusion and counted using the Countess automated cell counter (Thermo Fisher Scientific, C10227). Cells were grown either in medium containing 10% or 15% serum (DMEM/F-12 with 10% or 15% FBS and 1× penicillin-streptomycin) or in serum-free medium, which was composed of complete NS-A medium containing a mixture of NeuroCult NS-A basal medium (Stemcell Technologies, 05750) and proliferation supplement (Stemcell Technologies, 05753) at a 9:1 ratio, supplemented with 20 ng/ml recombinant human epidermal growth factor (EGF) (Stemcell Technologies, 02633), 10 ng/ml recombinant human basal fibroblast growth factor (bFGF) (Stemcell Technologies, 02634), 2 μg/ml heparin (Stemcell Technologies, 07980), 1× Antibiotic-Antimycotic (Thermo Fisher Scientific, 15240-062) and 2 μg/ml Plasmocin (Invivogen, ant-mpp)82.
Neurosphere formation assays
Glioma cells were seeded in 96-Well Clear Round-Bottom Ultra-Low-Attachment Microplates (Corning, 7007) at 500 to 2,000 cells per well. BET inhibitor or an equivalent volume of DMSO (0.025%) was added to each well. Final BET inhibitor concentrations ranged from 14 nM to 1.0 × 10⁴ nM. Microtiter plates were imaged, and the surface areas of neurosphere formation were assessed over 14 d using a CloneSelect Imager (Molecular Devices). Every 4–6 d, 50% of the medium was replaced. The results are shown in Supplementary Figure 22.
Cell viability and caspase activity assays
Glioma cells were seeded in 96-well microtiter plates at 2,000 cells per well in 135 μl of serum-free medium or medium containing 10% or 15% serum. After overnight incubation at 37 °C, serially diluted compounds or an equivalent volume of DMSO (0.025%) were added to the cells, resulting in a total volume of 150 μl per well. Final TMZ concentrations ranged from 2.0 × 10³ nM to 5.0 × 10⁵ nM, whereas JQ1 (BETi-JQ1) and GS-626510 (BETi-GS) concentrations ranged from 1.5 nM to 1.0 × 10⁴ nM. Each compound had four replicates per dose, whereas DMSO-only control had eight replicates. After incubation for 72 or 120 h at 37 °C, cell viability and caspase-3 and caspase-7 activities were assessed using the CellTiter-Glo Luminescent Cell Viability Assay (Promega, G7570) and the Caspase-Glo 3/7 Assay (Promega, G8090), respectively. Luminescence was measured using the GloMax-Multi Detection System (Promega, E7041). Measurements were normalized with respect to the average signal for DMSO-only control wells, which represented 100% viability or 100% caspase-3 and caspase-7 activity. Dose response curves were fitted using four-parameter log-logistic models with the drc package in R or with GraphPad Prism software (version 6.07)83. IC50 values were also calculated83. The results are shown in Supplementary Figure 23 and Supplementary Table 3.
Supplementary Material
Acknowledgments
We are grateful to the patients and their families for donating tissues for this research. This study was supported by the Gregory M. Kiez and Mehmet Kutman Foundation and the Yale University Department of Neurosurgery. Partial funding was provided through a research agreement between Gilead Sciences, Inc., and Yale University.
Footnotes
AUTHOR CONTRIBUTIONS
H.B., E.Z.E.-O., K.Y. and A.S.H. performed whole-exome sequencing analysis. H.B. and A.S.H. performed exome CNA, SNP array, DNA methylation array and ChIP-seq aggregation analyses. H.B., A.S.H. and K.Y. performed gene expression analysis. H.B. and E.Z.E.-O. performed tumor clonal evolution analysis. H.B. performed trinucleotide mutation signature and oncogenic network analyses. H.B. and K.Y. performed statistical association analysis. A.G.E.-S. and J.K. performed mutation validation. P.B.M. performed NOTCH1 structural analyses. M.S., B.K., M.B., M.N.P., K.Ö., J.S. and M.T. provided samples and clinical data. J.L. and A.O.V. conducted neuropathological evaluations. J.L., H.B., V.E.C. and G.C.-G. prepared samples. K.M.-G., L.S. and O.H. generated patient-derived glioma cultures. S.C., S.B.O., E.A.S., S.L.T. and Ş.T. conducted in vitro drug testing. H.B., S.C., S.B.O., E.A.S., S.L.T., Ş.T. and T.A.C. analyzed drug testing results. K.M.-G., S.A., L.D.K. and B.G. performed RT-qPCR. A.G.E.-S. performed genomic DNA qPCR. K.B. supervised genomic experiments. H.B., M.G., J.M. and A.L. wrote the manuscript, which was reviewed and edited by the other co-authors. M.G. designed and oversaw the project.
Accession codes.
Progression-specific mutations identified using whole-exome sequencing, as well as gene expression and DNA methylation microarray data, have been deposited in the European Genome-phenome Archive (EGA) under accession EGAS00001001588.
Note: Any Supplementary Information and Source Data files are available in the online version of the paper.
COMPETING FINANCIAL INTERESTS
The authors declare competing financial interests: details are available in the online version of the paper.
References
- 1.Ostrom QT, et al. CBTRUS statistical report: primary brain and central nervous system tumors diagnosed in the United States in 2007–2011. Neuro-oncol. 2014;16(suppl. 4):iv1–iv63. doi: 10.1093/neuonc/nou223. [DOI] [PMC free article] [PubMed] [Google Scholar]
- 2.Louis DN, et al. The 2007 WHO classification of tumours of the central nervous system. Acta Neuropathol. 2007;114:97–109. doi: 10.1007/s00401-007-0243-4. [DOI] [PMC free article] [PubMed] [Google Scholar]
- 3.Claus EB, Black PM. Survival rates and patterns of care for patients diagnosed with supratentorial low-grade gliomas. Cancer. 2006;106:1358–1363. doi: 10.1002/cncr.21733. [DOI] [PubMed] [Google Scholar]
- 4.Stupp R, et al. Radiotherapy plus concomitant and adjuvant temozolomide for glioblastoma. N Engl J Med. 2005;352:987–996. doi: 10.1056/NEJMoa043330. [DOI] [PubMed] [Google Scholar]
- 5.Stupp R, et al. Effects of radiotherapy with concomitant and adjuvant temozolomide versus radiotherapy alone on survival in glioblastoma in a randomised phase III study: 5-year analysis of the EORTC-NCIC trial. Lancet Oncol. 2009;10:459–466. doi: 10.1016/S1470-2045(09)70025-7. [DOI] [PubMed] [Google Scholar]
- 6.Suzuki H, et al. Mutational landscape and clonal architecture in grade II and III gliomas. Nat Genet. 2015;47:458–468. doi: 10.1038/ng.3273. [DOI] [PubMed] [Google Scholar]
- 7.Cancer Genome Atlas Research Network. Comprehensive, integrative genomic analysis of diffuse lower-grade gliomas. N Engl J Med. 2015;372:2481–2498. doi: 10.1056/NEJMoa1402121. [DOI] [PMC free article] [PubMed] [Google Scholar]
- 8.Eckel-Passow JE, et al. Glioma groups based on 1p/19q, IDH, and TERT promoter mutations in tumors. N Engl J Med. 2015;372:2499–2508. doi: 10.1056/NEJMoa1407279. [DOI] [PMC free article] [PubMed] [Google Scholar]
- 9.Turcan S, et al. IDH1 mutation is sufficient to establish the glioma hypermethylator phenotype. Nature. 2012;483:479–483. doi: 10.1038/nature10866. [DOI] [PMC free article] [PubMed] [Google Scholar]
- 10.Jaeckle KA, et al. Transformation of low grade glioma and correlation with outcome: an NCCTG database analysis. J Neurooncol. 2011;104:253–259. doi: 10.1007/s11060-010-0476-2. [DOI] [PMC free article] [PubMed] [Google Scholar]
- 11.Artavanis-Tsakonas S. Notch signaling: cell fate control and signal integration in development. Science. 1999;284:770–776. doi: 10.1126/science.284.5415.770. [DOI] [PubMed] [Google Scholar]
- 12.Stransky N, et al. The mutational landscape of head and neck squamous cell carcinoma. Science. 2011;333:1157–1160. doi: 10.1126/science.1208130. [DOI] [PMC free article] [PubMed] [Google Scholar]
- 13.Agrawal N, et al. Exome sequencing of head and neck squamous cell carcinoma reveals inactivating mutations in NOTCH1. Science. 2011;333:1154–1157. doi: 10.1126/science.1206923. [DOI] [PMC free article] [PubMed] [Google Scholar]
- 14.Pickering CR, et al. Mutational landscape of aggressive cutaneous squamous cell carcinoma. Clin Cancer Res. 2014;20:6582–6592. doi: 10.1158/1078-0432.CCR-14-1768. [DOI] [PMC free article] [PubMed] [Google Scholar]
- 15.Cordle J, et al. A conserved face of the Jagged/Serrate DSL domain is involved in Notch trans-activation and cis-inhibition. Nat Struct Mol Biol. 2008;15:849–857. doi: 10.1038/nsmb.1457. [DOI] [PMC free article] [PubMed] [Google Scholar]
- 16.Harvey KF, Zhang X, Thomas DM. The Hippo pathway and human cancer. Nat Rev Cancer. 2013;13:246–257. doi: 10.1038/nrc3458. [DOI] [PubMed] [Google Scholar]
- 17.Johnson BE, et al. Mutational analysis reveals the origin and therapy-driven evolution of recurrent glioma. Science. 2014;343:189–193. doi: 10.1126/science.1239947. [DOI] [PMC free article] [PubMed] [Google Scholar]
- 18.Mäkinen N, et al. MED12, the mediator complex subunit 12 gene, is mutated at high frequency in uterine leiomyomas. Science. 2011;334:252–255. doi: 10.1126/science.1208930. [DOI] [PubMed] [Google Scholar]
- 19.Barbieri CE, et al. Exome sequencing identifies recurrent SPOP, FOXA1 and MED12 mutations in prostate cancer. Nat Genet. 2012;44:685–689. doi: 10.1038/ng.2279. [DOI] [PMC free article] [PubMed] [Google Scholar]
- 20.Lim WK, et al. Exome sequencing identifies highly recurrent MED12 somatic mutations in breast fibroadenoma. Nat Genet. 2014;46:877–880. doi: 10.1038/ng.3037. [DOI] [PubMed] [Google Scholar]
- 21.Hill DA, et al. DICER1 mutations in familial pleuropulmonary blastoma. Science. 2009;325:965. doi: 10.1126/science.1174334. [DOI] [PMC free article] [PubMed] [Google Scholar]
- 22.Kumar MS, et al. Dicer1 functions as a haploinsufficient tumor suppressor. Genes Dev. 2009;23:2700–2704. doi: 10.1101/gad.1848209. [DOI] [PMC free article] [PubMed] [Google Scholar]
- 23.Labreche K, et al. TCF12 is mutated in anaplastic oligodendroglioma. Nat Commun. 2015;6:7207. doi: 10.1038/ncomms8207. [DOI] [PMC free article] [PubMed] [Google Scholar]
- 24.Comino-Méndez I, et al. Exome sequencing identifies MAX mutations as a cause of hereditary pheochromocytoma. Nat Genet. 2011;43:663–667. doi: 10.1038/ng.861. [DOI] [PubMed] [Google Scholar]
- 25.van Thuijl HF, et al. Spatial and temporal evolution of distal 10q deletion, a prognostically unfavorable event in diffuse low-grade gliomas. Genome Biol. 2014;15:471. doi: 10.1186/s13059-014-0471-6. [DOI] [PMC free article] [PubMed] [Google Scholar]
- 26.Laoukili J, Stahl M, Medema RH. FoxM1: at the crossroads of ageing and cancer. Biochim Biophys Acta. 2007;1775:92–102. doi: 10.1016/j.bbcan.2006.08.006. [DOI] [PubMed] [Google Scholar]
- 27.van den Boom J, et al. Characterization of gene expression profiles associated with glioma progression using oligonucleotide-based microarray analysis and real-time reverse transcription–polymerase chain reaction. Am J Pathol. 2003;163:1033–1043. doi: 10.1016/S0002-9440(10)63463-3. [DOI] [PMC free article] [PubMed] [Google Scholar]
- 28.Liu M, et al. FoxM1B is overexpressed in human glioblastomas and critically regulates the tumorigenicity of glioma cells. Cancer Res. 2006;66:3593–3602. doi: 10.1158/0008-5472.CAN-05-2912. [DOI] [PubMed] [Google Scholar]
- 29.Koo C-Y, Muir KW, Lam EWF. FOXM1: from cancer initiation to progression and treatment. Biochim Biophys Acta. 2012;1819:28–37. doi: 10.1016/j.bbagrm.2011.09.004. [DOI] [PubMed] [Google Scholar]
- 30.Wu L, et al. The E2F1–3 transcription factors are essential for cellular proliferation. Nature. 2001;414:457–462. doi: 10.1038/35106593. [DOI] [PubMed] [Google Scholar]
- 31.Hollern DP, Honeysett J, Cardiff RD, Andrechek ER. The E2F transcription factors regulate tumor development and metastasis in a mouse model of metastatic breast cancer. Mol Cell Biol. 2014;34:3229–3243. doi: 10.1128/MCB.00737-14. [DOI] [PMC free article] [PubMed] [Google Scholar]
- 32.Topham C, et al. MYC is a major determinant of mitotic cell fate. Cancer Cell. 2015;28:129–140. doi: 10.1016/j.ccell.2015.06.001. [DOI] [PMC free article] [PubMed] [Google Scholar]
- 33.Dang CV, et al. The c-Myc target gene network. Semin Cancer Biol. 2006;16:253–264. doi: 10.1016/j.semcancer.2006.07.014. [DOI] [PubMed] [Google Scholar]
- 34.Wang J, et al. c-Myc is required for maintenance of glioma cancer stem cells. PLoS ONE. 2008;3:e3769. doi: 10.1371/journal.pone.0003769. [DOI] [PMC free article] [PubMed] [Google Scholar]
- 35.Zheng H, et al. p53 and Pten control neural and glioma stem/progenitor cell renewal and differentiation. Nature. 2008;455:1129–1133. doi: 10.1038/nature07443. [DOI] [PMC free article] [PubMed] [Google Scholar]
- 36.Kim HS, et al. Gliomagenesis arising from Pten- and Ink4a/Arf-deficient neural progenitor cells is mediated by the p53-Fbxw7/Cdc4 pathway, which controls c-Myc. Cancer Res. 2012;72:6065–6075. doi: 10.1158/0008-5472.CAN-12-2594. [DOI] [PubMed] [Google Scholar]
- 37.McLean CY, et al. GREAT improves functional interpretation of cis-regulatory regions. Nat Biotechnol. 2010;28:495–501. doi: 10.1038/nbt.1630. [DOI] [PMC free article] [PubMed] [Google Scholar]
- 38.ENCODE Project Consortium. An integrated encyclopedia of DNA elements in the human genome. Nature. 2012;489:57–74. doi: 10.1038/nature11247. [DOI] [PMC free article] [PubMed] [Google Scholar]
- 39.Schlesinger Y, et al. Polycomb-mediated methylation on Lys27 of histone H3 pre-marks genes for de novo methylation in cancer. Nat Genet. 2007;39:232–236. doi: 10.1038/ng1950. [DOI] [PubMed] [Google Scholar]
- 40.Keshet I, et al. Evidence for an instructive mechanism of de novo methylation in cancer cells. Nat Genet. 2006;38:149–153. doi: 10.1038/ng1719. [DOI] [PubMed] [Google Scholar]
- 41.Cedar H, Bergman Y. Linking DNA methylation and histone modification: patterns and paradigms. Nat Rev Genet. 2009;10:295–304. doi: 10.1038/nrg2540. [DOI] [PubMed] [Google Scholar]
- 42.Viré E, et al. The Polycomb group protein EZH2 directly controls DNA methylation. Nature. 2006;439:871–874. doi: 10.1038/nature04431. [DOI] [PubMed] [Google Scholar]
- 43.Varambally S, et al. The polycomb group protein EZH2 is involved in progression of prostate cancer. Nature. 2002;419:624–629. doi: 10.1038/nature01075. [DOI] [PubMed] [Google Scholar]
- 44.Cheng Z, et al. Inhibition of BET bromodomain targets genetically diverse glioblastoma. Clin Cancer Res. 2013;19:1748–1759. doi: 10.1158/1078-0432.CCR-12-3066. [DOI] [PMC free article] [PubMed] [Google Scholar]
- 45.Pastori C, et al. BET bromodomain proteins are required for glioblastoma cell proliferation. Epigenetics. 2014;9:611–620. doi: 10.4161/epi.27906. [DOI] [PMC free article] [PubMed] [Google Scholar]
- 46.Shi J, Vakoc CR. The mechanisms behind the therapeutic activity of BET bromodomain inhibition. Mol Cell. 2014;54:728–736. doi: 10.1016/j.molcel.2014.05.016. [DOI] [PMC free article] [PubMed] [Google Scholar]
- 47.Filippakopoulos P, et al. Selective inhibition of BET bromodomains. Nature. 2010;468:1067–1073. doi: 10.1038/nature09504. [DOI] [PMC free article] [PubMed] [Google Scholar]
- 48.Rohle D, et al. An inhibitor of mutant IDH1 delays growth and promotes differentiation of glioma cells. Science. 2013;340:626–630. doi: 10.1126/science.1236062. [DOI] [PMC free article] [PubMed] [Google Scholar]
- 49.Mertz JA, et al. Targeting MYC dependence in cancer by inhibiting BET bromodomains. Proc Natl Acad Sci USA. 2011;108:16669–16674. doi: 10.1073/pnas.1108190108. [DOI] [PMC free article] [PubMed] [Google Scholar]
- 50.Bilgüvar K, et al. Whole-exome sequencing identifies recessive WDR62 mutations in severe brain malformations. Nature. 2010;467:207–210. doi: 10.1038/nature09327. [DOI] [PMC free article] [PubMed] [Google Scholar]
- 51.Martin M. Cutadapt removes adapter sequences from high-throughput sequencing reads. EMBnet.journal. 2011;17:10–12. [Google Scholar]
- 52.Lunter G, Goodson M. Stampy: a statistical algorithm for sensitive and fast mapping of Illumina sequence reads. Genome Res. 2011;21:936–939. doi: 10.1101/gr.111120.110. [DOI] [PMC free article] [PubMed] [Google Scholar]
- 53.Li H, Durbin R. Fast and accurate short read alignment with Burrows-Wheeler transform. Bioinformatics. 2009;25:1754–1760. doi: 10.1093/bioinformatics/btp324. [DOI] [PMC free article] [PubMed] [Google Scholar]
- 54.DePristo MA, et al. A framework for variation discovery and genotyping using next-generation DNA sequencing data. Nat Genet. 2011;43:491–498. doi: 10.1038/ng.806. [DOI] [PMC free article] [PubMed] [Google Scholar]
- 55.Li H. A statistical framework for SNP calling, mutation discovery, association mapping and population genetical parameter estimation from sequencing data. Bioinformatics. 2011;27:2987–2993. doi: 10.1093/bioinformatics/btr509. [DOI] [PMC free article] [PubMed] [Google Scholar]
- 56.McLaren W, et al. Deriving the consequences of genomic variants with the Ensembl API and SNP Effect Predictor. Bioinformatics. 2010;26:2069–2070. doi: 10.1093/bioinformatics/btq330. [DOI] [PMC free article] [PubMed] [Google Scholar]
- 57.Clark VE, et al. Genomic analysis of non-NF2 meningiomas reveals mutations in TRAF7, KLF4, AKT1, and SMO. Science. 2013;339:1077–1080. doi: 10.1126/science.1233009. [DOI] [PMC free article] [PubMed] [Google Scholar]
- 58.Erson-Omay EZ, et al. Somatic POLE mutations cause an ultramutated giant cell high-grade glioma subtype with better prognosis. Neuro-oncol. 2015;17:1356–1364. doi: 10.1093/neuonc/nov027. [DOI] [PMC free article] [PubMed] [Google Scholar]
- 59.1000 Genomes Project Consortium. An integrated map of genetic variation from 1,092 human genomes. Nature. 2012;491:56–65. doi: 10.1038/nature11632. [DOI] [PMC free article] [PubMed] [Google Scholar]
- 60.Forbes SA, et al. COSMIC: mining complete cancer genomes in the Catalogue of Somatic Mutations in Cancer. Nucleic Acids Res. 2011;39:D945–D950. doi: 10.1093/nar/gkq929. [DOI] [PMC free article] [PubMed] [Google Scholar]
- 61.Van der Auwera GA, et al. From FastQ data to high confidence variant calls: the Genome Analysis Toolkit best practices pipeline. Curr Protoc Bioinformatics. 2013;11:11.10.1–11.10.33. doi: 10.1002/0471250953.bi1110s43. [DOI] [PMC free article] [PubMed] [Google Scholar]
- 62.Wang K, Li M, Hakonarson H. ANNOVAR: functional annotation of genetic variants from high-throughput sequencing data. Nucleic Acids Res. 2010;38:e164. doi: 10.1093/nar/gkq603. [DOI] [PMC free article] [PubMed] [Google Scholar]
- 63.Song S, et al. qpure: a tool to estimate tumor cellularity from genome-wide single-nucleotide polymorphism profiles. PLoS ONE. 2012;7:e45835. doi: 10.1371/journal.pone.0045835. [DOI] [PMC free article] [PubMed] [Google Scholar]
- 64.Zack TI, et al. Pan-cancer patterns of somatic copy number alteration. Nat Genet. 2013;45:1134–1140. doi: 10.1038/ng.2760. [DOI] [PMC free article] [PubMed] [Google Scholar]
- 65.Bolli N, et al. Heterogeneity of genomic evolution and mutational profiles in multiple myeloma. Nat Commun. 2014;5:2997. doi: 10.1038/ncomms3997. [DOI] [PMC free article] [PubMed] [Google Scholar]
- 66.Therneau TM, Grambsch PM. Modeling Survival Data: Extending the Cox Model. Springer Science & Business Media; 2000. [Google Scholar]
- 67.Shi W, Oshlack A, Smyth GK. Optimizing the noise versus bias trade-off for Illumina whole genome expression BeadChips. Nucleic Acids Res. 2010;38:e204. doi: 10.1093/nar/gkq871. [DOI] [PMC free article] [PubMed] [Google Scholar]
- 68.Leek JT, Johnson WE, Parker HS, Jaffe AE, Storey JD. The sva package for removing batch effects and other unwanted variation in high-throughput experiments. Bioinformatics. 2012;28:882–883. doi: 10.1093/bioinformatics/bts034. [DOI] [PMC free article] [PubMed] [Google Scholar]
- 69.Wilkerson MD, Hayes DN. ConsensusClusterPlus: a class discovery tool with confidence assessments and item tracking. Bioinformatics. 2010;26:1572–1573. doi: 10.1093/bioinformatics/btq170. [DOI] [PMC free article] [PubMed] [Google Scholar]
- 70.Subramanian A, et al. Gene set enrichment analysis: a knowledge-based approach for interpreting genome-wide expression profiles. Proc Natl Acad Sci USA. 2005;102:15545–15550. doi: 10.1073/pnas.0506580102. [DOI] [PMC free article] [PubMed] [Google Scholar]
- 71.Efron B, Tibshirani R. On testing the significance of sets of genes. Ann Appl Stat. 2007;1:107–129. [Google Scholar]
- 72.Smyth GK. Linear models and empirical Bayes methods for assessing differential expression in microarray experiments. Stat Appl Genet Mol Biol. 2004;3 doi: 10.2202/1544-6115.1027. Article3. [DOI] [PubMed] [Google Scholar]
- 73.Croft D, et al. Reactome: a database of reactions, pathways and biological processes. Nucleic Acids Res. 2011;39:D691–D697. doi: 10.1093/nar/gkq1018. [DOI] [PMC free article] [PubMed] [Google Scholar]
- 74.Saito R, et al. A travel guide to Cytoscape plugins. Nat Methods. 2012;9:1069–1076. doi: 10.1038/nmeth.2212. [DOI] [PMC free article] [PubMed] [Google Scholar]
- 75.Langfelder P, Horvath S. WGCNA: an R package for weighted correlation network analysis. BMC. Bioinformatics. 2008;9:559. doi: 10.1186/1471-2105-9-559. [DOI] [PMC free article] [PubMed] [Google Scholar]
- 76.Triche TJ, Weisenberger DJ, Van Den Berg D, Laird PW, Siegmund KD. Low-level processing of Illumina Infinium DNA Methylation BeadArrays. Nucleic Acids Res. 2013;41:e90. doi: 10.1093/nar/gkt090. [DOI] [PMC free article] [PubMed] [Google Scholar]
- 77.Teschendorff AE, et al. A beta-mixture quantile normalization method for correcting probe design bias in Illumina Infinium 450 k DNA methylation data. Bioinformatics. 2013;29:189–196. doi: 10.1093/bioinformatics/bts680. [DOI] [PMC free article] [PubMed] [Google Scholar]
- 78.Wang D, et al. IMA: an R package for high-throughput analysis of Illumina’s 450K Infinium methylation data. Bioinformatics. 2012;28:729–730. doi: 10.1093/bioinformatics/bts013. [DOI] [PMC free article] [PubMed] [Google Scholar]
- 79.Shin H, Liu T, Manrai AK, Liu XS. CEAS: cis-regulatory element annotation system. Bioinformatics. 2009;25:2605–2606. doi: 10.1093/bioinformatics/btp479. [DOI] [PubMed] [Google Scholar]
- 80.Gao J, et al. Integrative analysis of complex cancer genomics and clinical profiles using the cBioPortal. Sci Signal. 2013;6:pl1. doi: 10.1126/scisignal.2004088. [DOI] [PMC free article] [PubMed] [Google Scholar]
- 81.Cerami E, et al. The cBio Cancer Genomics Portal: an open platform for exploring multidimensional cancer genomics data. Cancer Discov. 2012;2:401–404. doi: 10.1158/2159-8290.CD-12-0095. [DOI] [PMC free article] [PubMed] [Google Scholar]
- 82.Azari H, et al. Isolation and expansion of human glioblastoma multiforme tumor cells using the neurosphere assay. J Vis Exp. 2011;56:e3633. doi: 10.3791/3633. [DOI] [PMC free article] [PubMed] [Google Scholar]
- 83.Ritz C, Streibig JC. Bioassay analysis using R. J Stat Softw. 2005;12:1–22. [Google Scholar]
Associated Data
This section collects any data citations, data availability statements, or supplementary materials included in this article.