

Abstract
Background
The objective of this study was to explore the role of miR-199a-5p in the development of thyroid cancer, including its anti-proliferation effect and downstream signaling pathway.
Material/Methods
We conducted qRT-PCR analysis to detect the expressions of several microRNAs in 42 follicular thyroid carcinoma patients and 42 controls. We identified CTGF as target of miR-491, and viability and cell cycle status were determined in FTC-133 cells transfected with CTGF siRNA, miR-199a mimics, or inhibitors.
Results
We identified an underexpression of miR-199a-5p in follicular thyroid carcinoma tissue samples compared with controls. Then we confirmed CTGF as a target of miR-199a-5p thyroid cells by using informatics analysis and luciferase reporter assay. Additionally, we found that mRNA and protein expression levels of CTGF were both clearly higher in malignant tissues than in benign tissues. miR-199a-5p mimics and CTGF siRNA similarly downregulated the expression of CTGF, and reduced the viability of FTC-133 cells by arresting the cell cycle in G0 phase. Transfection of miR-199a-5p inhibitors increased the expression of CTGF and promoted the viability of the cells by increasing the fraction of cells in G2/M and S phases.
Conclusions
Our study proves that the CTGF gene is a target of miR-199a-5p, demonstrating the negatively related association between CTGF and miR-199a. These findings suggest that miR-199a-5p might be a novel therapeutic target in the treatment of follicular thyroid carcinoma.
MeSH Keywords: Adenocarcinoma, Follicular; Cell Cycle; Connective Tissue Growth Factor; MicroRNAs
Background
Thyroid nodules are found in up to 7% of the adult population [1]. Although the majority of the nodules are benign, thyroid gland malignant tumor is the most common malignancy of the endocrine system [2]. Follicular thyroid carcinomas are the most common types of thyroid malignancies, after papillary carcinoma [3]. These tumors represent a diagnostic challenge, especially in a preoperative setting in which common histological criteria for malignancy, such as capsular penetration or vascular invasion, cannot be assessed [4]. Therefore, most fine-needle aspiration biopsies (FNABs) from follicular carcinoma nodules are diagnosed as indeterminate by cytological evaluation, hindering patient management. Genetic alterations such as mutations in RAS genes and PAX8/PPAR are known to occur in follicular carcinomas, and they have been introduced into clinical practice to facilitate accurate preoperative and postoperative diagnosis [5–7]. However, approximately 30% of all follicular carcinomas do not harbor any known mutations [8,9]. Therefore, a discovery of additional molecular markers can be useful for improvement of diagnosis in these tumors.
MicroRNAs (miRNA) is a class of endogenous noncoding small RNAs, consisting of 19 to 23 nucleotides, which negatively regulate the expression of human genes [10]. By biding to the 3′-untranslated region (3′-UTR) of the target mRNAs, miRNA induces degradation of mRNAs or suppresses translation of the target protein [11]. It has been suggested that miRNAs regulate up to 30% of the human genes and control cellular processes such as cell proliferation, development, apoptosis, and the immune response [12]. MiRNAs are aberrantly expressed or lost in a variety of cancers [13]. Many target mRNAs of miRNAs encode oncogenes and tumor suppressors; thus, dysregulated miRNAs may play a causal role in malignant progression. Not surprisingly, miRNAs are therefore considered attractive candidates for classification of tumors. The role of miRNAs in thyroid cancer is incompletely understood. A number of miRNAs have been identified in various thyroid tumors [14–16]. miR-197 and miR-346 are overexpressed in FC in comparison to adenoma, and in vitro studies suggested that both miRNAs could have a significant impact on tumour cell proliferation [14].
This present study is primarily focused on development of a biomarker for differential diagnosis of follicular thyroid cancer. Dettmer et al. performed miRNA microarray analysis and compared the expression profiles of follicular thyroid cancer and benign control, and identified a cluster of differentially expressed miRNA [17]. In this study, we selected 5 miRNAs (miR-574-3p, -543-5p, 455-3p, 455-5p, and 199a-5p), and determined their expression levels in the malignant and benign thyroid tissue samples.
Material and Methods
Thyroid samples
A total of 42 follicular carcinomas (age, 53.34±8.23, male: female, 11: 31) and 42 normal thyroid tissues (age, 52.56±6.84, male: female, 14: 28) were analyzed. We collected the snap-frozen tissues from samples of surgically removed thyroid at our hospital, and the study protocol was approved by the institutional ethics review board at Zibo City People’s Hospital. Informed consent from all subjects was obtained. All diagnoses were established by at least 2 experienced pathologists.
RNA extraction and quantitative PCR (qPCR)
Trizol reagent (Invitrogen, Carlsbad, CA) were used to extract total RNA in accordance with the manufacturer’s protocol. Quantitative real-time PCR was performed with mirVanaTM qRT-PCR microRNA detection kit (Ambion, Austin, TX) to determine the relative expression level of miRNAs (miR-574-3p, -543-5p, 455-3p, 455-5p, and 199a-5p) in accordance with the manufacturer’s protocol. Real-time RT-PCR was performed with the standard SYBR Green RT-PCR Kit (Takara, Otsu, Japan) to detect the expression of CTGF mRNA in accordance with the manufacturer’s protocol. The primer set for determination of CTGF mRNA expression level was: forward, 5′-ACAAGGGCCTCTTCTGTGACTT-3′ and reverse, GGTACACCGTACCACCGAAGAT-3′. 2-DDCt method and the GraphPad Prism 4.0 software (GraphPad Software, San Diego, CA) were used to qualify the relative expression of miRNAs or CTGF mRNA and the miRNAs with U6 as an internal control. 2−DDCt method was used to calculate the relative expression level of the miRNAs and the mRNA.
Cell culture and transfection
FTC-133 (a follicular thyroid carcinoma cell line) were purchased from sigma-Aldrich (St. Louis, MO). DMEM with 100 g/mL streptomycin, 100 U/mL penicillin, and 10% FBS (Invitrogen, Carlsbad, CA, USA) was used to culture the cells in a humidified atmosphere with 5% CO2 at 37°C. For the cell transfection assay, the synthetic miR-199a-5p mimic (5′-CCCAGUGUUCAGACUACCUGUUC-3′), the antisense RNA oligonucleotides specific for miR-199a-5p (miR-199a inhibitors) (5′-GAACAGGUAGUCUGAACACUGGG-3′), CTGF siRNA (5′-GCACCAGCAUGAAGACAUA-3′), and scramble control (5′-UGGGCGUAUAGACGUGUUACAC-3′) were transfected into cells using a lipofectamine RNAiMAX kit (Invitrogen) at 50% confluence in accordance with the manufacturer’s protocol, and 48 h after transfection, the cells were harvested for functional analysis.
Cell proliferation assays
A 3-(4, 5-dimethylthiazol-2-yl)-2,5-diphenyltetrazolium bromide (MTT) assay was used to evaluate cell viability. The cells were seeded into 96-well plates in triplicate at a density of 1×10⁴ cells/well and cells were maintained in a humidified atmosphere with 5% CO2 at 37°C. If transfection was needed, at 0, 1, 2, and 3 days after transfection, cells were treated with 0.125 mg/mL MTT (Amresco LLC, Solon, OH) for 3 h before harvest. The medium was removed after incubation with MTT, and cells were solubilized in dimethylsulfoxide (100 L/well). The OD490 in each well, which reflected the number of viable cells, was determined by a microplate reader (Molecular Devices, LLC, Silicon Valley, CA). Assays were performed in triplicate wells. Data are presented as means and SD from 3 independent experiments. A cell counter was used to measure cell numbers directly.
Cell cycle analysis
Flow cytometry analysis was performed to determine the fraction of G0/G1, S and G2/M phases of FTC-133 cells. Briefly, the cells were transfected with miR-199a-5p mimics or its inhibitor, or CTGF siRNA, and then harvested by trypsinization. Cold 75% ethanol was used to fix cells overnight at 4°C.We harvested the fixed cells, washed them twice with PBS, and resuspended them in PBS. Next, 10 ul of RNaseA was added and mixed, and then 25 ul of PI (propidium iodide) was added and incubated for 30 min in a 37°C water bath. Finally, we filtered the cells once prior to being loaded into the flow cytometry machine (Beckman Coulter).
Western blotting
SDS/polyacrylamide gel electrophoresis were used to separate protein extracts, and the separated protein was then transferred onto a nitrocellulose membrane (Millipore, Billerica, MA). The blots were washed 3 times and then blocked by using 5% non-fat milk dissolved in TBST. After washing another 3 times with TBST, the blots was incubated with rabbit anti-human CTGF polyclonal antibody (1:1000, LifeSpan Biosciences, Seattle, WA) and rabbit anti-human β-actin polyclonal antibody (1:10 000, LifeSpan Biosciences, Seattle, WA). Then the blots were washed again with TBST 3 times, and incubated with goat anti-rabbit secondary antibody labeled with HRP (Santa Cruz Biotech Inc, Santa Cruz, CA). The signals on the blots were detected using an ECL detection kit (Applygen, Beijing, China). The relative density of the target band was determined using ImageJ software with β-actin as internal control.
Luciferase assay
TP53INP1 3′-UTR was amplified and subcloned into a pGL3-control vector (Promega, Madison, WI) to construct the luciferase reporter vector. The accuracy of the insert was confirmed by using direct Sanger sequencing. The mutation was introduced into the construct to replace the predicted possible binding sites in the 3′-UTR of CTGF. In 24-well plates, 0.02 mg of the control vector containing Renilla luciferase pRL-CMV (Promega) and 0.4 mg of firefly luciferase reporter vector containing the mutant target site or wild-type was used to transfect FTC-133 cells using lipofectamine 2000 (Invitrogen, Carlsbad, CA). We transfected the cells with scramble negative controls and miR-199a-5p mimics at a final concentration of 100 nM each. We used the Dual Luciferase Reporter Assay System (Promega) to perform the luciferase assays 24 hours after transfection. The activity of Renilla luciferase was used to normalize the activity of firefly luciferase.
Statistical analysis
We used the t test to evaluate differences in the miRNAs and mRNA expression levels between the 2 groups. Data are expressed as mean ± standard deviation. The statistical analysis was performed using SPSS 19.0 version (IBM Inc, Chicago, IL). P<0.05 was considered to be statistically significant.
Results
Expression of miR-199a-5p decreased in malignant thyroid tissues
To study the role of miRNAs in the development of follicular thyroid carcinoma, we conducted qRT-PCR to detect the expressions of several microRNAs in 42 malignant thyroid tissue samples (follicular thyroid carcinoma) and 42 benign thyroid tissue samples. These miRNAs were: miR-574-3p, miR-542-5p, miR-455-3p, miR-455-5p, and miR-199a-5p, all of which have been reported to be aberrantly expressed in follicular thyroid carcinoma [17]. As shown in Figure 1, apart from miR-199a-5p being clearly downregulated in malignant samples compared with benign controls, all the other microRNAs showed no apparent difference between malignant and benign groups, indicating that miR-199a-5p might be functionally involved in the development of follicular thyroid carcinoma.
Figure 1.

Determination of the expression of miR-574-3p, miR-542-5p, miR-455-3p, miR-455-5p, and miR-199a-5p in follicular thyroid tissues and normal controls (** P<0.01).
CTGF was a target of miR-199a-5p
Because we detected an evident downregulation of miR-199a-5p, we assumed that miR-199a-5p plays a role in the control of malignancy transformation, probably via targeting 1 or more genes. By using miRNA target prediction tools, we established CTGF as a potential target of miR-199a-5p for the exact match between CTGF 3′UTR and the microRNA highly conserved regions (Figure 2A). To verify CTGF as the direct target of miR-199a-5p, we conducted luciferase reporter assay in FTC-133 cells together with vectors carrying wild-type or mutant CTGF 3′UTR segments. Figure 2B shows that the relative luciferase activity of CTGF 3′UTR treatment group was significantly lower than that of the negative controls, while the CTGF mutant 3′UTR treatment group showed comparable luciferase activity compared with negative controls, which validated CTGF as a direct target of miR-199a-5p.
Figure 2.

Identification of the binding site of miR-199a in the 3′UTR of CTGF. (A) CTGF was identified as target of miR-199a-5b, with its possible binding region in CTGF 3′UTR. (B) Relative luciferase activity of cells treated with constructs containing CTGF 3′UTR segments was significantly lower compared with the negative controls, while the cells transfected with constructs containing CTGF mutant 3′UTR segments was comparable compared with the negative controls (** P<0.01).
Possible negatively related association between miR-199a-5p and CTGF
We also examined the mRNA and protein expression level of CTGF via qRT-PCR and Western blot analysis, respectively, to investigate the effect of miR-199a-5p on CTGF. As shown in Figure 3, the normalized mRNA and protein expression levels of CTGF were both clearly higher in malignant tissues compared with benign tissues. The former conclusion of miR-199a-5p being downregulated in malignant tissues suggests a negative regulatory association between miR-199a-5p and CTGF.
Figure 3.
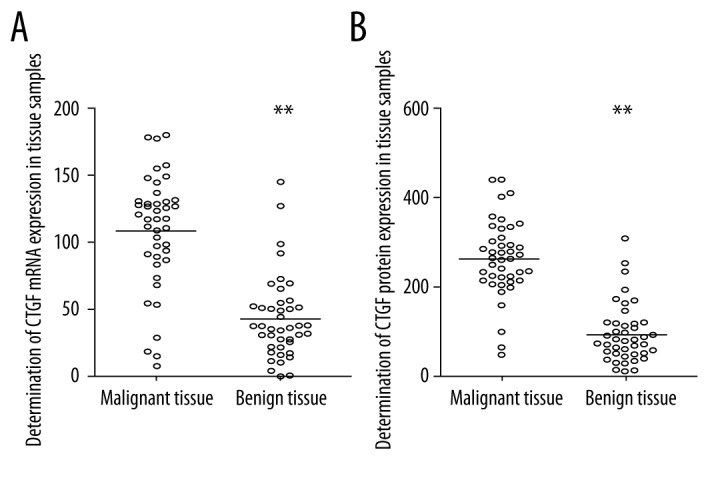
Determination of expression level of CTGF in human malignant (follicular thyroid carcinoma) and benign tissue samples. (A) Expression level of CTGF mRNA in cancerous thyroid tissue samples was upregulated compared with the benign samples. (B) Expression level of CTGF protein in cancerous thyroid tissue samples was upregulated compared with the benign samples (** P<0.01).
MiR-199a-5p inhibited the mRNA and protein expression of CTGF
To further explore the effect of miR-199a-5p upon CTGF in vitro, we also investigated the mRNA/protein expression levels of CTGF under different concentration levels of miR-199a-5p mimics. Figure 4A shows a stepwise decline as the concentration of miR-199a-5p mimics increased when compared with the negative controls, with the index of miR-199a-5p mimics 100nM being quite similar to that of CTGF siRNA 100nM. Protein expression also indicated the same trend among different cell groups, as determined by the relative density of target bands normalized to the band of β-actin. We performed “gain-of-function” by treating the cells with microRNA inhibitors. As shown in Figure 4B, the 50nM and 100nM miR-199a-5p inhibitor treatment groups showed higher mRNA expression levels and denser protein bands compared with the negative controls, and the expression levels increased when the concentration of microRNA inhibitors rose. The above results all support the conclusion of inhibitory effect of miR-199a-5p upon CTGF.
Figure 4.

Determination of expression of CTGF in FTC-133 cells transfected with miR-199a mimics, inhibitor, or CTGF siRNA. (A) The mRNA (lower panel) and protein (upper panel) expression of CTGF were inhibited by transfection of miR-199a-5p mimics in a stepwise manner, with inhibitory effect of miR-199a-5p mimics 100nM similar to that of CTGF siRNA 100 nM. (B) The mRNA (lower panel) and protein (upper panel) expression of CTGF were increased by introduction of miR-199a-5p inhibitors when compared to the negative controls in a stepwise manner (** P<0.01).
Influence of miR-199a-5p on viability of follicular thyroid carcinoma cells
We also examined cell viability of thyroid cancer cells treated with CTGF siRNA 100nM, miR-199a-5p inhibitors 100nM and miR-199a-5p mimics 100nM 24 h after transfection. As shown in Figure 5, cells treated with miR-199a-5p inhibitors 100nM showed a significantly higher viability compared with the controls, while cells treated with miR-199a-5p mimics 100nM and CTGF siRNA 100nM showed equally lower viability compared with the controls.
Figure 5.
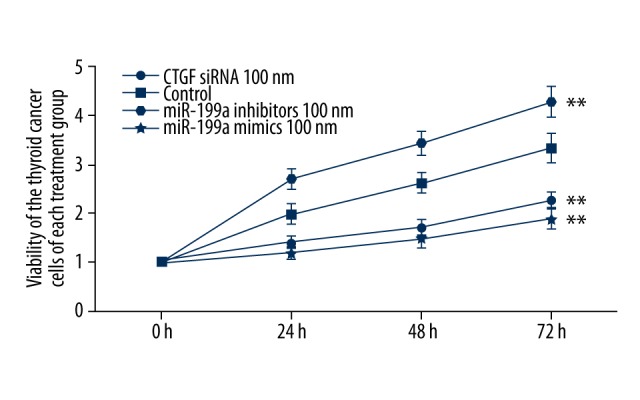
Viability was determined in FTC-133 cells with CTGF siRNA, miR-199a-5p mimics 100nM, which both reduced the viability when compared with the controls. Viability was increased when treated with miR-199a-5p inhibitors (** P<0.01).
Influence of miR-199a-5p on cell cycle of follicular thyroid carcinoma cells
To investigate the mechanism underlying the regulation of miR-199a-5p upon cells proliferation, we carried out cell cycle distribution analysis in malignant thyroid cells, using flow cytometry. As shown in Figure 6, when compared with the control group, transfection of miR-199a-5p mimics boosted the fraction of cells in G0 phase, from 68% to 93%, and reduced G2/M and S phase cells from 22.9% to 3.7% and 9% to 3.3%, respectively. Transfection of CTGF siRNA also exhibited a similar effect on malignant thyroid cells. In contrast, transfection of miR-199a-5p inhibitors suppressed the fraction of cells in G0 phase from 68% to 60.9%, and increased fraction of cells in G2/M phase from 22.9% to 25.7% and in S phase from 9.1% to 13.4%. These data demonstrate that overexpression of miR-199a-5p could suppress the proliferation of malignant thyroid cells through arresting cell growth in G0 phase.
Figure 6.
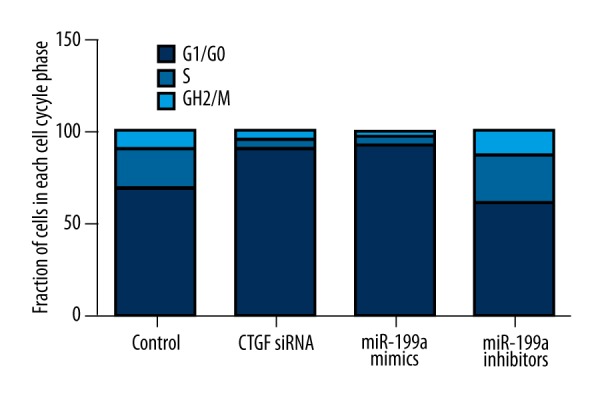
Transfection of miR-199a-5p mimics boosted the fraction of cells in G0 phase, from 68% to 93%, and reduced G2/M and S phase cell fraction from 22.9% to 3.7% and 9% to 3.3%, respectively. Transfection of CTGF siRNA also exhibited similar effect on malignant thyroid cells. In contrast, transfection of miR-199a-5p inhibitors suppressed the fraction of cells in G0 phase from 68% to 60.9%, and increased fraction of cells in G2/M phase from 22.9% to 25.7%, and in S phase from 9.1% to 13.4%.
Discussion
Located in intron 14 of dynamin-2 gene on chromosome 19, the expression of miR-199a was found to be diversely deregulated in several types of cancer; it is downregulated in some (e.g., renal, bladder, prostate, ovarian cancer, and oral squamous cell carcinoma) [18] but is upregulated in others (e.g., cervical carcinoma, bronchial squamous cell carcinoma, and gastric cancer) [19–21]. It was reported that the induced expression of miRNA-199a was capable of inhibiting the proliferation of gastric cancer cells by targeting the mTOR signaling pathway [22]. The abundant expression of miR-199a was observed in liver tissue as well as in epithelial and non-epithelial tissues [23]. A recent study showed that miR-199a targeted the hyaluronic acid (HA) receptor CD44, and overexpression of the miR-199a reduced the proliferation of HCC cells [24]. Similarly, another investigation found that miR-199a specifically regulated CD44, and upregulation of miR-199a repressed the proliferation of ovarian cancer-initiating cells in vitro and in vivo [25]. In this study, we conducted qRT-PCR to detect the expressions of several candidate miRNAs (miR-574-3p, miR-542-5p, miR-455-3p, miR-455-5p, and miR-199a-5p) in 42 malignant thyroid tissue samples (follicular thyroid carcinoma) and 42 benign thyroid tissue samples. We found that miR-199a-5p was the only miRNA that was differentially expressed between malignant and benign thyroid tissues. Furthermore, CTGF was predicted to be a target of miR-199a-5p by using online informatics tools, and this hypothesis was tested and confirmed by luciferase reporter assay, showing that the relative luciferase activity of the CTGF 3′UTR treatment group was significantly lower than that of the negative controls, while the CTGF mutant 3′UTR treatment group and the negative controls showed comparable luciferase activity. Additionally, transfection of miR-199a-5p mimics and CTGF siRNA substantially and similarly downregulated the expression of CTGF in FTC-133 cells, but transfection with miR-199a-5p inhibitors notably upregulated the expression of CTGF. All of the above data indicate that CTGF is a direct target of miR-199a-5p in follicular thyroid carcinoma cells.
Connective tissue growth factor (CTGF) is part of the CCN family, which is composed of 6 members: CTGF/CCN2, Cyr61 (cysteine-rich protein 61, CCN1), WISP-1 (Wnt-1-induced secreted protein 1, CCN4), WISP-3(CCN6), WISP-2 (CCN5), and Nov (nephroblastoma overexpressed gene, CCN3) [26]. There are 4 structural domains which have similar sequence to von Willebrand type C factor, insulin-like growth factor-binding proteins, a cysteine knot and thrombospondin 1 [27], besides NH2-terminal signal peptide, each of which has a different function [28]. Growing evidence shows that CTGF plays a role in tumor transformation. Upregulation of CTGF was noted in breast cancer [29], glioma [30], esophageal squamous cell carcinoma [31], and prostate cancer [32]. Downregulation of CTGF was noticed in colon and lung cancer [33,34], in which enforced expression of CTGF suppressed metastasis and invasion of cancer cells in vivo and in vitro. Moreover, chondrosarcoma patients with high expression have increased survival rate [35]. Different tumor types shows disparities in expression levels of CTGF, which implies that CTGF has specific functions in different cell types. In this study, we found that upregulation of CTGF caused by downregulation of miR-199a-5p in a follicular thyroid carcinoma cell line markedly promoted proliferation of the cells, and downregulation of CTGF by introduction of miR-199a-5p mimics clearly suppressed the growth of the cells.
A recent study showed that induced expression of miR-199a induced G0/G1 cell cycle arrest [35], which contributed to repression of cell cycle progression and could inhibit the proliferation of HepG2 cells. In this study, we found that transfection of miR-199a-5p mimics boosted the fraction of cells in G0 phase, from 68% to 93%, and reduced G2/M and S phase cell fraction from 22.9% to 3.7% and 9% to 3.3%, respectively. Transfection of CTGF siRNA also exhibited a similar effect on malignant thyroid cells. In contrast, transfection of miR-199a-5p inhibitors suppressed the fraction of cells in G0 phase, from 68% to 60.9%, and increased fraction of cells in G2/M phase from 22.9% to 25.7%, and in S phase from 9.1% to 13.4%. These data demonstrate that overexpression of miR-199a-5p could suppress the proliferation of malignant thyroid cells through arresting cell growth in G0 phase.
Conclusions
Our findings strongly suggest miR-199a-5p is a tumor suppressor in follicular thyroid carcinoma. Our study demonstrates that frequent down-regulation of miR-199a-5p is associated with abnormally enhanced proliferation of cancer cells. Furthermore, the restored expression of miR-199a-5p in the cells down-regulated CTGF, which results in inhibition of the cell cycle and reduced proliferation of cells. These findings give a fresh perspective on the molecular mechanisms of follicular thyroid carcinoma, and provide us an innovative theoretical basis for further studies on the potential of miR-199a-5p as biomarker and in treatment for this disease.
Footnotes
Conflict of interest
The authors declare no conflict of interest.
Source of support: Shandong Province medical and health science and technology development plan (2014) (No. 2014WS0457)
References
- 1.Hegedus L, Bonnema SJ, Bennedbaek FN. Management of simple nodular goiter: current status and future perspectives. Endocr Rev. 2003;24:102–32. doi: 10.1210/er.2002-0016. [DOI] [PubMed] [Google Scholar]
- 2.Curado MP, Edwards B. In: Cancer Incidence in Five Continents. Curada MP, Edwards B, Shin HR, editors. IX. Lyon: IARC; 2007. IARC Scientific Publication. No. 160. [Google Scholar]
- 3.DeLellis R, Lloyd R, Heitz P, Eng C, editors. Pathology and genetics of tumours of endocrine organs. Lyon, France: IARC Press; 2004. [Google Scholar]
- 4.Nikiforov YE. Thyroid tumors: classification, staging and general considerations. In: Nikiforov Y, Biddinger PW, Thompson LDR, editors. Diagnostic pathology and molecular genetics of the thyroid. Baltimore: Lippincott Williams&Wilkins; 2012. pp. 108–18. [Google Scholar]
- 5.Nikiforov YE, Ohori NP, Hodak SP, et al. Impact of mutational testing on the diagnosis and management of patients with cytologically indeterminate thyroid nodules: a prospective analysis of 1056 FNA samples. J Clin Endocrinol Metab. 2011;96:3390–97. doi: 10.1210/jc.2011-1469. [DOI] [PMC free article] [PubMed] [Google Scholar]
- 6.Nikiforov YE, Steward DL, Robinson-Smith TM, et al. Molecular testing for mutations in improving the fine-needle aspiration diagnosis of thyroid nodules. J Clin Endocrinol Metab. 2009;94:2092–98. doi: 10.1210/jc.2009-0247. [DOI] [PubMed] [Google Scholar]
- 7.Cantara S, Capezzone M, Marchisotta S, et al. Impact of proto-oncogene mutation detection in cytological specimens from thyroid nodules improves the diagnostic accuracy of cytology. J Clin Endocrinol Metab. 2010;95:1365–69. doi: 10.1210/jc.2009-2103. [DOI] [PubMed] [Google Scholar]
- 8.Nikiforova MN, Lynch RA, Biddinger PW, et al. RAS point mutations and PAX8-PPAR gamma rearrangement in thyroid tumors: evidence for distinct molecular pathways in thyroid follicular carcinoma. J Clin Endocrinol Metab. 2003;88:2318–26. doi: 10.1210/jc.2002-021907. [DOI] [PubMed] [Google Scholar]
- 9.Sobrinho-Simoes M, Eloy C, Magalhaes J, et al. Follicular thyroid carcinoma. Mod Pathol. 2011;24(Suppl 2):S10–18. doi: 10.1038/modpathol.2010.133. [DOI] [PubMed] [Google Scholar]
- 10.Bartel DP. MicroRNAs: genomics, biogenesis, mechanism, and function. Cell. 2004;116:281–97. doi: 10.1016/s0092-8674(04)00045-5. [DOI] [PubMed] [Google Scholar]
- 11.Ambros V. The functions of animal microRNAs. Nature. 2004;431:350–55. doi: 10.1038/nature02871. [DOI] [PubMed] [Google Scholar]
- 12.Rhoades MW, Reinhart BJ, Lim LP, et al. Prediction of plant microRNA targets. Cell. 2002;110:513–20. doi: 10.1016/s0092-8674(02)00863-2. [DOI] [PubMed] [Google Scholar]
- 13.Rosenfeld N, Aharonov R, Meiri E, et al. MicroRNAs accurately identify cancer tissue origin. Nat Biotechnol. 2008;26:462–69. doi: 10.1038/nbt1392. [DOI] [PubMed] [Google Scholar]
- 14.Weber F, Teresi RE, Broelsch CE, et al. A limited set of human MicroRNA is deregulated in follicular thyroid carcinoma. J Clin Endocrinol Metab. 2006;91:3584–91. doi: 10.1210/jc.2006-0693. [DOI] [PubMed] [Google Scholar]
- 15.Applegarth DA, Davidson AG, Sorenson P, Wong LT. Abnormal anion exchange mechanism operates in the sweat glands of cystic fibrosis patients. Pediatr Res. 1984;18:496–97. doi: 10.1203/00006450-198405000-00022. [DOI] [PubMed] [Google Scholar]
- 16.Chen YT, Kitabayashi N, Zhou XK, et al. MicroRNA analysis as a potential diagnostic tool for papillary thyroid carcinoma. Mod Pathol. 2008;21:1139–46. doi: 10.1038/modpathol.2008.105. [DOI] [PubMed] [Google Scholar]
- 17.Dettmer M, Vogetseder A, Durso MB, et al. MicroRNA expression array identifies novel diagnostic markers for conventional and oncocytic follicular thyroid carcinomas. J Clin Endocrinol Metab. 2013;98:E1–7. doi: 10.1210/jc.2012-2694. [DOI] [PMC free article] [PubMed] [Google Scholar]
- 18.Nam EJ, Yoon H, Kim SW, et al. MicroRNA expression profiles in serous ovarian carcinoma. Clin Cancer Res. 2008;14:2690–95. doi: 10.1158/1078-0432.CCR-07-1731. [DOI] [PubMed] [Google Scholar]
- 19.Lee JW, Choi CH, Choi JJ, et al. Altered MicroRNA expression in cervical carcinomas. Clin Cancer Res. 2008;14:2535–42. doi: 10.1158/1078-0432.CCR-07-1231. [DOI] [PubMed] [Google Scholar]
- 20.Ueda T, Volinia S, Okumura H, et al. Relation between microRNA expression and progression and prognosis of gastric cancer: a microRNA expression analysis. Lancet Oncol. 2010;11:136–46. doi: 10.1016/S1470-2045(09)70343-2. [DOI] [PMC free article] [PubMed] [Google Scholar]
- 21.He XJ, Ma YY, Yu S, et al. Up-regulated miR-199a-5p in gastric cancer functions as an oncogene and targets klotho. BMC Cancer. 2014;14:218. doi: 10.1186/1471-2407-14-218. [DOI] [PMC free article] [PubMed] [Google Scholar] [Retracted]
- 22.Peng W, Chen ZY, Wang L, et al. MicroRNA-199a-3p is downregulated in gastric carcinomas and modulates cell proliferation. Genet Mol Res. 2013;12:3038–47. doi: 10.4238/2013.August.20.5. [DOI] [PubMed] [Google Scholar]
- 23.Liang Y, Ridzon D, Wong L, Chen C. Characterization of microRNA expression profiles in normal human tissues. BMC Genomics. 2007;8:166. doi: 10.1186/1471-2164-8-166. [DOI] [PMC free article] [PubMed] [Google Scholar]
- 24.Henry JC, Park JK, Jiang J, et al. miR-199a-3p targets CD44 and reduces proliferation of CD44 positive hepatocellular carcinoma cell lines. Biochem Biophys Res Commun. 2010;403:120–25. doi: 10.1016/j.bbrc.2010.10.130. [DOI] [PMC free article] [PubMed] [Google Scholar]
- 25.Cheng W, Liu T, Wan X, et al. MicroRNA-199a targets CD44 to suppress the tumorigenicity and multidrug resistance of ovarian cancer-initiating cells. FEBS J. 2012;279:2047–59. doi: 10.1111/j.1742-4658.2012.08589.x. [DOI] [PubMed] [Google Scholar]
- 26.Nishida T, Kondo S, Maeda A, et al. CCN family 2/connective tissue growth factor (CCN2/CTGF) regulates the expression of Vegf through Hif-1alpha expression in a chondrocytic cell line, HCS-2/8, under hypoxic condition. Bone. 2009;44:24–31. doi: 10.1016/j.bone.2008.08.125. [DOI] [PMC free article] [PubMed] [Google Scholar]
- 27.Bork P. The modular architecture of a new family of growth regulators related to connective tissue growth factor. FEBS Lett. 1993;327:125–30. doi: 10.1016/0014-5793(93)80155-n. [DOI] [PubMed] [Google Scholar]
- 28.Perbal B. CCN proteins: multifunctional signalling regulators. Lancet. 2004;363:62–64. doi: 10.1016/S0140-6736(03)15172-0. [DOI] [PubMed] [Google Scholar]
- 29.Wang MY, Chen PS, Prakash E, et al. Connective tissue growth factor confers drug resistance in breast cancer through concomitant up-regulation of Bcl-xL and cIAP1. Cancer Res. 2009;69:3482–91. doi: 10.1158/0008-5472.CAN-08-2524. [DOI] [PubMed] [Google Scholar]
- 30.Xie D, Yin D, Wang HJ, et al. Levels of expression of CYR61 and CTGF are prognostic for tumor progression and survival of individuals with gliomas. Clin Cancer Res. 2004;10:2072–81. doi: 10.1158/1078-0432.ccr-0659-03. [DOI] [PubMed] [Google Scholar]
- 31.Deng YZ, Chen PP, Wang Y, et al. Connective tissue growth factor is overexpressed in esophageal squamous cell carcinoma and promotes tumorigenicity through beta-catenin-T-cell factor/Lef signaling. J Biol Chem. 2007;282:36571–81. doi: 10.1074/jbc.M704141200. [DOI] [PubMed] [Google Scholar]
- 32.Yang F, Tuxhorn JA, Ressler SJ, et al. Stromal expression of connective tissue growth factor promotes angiogenesis and prostate cancer tumorigenesis. Cancer Res. 2005;65:8887–95. doi: 10.1158/0008-5472.CAN-05-1702. [DOI] [PubMed] [Google Scholar]
- 33.Chen PP, Li WJ, Wang Y, et al. Expression of Cyr61, CTGF, and WISP-1 correlates with clinical features of lung cancer. PLoS One. 2007;2:e534. doi: 10.1371/journal.pone.0000534. [DOI] [PMC free article] [PubMed] [Google Scholar]
- 34.Lin BR, Chang CC, Che TF, et al. Connective tissue growth factor inhibits metastasis and acts as an independent prognostic marker in colorectal cancer. Gastroenterology. 2005;128:9–23. doi: 10.1053/j.gastro.2004.10.007. [DOI] [PubMed] [Google Scholar]
- 35.Shakunaga T, Ozaki T, Ohara N, et al. Expression of connective tissue growth factor in cartilaginous tumors. Cancer. 2000;89:1466–73. [PubMed] [Google Scholar]