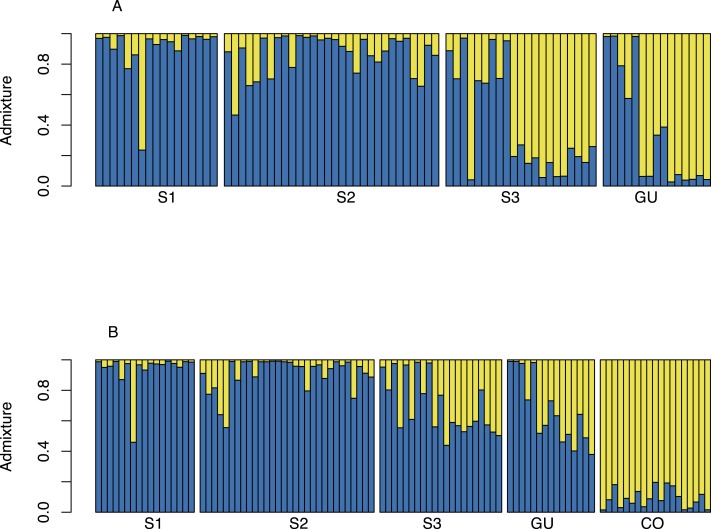
Figure 3. Structure admixture graph for MQ and GU.
(A) Admixture of O. glumaepatula samples from three sub-populations (S1, S2, S3) along the Medio Queso river (MQ) and Guanacaste (GU) in Costa Rica; assigned to two clusters (K = 2) using the Bayesian clustering algorithm in Structure. (B) admixture of O. glumaepatula populations and commercial Oryza sativa (CO) individuals.

