

Abstract
Objective
Much of the genetic basis for Alzheimer disease (AD) is unexplained. We sought to identify novel AD loci using a unique family-based approach that can detect robust associations with infrequent variants (minor allele frequency <0.10).
Methods
We conducted a genome-wide association study in the Framingham Heart Study (FHS) (discovery) and NIA-LOAD (replication) family-based cohorts using an approach that accounts for family structure and calculates a risk score for AD as the outcome. Links between the most promising gene candidate and AD pathogenesis were explored in silico as well as experimentally in cell-based models and in human brain.
Results
Genome-wide significant association was identified with a PLXNA4 SNP (rs277470) located in a region encoding the semaphorin-3A (SEMA3A) binding domain (meta-analysis p value [meta-P]=4.1×10⁻⁸). A test for association with the entire region was also significant (meta-P=3.2×10⁻⁴). Transfection of SH-SY5Y cells or primary rat neurons with full-length PLXNA4 (TS1) increased tau phosphorylation when stimulated by SEMA3A. The opposite effect was observed when transfected with shorter isoforms (TS2 and TS3). However, transfection of any isoform into HEK293 cells stably expressing APP did not result in differential effects on APP processing or Aβ production. Late-stage AD cases (n=9) compared to controls (n=5) had 1.9-fold increased expression of TS1 in cortical brain tissue (P=1.6×10⁻⁴). Expression of TS1 was significantly correlated with the Clinical Dementia Rating score (ρ=0.75, P=2.2×10⁻⁴), plaque density (ρ=0.56, P=0.01) and Braak stage (ρ=0.54, P=0.02).
Interpretation
Our results indicate that PLXNA4 has a role in AD pathogenesis through isoform-specific effects on tau phosphorylation.
INTRODUCTION
Alzheimer disease (AD) is the most frequent age-related dementia affecting 5.4 million Americans including 13% of people ages 65 and older and over 40% of people ages 85 and older.1 Genetic factors account for much of the risk for developing AD with heritability estimates between 60% and 80%.2 The apolipoprotein E (APOE) ε4 allele is a well-recognized major risk factor for late onset AD, increasing the odds of disease in a dose-dependent fashion.3 Common polymorphisms in 19 additional genes have been robustly established as risk factors for AD using large-scale genome-wide association studies (GWAS) and meta-analyses.4 These polymorphisms link to mechanisms of Aβ metabolism, lipid metabolism, inflammation, and axon guidance.5, 6 However, the heritability of AD explained by APOE is less than 30% and by each of the novel GWAS loci is less than 1%, suggesting that less than 50% of the genetic contribution to AD is explained by known common polymorphisms.4, 7, 8 The remaining heritability may be due to additional common variants of weaker effect, rare variants, copy-number variants, insertion-deletion polymorphisms, and gene-gene and gene-environment interactions.9, 10
Here, we conducted a two-stage family-based AD GWAS using a novel method which incorporates the entire family structure and reduces diagnostic misclassification in the association test, and renders a result that is less prone to type I error, even for rare variants.11 We obtained strong evidence of association in the Framingham Heart Study (FHS) dataset with several SNPs in PLXNA4, a gene which had not been previously linked to AD. Several other PLXNA4 SNPs were highly significant in the National Institute on Aging-Late-Onset Alzheimer Disease (NIA-LOAD) study dataset. Subsequent in silico and molecular studies demonstrated isoform-specific effects of PLXNA4 on hyperphosphorylation of tau protein, a terminal step leading to breakdown of neuronal signaling and microtubule formation.
MATERIALS AND METHODS
Study Cohorts
Framingham Heart Study (FHS) discovery cohort
The FHS is a multigenerational study of health and disease in a prospectively followed community-based sample. Details on procedures for assessing dementia and determining AD status in this cohort are described elsewhere.12 We included only incident AD cases who had a magnetic resonance imaging (MRI) scan prior to disease onset. Clinical, demographic, genetic and pedigree information were obtained from dbGaP (http://www.ncbi.nlm.nih.gov/gap). Phenotypic and genome-wide association study (GWAS) data were available for 61 cases and 2,530 cognitively normal controls from 1,232 families. This sample contained 287 parent-offspring pairs, 1,215 sibpairs, 236 avuncular pairs, 714 cousin pairs, and 436 spouse pairs. The 61 AD cases are members of 57 families and three of these families contained distantly related affected individuals included in the analyses. Sixteen families did not have any genotyped AD cases but contained individuals with a history of dementia.
National Institute on Aging – Late Onset Alzheimer's Disease (NIA-LOAD) replication cohort
The NIA-LOAD Study recruited families with two or more affected members available for genotyping.13 Phenotype and GWAS data for this cohort were obtained from dbGaP. The GWAS dataset included a total of 1,819 AD cases and 1,969 unaffected individuals from 2,265 families. The 1,819 AD cases are distributed among 988 families containing 1,010 concordantly affected, 878 discordantly affected, and 541 concordantly unaffected sibpairs. Within the GWAS dataset, there were 526 parent-offspring pairs, 2,429 sibpairs, 1,905 avuncular pairs, 1,533 cousin pairs, and spouse pairs.
Alzheimer's Disease Genetics Consortium (ADGC) replication cohort
We obtained summarized results for SNPs located in the top-ranked locus from each of the individual ADGC datasets (excluding the NIA-LOAD dataset) which are described elsewhere.7, 14, 15 This sample included 18,901 Caucasians (9,966 cases and 8,935 controls), 4,896 African Americans (1,459 cases and 3,437 controls), and 1,845 Japanese (951 cases and 894 controls).
Genotyping, Quality Control, Population Substructure, and Imputation
FHS samples were genotyped at Affymetrix (Santa Clara, CA) using the Affymetrix GeneChip® Human Mapping 500K Array Set and 50K Human Gene Focused Panel®.16 NIA-LOAD samples were genotyped using Illumina 610 high-density SNP microarrays.7 APOE genotypes were obtained by restriction fragment length polymorphism analysis for the FHS cohort and by haplotype analysis of SNPs rs7412 and rs429358, which were genotyped at Prevention Genetics (http://www.preventiongenetics.com) for the NIA-LOAD cohort.
Quality control (QC) procedures and analysis of population substructure were performed as previously described.17 In the discovery genome-wide association (GWA) dataset, 341,492 SNPs genotyped in 2,591 subjects passed QC. Based on this number of SNPs, the threshold for genome-wide significance was P=1.46×10⁻⁷.
In candidate gene analyses in the FHS and NIA-LOAD datasets, we evaluated SNPs within 50 kb of the top-ranked gene from the discovery GWA study that were imputed previously using the HapMap 2 CEU reference panel and the MaCH program.17, 18 SNPs with an imputation quality measure (RSQ)<0.80 were excluded.
Statistical Analysis
AD risk scores
We calculated AD risk scores using two different approaches. In the FHS dataset, liability scores are residuals from a logistic regression model for AD affection status adjusting for sex and censoring age (age at onset of AD or age at exam of controls) evaluated using R.17 We did not adjust for previously derived principal components (PCs) of population substructure because they were not significantly associated with the liability scores in the FHS dataset.19 In the NIA-LOAD dataset, we calculated liability scores (residuals) from a logistic regression model for AD affection status adjusting for sex, censoring age, and the first two genotype-covariance matrix PCs to account for population substructure. We also computed propensity scores in the NIA-LOAD dataset to account for the approximately 10-year lower mean age of this cohort compared to the FHS cohort and ascertainment of families with multiple affected members. This method was suggested previously for analysis of a binary trait with various ages at onset and exam among affected and unaffected subjects, respectively.20, 21 Propensity scores were obtained for unaffected family members using the AGEON program in S.A.G.E. (v6.2)22 as the probability of getting disease conditioned on affection status and censoring age of their parents. Affection status for AD cases (probability=1) was retained in the model. Propensity scores were further adjusted for censoring age, sex, and the first two PCs in a linear regression model, and the residuals used as the outcome variable. We were unable to obtain propensity scores in the FHS dataset because of incomplete parental information.
SNP association test
The quantitative risk scores (residuals from liability or propensity scores) were normalized by taking the inverse standard normal transformation of the empirical quantile that was obtained using the formula [r(y)−1/3] divided by (n+1/3), where r(y) is the rank of residuals, y. This approach has been demonstrated to be valid for family-based association tests even for a binary trait with rare variants.23 Association of the normalized risk scores with each SNP was evaluated using the extension of the two-level Haseman-Elston regression method implemented in the RELPAL program in S.A.G.E. (v6.1).24, 25 Models included a term for an inheritance vector of exhaustive relative pairs. Nominal P values for association were determined using first-level Wald tests. For top-ranked genes, we conducted association tests for genotyped and well-imputed SNPs (RSQ ≥ 0.8) in the FHS and the NIA-LOAD datasets using a risk score (i.e., liability score or propensity score) as a quantitative trait.
Regional association test
To allow for the possibility of allelic heterogeneity between the two family datasets, we performed association tests within each dataset for regions in the top ranked gene defined by the ligand-binding domain of the encoded protein using the Versatile Gene-Based Association Study (VEGAS) program which calculates p values based on 100,000 permutations.26
Meta-analysis
Results from the FHS and NIA-LOAD datasets were combined by meta-analysis of Z-scores weighted by the number of subjects using METAL.27 In region-based meta-analysis, we assumed the same direction of effect on a region in both datasets and combined results using the Z-score approach. The summary results for the ADGC datasets (excluding the NIA-LOAD study) were meta-analyzed using the inverse variance method in METAL after applying a genomic control within each individual dataset.7
APP and Amyloid β (Aβ) Analyses
Cell maintenance and transfection
HEK293 cells stably transfected with wild type APP751, were maintained as previously described.28 The day before transfection, cells were split into 6 well plates at a density of 1×10⁵ cells per well. The cells were transfected with EV (empty vector) or PLXNA4 isoforms (TS1, TS2, or TS3) from OriGene using Attractene (Qiagen). Forty-eight hours post transfection, media were collected and cells were lysed as described.28
SDS-PAGE and western blotting
Proteins were separated on 8% Tris-Glycine gels and transferred onto nitrocellulose (Millipore). Primary antibodies were mouse monoclonal 6E10 (Covance, 1:1000) against amino acids 1–17 of Aβ that also recognize full length APP and APPsα, anti-Myc mAb (Sigma, 1:1000) and mouse monoclonal beta-tubulin (Invitrogen, 1:10,000). Secondary antibody was peroxidase labeled goat anti-mouse IgG (KPL, 1:500). The Supersignal West Pico Chemiluminescent Substrate (Thermo Scientific) was used for detection. Protein expression was analyzed by densitometry using ImageJ software. The expression of APPsα was normalized to total APP.
Aβ enzyme-linked immunosorbent (ELISA) assay
Forty-eight hours after transfection of HEK293 cells (stably transfected with wtAPP751) with EV or PLXNA4 isoforms (TS1, TS2, or TS3), media were collected and centrifuged at 16,873g for 5min at 4°C to discard cell debris. ELISAs were carried out using the human Aâ40 and Aâ42 ELISA kits (Invitrogen) in accordance with manufacturer's protocol with samples diluted 1:2 in diluent buffer and as previously described.28
Tau Analyses
Tau immunoblotting
SH-SY5Y cells (2×10⁶) stably expressing mutant tau P301L (SH-SY5Y P301L) were transfected with 1 μg of various Plexin-A4-Myc or pcDNA3 vectors by lipofectamine 2000 (Invitroge, Corp., Carlsbad, CA). After transfection, cells were treated with or without 3nM Semaphorin3A (Sema3A-FC, R&D Systems) for 1 hour. Twenty g of whole cell lysate were immunoblotted with phospho-tau (AT-8, 1:500), total-tau (Tau46, 1:500), β-actin (1:1000), or Myc (9E10, 1:1000) as previously described.29
Pull-down assay
Plexin-A4-Myc transfected SH-SY5Y P301L cells were treated with 3nM 6xHis human Sema3A-FC in DMEM/F12/B-27 medium. After Sema3A-FC stimulation, the media were collected and the Sema3A-FC was precipitated with Protein A/G agarose, followed by immunoblotting of the samples for Myc (9E10, for detection of Plexin-A4 molecules) and 6x His (H-3, for detection of Sema3A, 1:1000, Santa Cruz Biotech).
Primary neuron culture and tau immunofluorescence
Rat primary hippocampal neurons were harvested from E18 embryonic brain, plated on poly-D-lysine coated coverslips, cultured for 14 days, and transfected with full-length or short isoforms of human Plexin-A4-Myc DNA plasmid vectors by lipofectamine 2000 (Invitrogen). Twenty-four hrs after transfection, cells were treated with or without 3 nM Semaphorin3A (Sema3A-FC) for 1-hr, fixed with 4% paraformaldehyde, and co-stained with T514 phosphorylated collapsing response mediator protein 2 (pT514 CRMP2, Ab62478, rabbit polyclonal 1:500, Abcam) and β3-tubulin (mouse monoclonal 1:500, Promega), or co-stained with AT8 (mouse monoclonal, 1:500) and anti-Myc (rabbit polyconal, 1:200, Covance Inc), followed by incubation with anti-mouse IgG Alexa 568 conjugated goat secondary antibody (1:600, Invitrogen) and anti-rabbit IgG Alexa 488 conjugated goat secondary antibody (1:600, Invitrogen). Immunostained AT8 signals were digitally captured using an inverted fluorescence microscope (TE-2000U, Nikon Instruments, Melvin, NY) and quantified by ImageJ (NIH shareware program). Data were obtained from at least 100 cells in three independent experiments.
Analyses of Gene Expression in Brain
Gene expression experiments were conducted on brain tissue specimens obtained from 17 autopsied subjects including five controls (Braak stage 0), five early-stage AD cases (Braak stages 1–2), and nine late-stage AD cases (Braak stages 3–4). Ascertainment, cognitive assessment, neuropathological assessment, and stratification of these subjects were previously described.30 Frozen post-mortem brain tissue specimens from Brodmann area 9 of subjects were obtained from the Mount Sinai/Bronx Veterans Administration (VA) Medical Center/Department of Psychiatry Brain Bank. Normal controls had no history of any psychiatric or neurological disorders and no discernible neuropathological lesions. The Institutional Review Boards of Pilgrim Psychiatric Center, the Icahn School of Medicine at Mount Sinai, and the Bronx VA Medical Center approved all assessment and post-mortem procedures.
Total RNA was isolated from 50 mg of tissue by using the Qiagen miRNeasy kit. Isolated RNA samples were treated with 40 units of DNase I (Ambion) to remove genomic DNA contamination. Template RNA quantity and quality, including degradation, were determined on an Agilent 2100 Bioanalizer. Two samples with very low RNA integrity number were excluded from the study. After cDNA synthesis using Superscript III first-strand synthesis kit (Invitrogen, Carlsbad, CA), qPCR were run on an ABI 7900HT real-time machine in triplicate using Platinium Quantitative PCR SuperMix-UDG (Invitrogen, Carlsbad, CA) for primers designed with the Roche Universal Probe Library or SYBR GreenER qPCR supermix for regular primers for ABI PRISM (Invitrogen). Acquired data were loaded onto qBase ver.1.3.5 software for quality control and normalization to reference genes GAPDH and RPL13A.
Group differences between TS1 and TS3 or between controls and AD cases were evaluated using ANOVA and the appropriate T-test after checking for equality of variances. Pearson correlations were calculated using the SPSS program. Although post-mortem intervals (PMI) among AD cases and controls were comparable (P=0.450), we repeated the analyses including PMI as a covariate because differences in PMI can affect brain biochemistry and quality of RNA. Since results from models with and without PMI were similar, we reported only the results without adjustment for PMI.
RESULTS
Genome-Wide Association
The mean onset age of AD among the 61 incident cases in the FHS dataset was about 10 years older than that for the 1,819 AD cases in the NIA-LOAD dataset (Table 1). The frequency of APOE ε4 carriers in affected subjects was approximately two times greater in the NIA-LOAD cohort compared to the FHS cohort. In addition, the proportion of APOE ε4 carriers in controls was 15% less in the FHS cohort. Among the 1,969 unaffected family members in the NIA-LOAD cohort, 439 had propensity scores of at least 80% (i.e., risk to develop AD accounting for parental affection status and age at onset/exam) and 809 had propensity scores of zero indicating true controls.
Table 1.
Sample characteristics
| Characteristics | Family Set |
ADGC Set |
|||
|---|---|---|---|---|---|
| FHS | NIA-LOAD | Caucasian | African American | Japanese | |
| Total, N | 2876 | 3828 | 18901 | 4896 | 1845 |
| AD Cases, N | 61 | 2530 | 9966 | 1459 | 951 |
| Female % | 54 | 63 | 58 | 70 | 64 |
| Age at onset (AD cases), mean (SD) | 82.8 (9.2) | 73.3 (7.0) | 76.4 (8.4) | 79.4 (7.7) | 73.0 (4.3) |
| Age at last exam (AD controls), mean (SD) | 68.1 (10.6) | 75.4 (11.6) | 77.3 (7.7) | 77.4 (8.2) | 76.9 (6.0) |
| % of APOE ε4-carriers in cases | 42.6 | 75.0 | 56.0 | 57.3 | 56.3 |
| % APOE ε4-carriers in controls | 21.6 | 36.6 | 21.5 | 34.7 | 15.9 |
FHS=Framingham Heart Study; NIA-LOAD=National Institute on Aging-Late Onset Alzheimer's Disease. ADGC replication set consisted of previously reported unrelated datasets from 14 Caucasian studies (excluding NIA-LOAD), 7 African American datasets (excluding NIA-LOAD), and one Japanese dataset.
Analysis of genotyped SNPs (n=341,492 post quality control) in the FHS dataset using the normalized liability scores for AD (Fig 1A) indicated little genomic inflation (λ=1.01, Fig 1B) with strong evidence of association in three regions of the genome (Fig 1C). Genome-wide significant associations were found with SNPs in ITIH3 (rs9311482: β=1.3, P=5×10⁻⁹), PLXNA4 (rs277484: β=1.1, P=9×10⁻¹⁰) and MYO18B (rs13057714: β=1.0, P=9×10⁻⁹). SNPs located in IGSF21 were suggestive at P<10−6 (Supplementary Table 1). Each dose of the minor alleles for these SNPs increased AD liability by at least one rank unit (mean liability on the normalized scale). Based on an ad hoc power calculation using the sibling correlation of 0.2 derived from the data, the observed effect sizes and minor allele frequencies (MAF), and a genome-wide significance level of 1.46×10⁻⁷, the FHS dataset had between 60% and 95% power to obtain these results even for infrequent SNPs (0.01<MAF<0.05) (Fig 2). Among the previously known genes for AD, one genotyped SNP in BIN1 was moderately associated with the liability score (rs10180840, P=1.4×10⁻⁴). We attempted to discover additional association signals in IGSF21, ITIH3, PLXNA4, and MYO18B by evaluating 1,515 genotyped and accurately imputed SNPs (RSQ≥0.8) in the FHS dataset (Supplementary Table 2). PLXNA4 SNPs rs277470, rs277472, rs277476, and rs277484 were significant (P<10−9 for each, Fig 3A) and in complete linkage disequilibrium (LD) with each other (Fig 4). Among the top PLXNA4 SNPs, only rs277484 was genotyped. No additional SNPs from the IGSF21, ITIH3 or the MYO18B met the significance threshold of 1.4×10⁻⁷. The dose of APOE ε4 alleles was not significantly associated with the AD liability score in FHS (P=0.24), perhaps because most of the incident cases in this cohort were observed at ages where the ε4 association with AD is relatively weak.3
Fig 1. Genome-wide association analysis in the Framingham Heart Study.

(A) Ranked risk score distribution. Liability scores after adjusting for age and sex in a logistic regression model were rank-transformed and analyzed as a quantitative trait. Areas with red indicate distribution of risk (liability) rank of AD cases based on age at onset. Black arrow for age at exam from controls and red arrow for age at onset from AD cases indicate ranks of risk scores. The curve shows younger unaffected subjects have higher risk to develop AD than older unaffected subjects, and AD cases with earlier onset have greater liability than cases with older onset. (B) Quantile-quantile plot. Observed P values (Y-axis) were plotted against expected P values (X-axis). Black dots represent P values for all genotyped SNPs. (C) Manhattan plot. Association results for genotyped SNPs. P-values are expressed as −log10(P) (y-axis) for every tested SNP ordered by chromosomal location (x-axis). Genome-wide significance level is shown as a dotted line at P=1.4×10⁻⁷.
Fig 2. Power to detect genome-wide significant association with AD in the Framingham Heart Study.

Effect sizes (i.e., beta estimates in the regression model) to obtain 80% power for infrequent SNPs (0.01 ≤ minor allele frequency [MAF] ≤ 0.1) under the additive model were estimated using a sibling correlation of 0.199 in 2,779 relative pairs at the genome-wide significance level. Effect size of the SNP on AD risk (Y-axis) according to MAF (X-axis) was computed for rank-transformed liability scores. The power estimates are conservative because they account for only sib-pair relationships in the pedigree.
Fig 3. Genetic findings in the PLXNA4 region.

Regional association plots of genotyped and imputed SNPs from the FHS (A) and NIA-LOAD (B) datasets, and in meta-analysis (C). Most significant SNPs in the FHS (rs277470) and NIA-LOAD (rs12539196) datasets are indicated by purple diamonds. P-values are expressed as −log10(P) (y-axis) for every tested SNP ordered by chromosomal location (x-axis). Estimates of linkage disequilibrium (r2) of SNPs in this region with the top SNP computed using 1000 Genomes (hg19/Nov2010EUR) are shown as orange circles for r2 ≥ 0.8, yellow circles for 0.5 ≤ r2 < 0.8, light blue circles for 0.2 ≤ r2 < 0.5, and blue circles for r2 < 0.2. Recombination rates (scale on right axis) are plotted with a solid gray line. Genomic structure of PLXNA4 was determined using the NCBI database (Build 37.1). (D) Relative position of the most significantly associated SNPs in FHS and NIA-LOAD datasets in the three validated transcripts (TS1, TS2, and TS3). Exons are denoted with horizontal bars. (E) Diagrams of functional domains encoded by amino acids from the full-length (TS1) and the shorter (TS2 and TS3) transcripts. SEMA: sema_plexinA1 interacting module (exon 1–4 in TS1 and exon 1–3 in TS2 and TS3); PSI: plexin repeat (exon 4–11 in TS1); IPT: three repeats of the binding domains of plexins and cell surface receptors (exon 11–17 n TS1); PCSR: binding domain of plexins and cell surface receptors (PCSR) and related proteins (exon 17–19 in TS1); TM: transmembrane region (exon 19 in TS1); CYTO: cytoplasmic domain (exon 20–31 in TS1).
Fig 4. Linkage disequilibrium (LD, D') of top ranked SNPs.

LD was calculated in 1000 Genomes data from (A) Caucasians (CEU), (B) African Americans (AA), and (C) Asians (ASN). Top-ranked SNPs from PLXNA4 from each dataset are shown, namely rs277470, rs277472, and rs277484 in FHS; rs12539196 in NIA-LOAD, rs10273901 in ADGC Caucasians (ADGC-EA), rs75460865 in ADGC African Americans (ADGC-AA), and rs13232207 in ADGC Japanese (ADGC-JPN). The top SNP in the ADGC-AA dataset was monomorphic in both CEU and ASN populations. Five top-ranked SNPs (rs10273901, rs75460865, rs277470, rs277472, and rs277484) from the ADGC-EA and ADGC-AA samples were monomorphic in the ASN population. The top ranked SNPs are located in the SEMA domain, except rs10273901 and rs13232207 which are located in the cytoplasmic domain.
Replication and Extended Analysis of PLXNA4
Next, we tested association of 746 genotyped and accurately imputed SNPs (RSQ≥0.8) from PLXNA4 in the NIA-LOAD dataset (Fig 3B), but were unable to replicate any of the top-ranked SNPs obtained in the FHS sample (Supplementary Table 3). However, 16 of the 746 PLXNA4 SNPs showed significant association at P<10−3 in a model using the normalized liability score, and these association signals were improved using the normalized propensity score (Supplementary Table 3). We observed an association trend in the same effect direction with rs277470 in the NIA-LOAD using the propensity score (p value: FHS=2.1×10⁻¹⁰, NIA-LOAD=0.06, meta-analysis=4.1×10⁻⁸) (Fig 3C). Each dose of the minor allele C for rs277470 increased the liability rank by at least one unit in FHS dataset and the propensity rank by 13% in NIA-LOAD (Table 2). The most significant finding in NIA-LOAD (Fig 3B) was obtained with a genotyped SNP rs12539196 (p value: FHS=0.114, NIA-LOAD=3.7×10⁻⁵, meta-analysis=2.8×10⁻⁵). The minor allele C for rs12539196 decreased the liability rank by 0.09 in FHS and accounts for a 15% reduction in the propensity rank in NIA-LOAD (Table 2). The result for rs12539196 in the NIA-LOAD dataset was not meaningfully changed after adjustment for the number of APOE ε4 alleles (P=2.7×10⁻⁵) and remained significant after correction for multiple testing (P=0.0036).
Table 2.
Top-ranked SNP-based association results for PLXNA4 in the FHS and NIA-LOAD datasets
| SNP or Region | BP | RA | FHS |
NIA-LOAD |
Meta-Analysis |
|||||
|---|---|---|---|---|---|---|---|---|---|---|
| RAF | β | P-val | RAF | β | P-val | Z | P-val | |||
| rs277470 | 132,110,922 | C | 0.01 | 1.15 | 2.1×10⁻¹⁰ | 0.01 | 0.13 | 0.0616 | 5.49 | 4.1×10⁻⁸ |
| rs12539196 | 132,037,683 | A | 0.84 | 0.09 | 0.114 | 0.85 | 0.15 | 3.7×10⁻⁵ | 4.19 | 2.8×10⁻⁵ |
| SEMA Regiona | 131,925,825 – 132,193,452 | nSNP=246 | 6.3×10⁻³ | nSNP=240 | 0.019 | 3.60 | 3.2×10⁻⁴ | |||
FHS=Framingham Heart Study; NIA-LOAD=National Institute on Aging-Late Onset Alzheimer's Disease; N=sample size; BP=map position in base pairs from CRCh37/hg19; RA=reference allele; RAF=reference allele frequency; β=estimate of effect size; P-val=p value; Z=Z-score in meta-analysis; nSNP, the number of SNPs in a region based test.
Region-based test was conducted using all SNPs from 131,925,825 to 132,193,452 base pairs flanking exons 1 to 3 from three transcript isoforms on chromosome 7.
Further scrutiny of the PLXNA4 findings revealed that the most significant SNPs in each dataset are clustered in two distinct regions between recombination hot spots (Fig 3A to C), are separated by approximately 78,240 base pairs apart in intron 2 of the largest transcript (TS1), and flank an alternatively spliced exon present only in a much shorter transcript (TS3) (Fig 3D). Bioinformatic evaluation revealed that TS1 contains a transmembrane domain, whereas the shorter isoforms are predicted to be secreted (Fig 3E), suggesting that the longer and shorter isoforms may have distinct functional consequences related to AD. Based on this information, we performed region-based analyses including only SNPs located between 131,925,825 and 132,193,452 base pairs (including all of intron 2) encompassing the SEMA domain (Fig 3E), and confirmed significant association for the region (Table 2) in both datasets (p value: FHS=6.3×10⁻³; NIA-LOAD=0.019; meta-analysis=3.2×10⁻⁴).
Association with PLXNA4 was further examined using meta-analyzed results in the ADGC datasets. The most significant SNPs in each population under the additive model were rs10273901 in Caucasians (minor allele frequency [MAF]=0.42; meta-analysis p value [meta-P]=3.9×10⁻⁵; odds ratio [OR]=0.85, 95% Confidence Interval [95% CI]: 0.79–0.92), rs75460865 in African Americans (MAF=0.04; meta-P=8.0×10⁻⁴; OR=1.55, 95% CI: 1.20–2.01), and rs13232207 in Japanese (MAF=0.19; P=1.2×10⁻⁴; OR=1.51, 95% CI: 1.22–1.86). The results for the Caucasian and Japanese groups remained significant after correcting for multiple testing (P=0.013 and P=0.037, respectively). Rs75460865 is located in the portion of the sequence which encodes the SEMA domain, but rs10273901 and rs13232207 are located in the PLXNA4 region that encodes the CYTO domain (Fig 3E). Top ranked SNPs in the FHS and NIA-LOAD datasets were not associated in the other ADGC datasets (P>0.1) likely because power to detect association with several SNPs (including rs277470) having low minor allele frequencies is weaker in the ADGC datasets compared to large extended family-based samples. Because the LD structure in this region is similar across populations (Fig 4), different association peaks among these groups is consistent with the existence of multiple distinct functionally-relevant AD-related alleles. In summary, the results in each of the ADGC ethnic samples support the association of AD with PLXNA4 SNPs.
PLXNA4 Does Not Influence APP Processing or Aβ Production
To determine whether PLXNA4 isoforms are differentially involved in APP processing and Aβ production, we transfected HEK293 cells stably expressing APP751 with empty vector control (EV) or with the full-length (TS1) or one of the shorter isoforms (TS2 and TS3) of PLXNA4-Myc and analyzed total APP in cell lysates, and APPsα, Aβ40, and Aβ42 in the medium. Neither over-expressing PLXNA4 isoforms affected APPsα secretion (Fig 5A and B) or Aβ40 and Aβ42 production (Fig 5C). These results suggest that PLXNA4 is not involved in AD through the non-amyloidogenic or amyloidogenic processing of APP.
Fig 5. Effect of expression of the full-length PLXNA4 isoforms (TS1, TS2 and TS3) on APP processing.

HEK293 cells stably overexpressing APP were transiently transfected with empty vector control (EV) or with the full-length (TS1) or one of the shorter isoforms (TS2 and TS3) of PLXNA4-Myc. 48 hrs after transfection, the conditioned medium (medium) and the cell lysates (lysate) were collected and analyzed by SDS-PAGE and western blotting using mAb 6E10 for total APP and APPsα, Myc mAb for all 3 isoforms of PLXNA4, and tubulin as control (A). The endogenous myc can be seen in all lanes at ~55 kDa but more clearly in lanes 7–9 where only empty vector was transfected but not PLXNA4-myc. Also note that TS1 migrates at 212kDa, TS2 migrates at 58kDa and TS3 migrates at 55kDa. (B) Densitometric analysis of the expression of APPsα normalized to total APP. Error bars indicate standard deviation. (C) ELISA analysis of Aβ40 and Aβ42 released to the medium. ELISAs were carried out using the human Aβ40 and Aβ42 ELISA kits (Invitrogen) in accordance with manufacturer's protocol. Error bars indicate standard deviation. Representative results of three independent experiments are shown in each panel.
PLXNA4 Isoforms Differentially Affect Tau Phosphorylation
Involvement of plexin-A4 signaling in tau phosphorylation was examined by transfecting cDNAs for the full-length (TS1) or 3' C-terminal truncated short isoforms (TS2 and TS3) of human PLXNA4-Myc into SH-SY5Y P301L cells (SH-SY5Y cells stably expressing the P301L tau mutant) and stimulated with or without 3 nM recombinant Semaphorin-3A (SEMA3A-FC). Immunoblotting with AT8 (anti-phospho-Tau at Ser202/Thr205) showed that tau phosphorylation was induced by SEMA3A stimulation, which was enhanced by over-expression of TS1 (Fig 6A). In contrast, over-expression of either TS2 or TS3 inhibited tau phosphorylation under stimulation by SEMA3A (Fig 6A). Since TS2 and TS3 are secretory molecules with the SEMA3A binding site in the extracellular domain, we assume that the inhibitory effect is mediated by the competitive binding of the short isoforms to SEMA3A. Pull-down assays confirmed that the short isoforms, but not full-length PLXNA4, specifically co-precipitated with SEMA3A in the media (Fig 3B). These data demonstrate that the short isoforms are secreted as expected and bind to SEMA3A thereby inhibiting signaling. To confirm that SEMA3A/PLXNA4 signaling phosphorylates endogenous wild type tau protein, we repeated the experiment in rat primary hippocampal neurons. SEMA3A activated PLXN signaling leading to phosphorylation of endogenous CRMP2 at Thr 514 by glycogen synthase kinase-3β was confirmed in the primary cultured hippocampal neurons (Fig 6C). Stimulation of neurons with SEMA3A induced phosphorylation of endogenous tau as determined by AT8+ cells (Fig 6D, red staining in Myc− cells). Transient expression of Myc-tagged full-length PLXNA4 significantly elevated SEMA3A-induced endogenous tau phosphorylation (Myc+ AT8+ cells) as compared to untransfected neurons (Myc− AT8+ cells, p < 0.01), while expression of Myc-tagged shorter isoforms significantly reduced SEMA3A-induced tau phosphorylation in neurons (Fig 6D). This demonstrates that SEMA3A/PLXNA4 signaling phosphorylates endogenous tau in an isoform-specific manner.
Fig 6. Effect of PLXNA4 isoforms on tau phosphorylation.

(A) SH-SY5Y P301L cells were transfected with the full-length (TS1) or one of the shorter isoforms (TS2 and TS3) of PLXNA4-Myc or empty vectors (pcDNA3.1) with or without 3nM SEMA3A stimulation for 1hr. Whole cell lysates were blotted with AT8, total tau, actin and Myc. Results for the TS2 and TS3 isoforms were similar but ony those for TS3 are shown. (B) 6x His-tagged SEMA3A-Fc was precipitated from media by Protein A/G agarose, and the precipitates were immunoblotted with antibodies to Myc (detecting PLXNA4 isoforms) and 6x His (detecting SEMA3A-FC). (C) E18 rat primary hippocampal neurons were cultured for 14 days and stimulated with 3nM SEMA3A for 1 hr, and co-stained with anti-β3-tubulin (B3T) mouse monoclonal (1:500, green) and anti-pT514 CRMP2 rabbit polyclonal (1:500, red). (D) Rat primary hippocampal neurons were transfected with the full-length or short isoforms of Plexin-A4-Myc. After transfection, cells were treated with or without 3 nM Sema3A for 1-hr, and co-stained with AT8 (1:500) and anti-Myc (rabbit polyclonal, 1:200, Covance Inc). AT8 signals were digitally captured and quantified as previously reported (Uchida et al., 2005). Cells are immunostained with anti-Myc (green) and AT8 (red). Scale bar represents 10 μm. * P<0.05, ** P<0.01, and *** P<0.001, as determined by ANOVA and Tukey post hoc.
Expression of PLXNA4 in Brain is Different in AD Cases and Controls
Expression of the TS1 and TS3 was quantified in brain tissue specimens from the middle frontal gyrus (Brodmann area 9) from 19 autopsied subjects including five controls, five early-stage AD cases, and nine late-stage AD cases (Supplementary Table 4) using the primer sets shown in Supplementary Table 5. Late-stage AD cases compared to controls had 1.9-fold increased expression of TS1 (P=6.0×10⁻⁴) and a more modestly increased expression of TS3 (P=0.021) and ratio of TS1/TS3 (P=0.066) (Fig 7). These patterns were similar in the comparison of all AD cases to controls (P-value: TS1=0.003, TS3=0.097, TS1/TS3=0.18) and are not age-related (Table 3). In the combined sample of AD cases and controls, TS1 level was significantly correlated with the clinical dementia rating score (ρ=0.75, P=2.2×10⁻⁴) and several measures of AD neuropathology (ρ≈0.5, P<0.05), but the correlations of TS3 level with these traits were much smaller (Table 3). These findings suggest that elevation in TS1 level increases risk for developing AD.
Fig 7. Expression of PLXNA4 isoforms in postmortem brains.
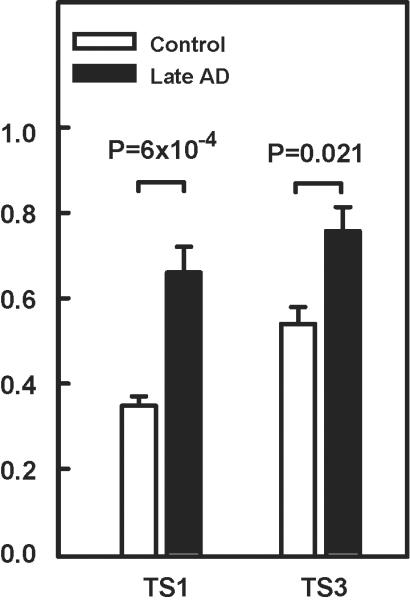
Expression of PLXNA4 isoforms from Broadmann area 9 of frozen post-mortem brain tissue specimens were compared in controls and late-stage AD cases using primer sets to detect full-length (TS1) and short (TS3) isoforms. RNA expression level (Y-axis) shown is the normalized value. P-values were determined by T-test accounting for unequal variances.
Table 3.
Correlation of PLXNA4 isoform levels with clinical and neuropathological phenotypes in brain specimens from subjects with AD and controls.
| Characteristics | Correlation (P value) |
|
|---|---|---|
| TS1 | TS2 | |
| Age | 0.27 (0.27) | 0.31 (0.20) |
|
| ||
| PMI | −0.01 (0.97) | 0.35 (0.14) |
|
| ||
| RIN | −0.09 (0.70) | −0.35 (0.14) |
| CDR | 0.75 (2.2×10⁻⁴) | 0.56 (0.014) |
| Plaque BM9 | 0.47 (0.045) | 0.24 (0.32) |
| Plaque Meanc | 0.56 (0.012) | 0.36 (0.13) |
| Braak Stage | 0.54 (0.017) | 0.55 (0.015) |
PMI=postmortem interval; RIN=RNA integrity number; CDR=clinical dementia rating; Plaque BM9=neuritic plaque density Brodmann area 9; Plaque Mean=mean of plaque densities measured in five cortical regions including Brodmann area 9 (middle frontal gyrus), Brodmann area 45/47 (orbital frontal gyrus), Brodmann area 21/22 (superior temporal gyrus), Brodmann area 39 (inferior parietal cortex), and Brodmann area 17 (calcarine cortex).
DISCUSSION
We identified significant association between AD risk and SNPs in PLXNA4 using a family-based approach. The top-ranked SNPs in the discovery and replication datasets are located in a single intron and surround an exon that is skipped in the processing of the full-length mRNA transcript. We also demonstrated that the full-length isoform (TS1), but not the shorter isoforms (TS2 and TS3) of PLXNA4 increased tau phosphorylation in SH-SY5Y cells stably expressing the P301L tau mutant and in primary rat neurons when stimulated by SEMA3A. Significantly higher levels of TS1 and TS3 in cortical brain tissue were observed in late-stage AD cases compared to controls. By comparison, transfection of either isoform into HEK293 cells stably expressing APP failed to show differential effects on APP processing or Aβ production. Taken together, our results indicate that PLXNA4-mediated tau phosphorylation is an independent upstream event leading to AD-related tangle formation in neurons.
PLXNA4 is a member of a family of receptors for transmembrane, secreted and GPI-anchored semaphorins in vertebrates31 and is a receptor for secreted semaphorin class 3 (SEMA3A) and class 6 (SEMA6) proteins which play an important role in semaphorin signaling and axon guidance.32 Accumulation of SEMA3A was previously detected in susceptible areas of the hippocampal neurons during AD progression and colocalized with phosphorylated tau.33 A phosphorylated CRMP2 protein, an intracellular signaling molecule for the semaphorin-plexin signaling pathway, has been observed in neurofibrillary tangles in brains of autopsied AD patients.34 The staining pattern of SEMA6, which is present in fibers and nerve terminals, is disrupted in brains of patients with AD.35 These reports and our study collectively indicate that disrupted semaphorin-plexin signaling is involved in AD pathogenesis, specifically through tau phosphorylation leading to tangle formation and neuronal death. Semaphorin-plexin signaling is known to regulate axon guidance in the development of sympathetic nervous system and cerebral cortex.36–38 Binding of SEMA3A to truncated PLXNA proteins was demonstrated to have a dominant negative effect on cortical growth cone collapse.39 Our data indicate that disruption of this signaling may also contribute to the acceleration of tau phosphorylation leading to neurofibrillary tangle formation. A recent whole exome sequence study identified a rare coding PLXNA4 variant in two distantly related individuals with familial Parkinson disease (PD).40 Notably, both PD subjects were cognitively impaired and there is a recognized form of PD with dementia. Further screening of all PLXNA4 exons in a large sample of unrelated PD cases and controls revealed a large number of very rare coding variants unique to cases or controls. Although the pathogenicity of these variants is yet unknown, this study provides additional evidence supporting PLXNA4 as a common biological pathway leading to AD and PD. Taken together, our findings point to a novel mechanism for AD-related tangle formation, implying that reduced expression of PLXNA4, and the TS1 isoform in particular, in brain is crucial to maintain healthy neurons.
There are three known alternatively spliced PLXNA4 transcripts. The full-length transcript (TS1) contains 31 exons and encodes an isoform with 1,894 residues. Two alternatively spliced transcripts each contain three exons yielding shorter isoforms of 522 residues (TS2) and 492 residues (TS3). The distinct PLXNA4 association peaks in the discovery and replication datasets flank an exon that is present only in TS3. A direct link of PLXNA4 expression to AD is supported by evidence in this report of increased expression of TS1 and TS3 isoforms in post-mortem neuronal tissue from AD cases compared to controls. Importantly, the findings that the relative increase of TS1 is much greater than TS3 in AD cases, and TS1 expression is significantly correlated with clinical and neuropathological severity measures of AD, are consistent with our observation of increased phosphorylation of tau by SEMA3A bound specifically to TS1.
Previous GWA studies involving the FHS dataset have successfully identified several AD genes including BIN1, MS4A4/MS4A6A, EPHA7, ABCA7, CD33, CD2AP, HLA-DRB5–HLA-DRB1, PTK2B, SLC24A4-RIN3, INPP5D, MEF2C, NME8, ZCWPW1, CELF1, FERMT2, and CASS4,4, 16, 41 but the portion of evidence for these associations attributable to the FHS dataset is very small and the robust associations with these loci are with common SNPs (MAF > 0.08) each exerting a small effect on risk (OR ≤ 1.2). We increased the potential for gene discovery in the FHS and NIA-LOAD datasets by applying an analytical method that leverages the family structure that is otherwise ignored when using Generalized Estimating Equations (GEE) models. Our approach is applicable to extended pedigrees and is robust for detecting association with infrequent SNPs (0.01≤MAF<0.1) because the power for this method is largely dependent on effect size rather than allele frequencies.11 Except for BIN1, lack of significant associations with most of the previously known AD loci suggests that they do not contain large effect variants for AD risk in the range of infrequent MAFs. In addition, we addressed phenotype misclassification by including only incident cases with known onset ages in the FHS dataset and by using the propensity score approach in the NIA-LOAD dataset which has a skewed distribution of onset ages and is enriched with familial AD cases. Our method using propensity scores as a surrogate for AD susceptibility assigned probabilities greater than 50% for future development of AD to 60% of the unaffected subjects at last exam in the NIA-LOAD cohort. This indicates that analyses using affection status in families with multiple affected members have much less power to detect true associations without adjusting for misclassification of unaffected relatives.
Our study has several caveats. Power to detect association with AD risk is low in the FHS cohort because of the small number of incident cases. We overcame this limitation by using a continuous measure of AD liability instead of AD status as the outcome. In addition, the top-ranked PLXNA4 SNPs were not the same across datasets and thus the lack of an exact replication may indicate that the initial finding was a false positive. However, the inability to replicate at the SNP level can be explained by differences in allele frequencies across populations, and low power and reliability to detect association with infrequent SNPs in samples of unrelated cases and controls. Another likely contributor to the different association patterns is allelic heterogeneity, which we observed for SORL142 and has been reported among Caucasians for other common diseases.43, 44 Nevertheless, our PLXNA4 region-based test results were significant in both FHS and NIA-LOAD datasets. Moreover, the observed effects of PLXNA4 isoforms on AD-related processes in cultured neuronal cells and brain, which were identified through experiments conducted because of the association findings, suggest that the significant results with individual PLXNA4 SNPs are not false positives. Another concern is that we did not have genotypes for the top ranked SNPs in a large sample of AD cases and controls with brain tissue available for study. As a result, we were unable to investigate allele specific effects on isoform expression levels. Moreover, demonstration of higher isoform levels in peripheral tissue of living AD cases compared to controls would lessen the concern that the differences observed in brain are not secondary to underlying pathology. In addition, in vitro tau phosphorylation experiments do not indicate which tau kinases activate tau phosphorylation. Cycline-dependent kinase 5 and glycogen synthase kinase-3β are known to be activated by SEMA3A by phosphorylating CRMP2 to mediate growth cone collapse.45, 46 It is most likely that PLXNA4 induces tau phosphorylation via activation of these two established kinases. Also, because these results are based on the transient expression of PLXNA4 molecules, it is crucial to evaluate the influence of PLXNA4 on tau phosphorylation in more physiological conditions. Isoform-specific targeting of PLXNA4 in mice is a potential future study in vivo.
In summary, our novel genetic association findings and results of molecular and cell biology experiments in cell lines, rat neurons, and human brain demonstrate that PLXNA4 is involved in AD pathogenesis. Evidence supporting transcriptional regulation of PLXNA4 isoforms that have differential effect on tau phosphorylation and, hence, tangle formation suggests the potential for a new drug target. These findings warrant follow-up experiments to delineate the upstream factors governing PLXNA4 binding to CRMP2, ascertain the causative genetic variants at the two association peaks and determine how they modulate expression of the individual isoforms, demonstrate in brain tissue that the genetic variation in PLXNA4 is associated with AD risk or progression, and evaluate the utility of PLXNA4 as a potential biomarker for AD. Further studies of PLXNA4 may also provide mechanistic evidence linking AD to PD with comorbid dementia.
Supplementary Material
ACKNOWLEDGMENTS
Supported by grants from the National Institute on Aging (R01-AG025259, PG30-AG13846, R01-AG0001, U24-AG021886, U24-AG26395, R01-AG041797 and P50-AG005138), the Brain Research Program through the National Research Foundation of Korea (NRF) funded by the Ministry of Science, ICT & Future Planning (NRF-2013M3C7A1073000), and the Evans Center for Interdisciplinary Biomedical Research (ECIBR) ARC on “Protein Trafficking and Neurodegenerative Disease” at Boston University (http://www.bumc.bu.edu/evanscenteribr/). GJ was supported by an ECIBR Fellowship Award. The results of this study were obtained using the Boston University Linux Cluster for Genetic Analysis (LinGA), which was established with support from U.S. Public Health Service Resource Grant RR163736 from the National Center for Research Resources and Boston University Department of Medicine. The HEK293 cells stably overexpressing wild type APP751 were a kind gift from Dennis J. Selkoe, Harvard Medical School, and the Myc-tagged PLXNA4 (TS1) was a kind gift from Dr. Gera Neufeld, Technion, Israel Institute of Technology.
The Framingham Heart Study is conducted and supported by the National Heart, Lung, and Blood Institute (NHLBI) in collaboration with Boston University (Contract No. N01-HC-25195). This manuscript was not prepared in collaboration with investigators of the Framingham Heart Study and does not necessarily reflect the opinions or views of the Framingham Heart Study, Boston University, or NHLBI. The authors sincerely thank to Drs. Yeunjoo Song and Robert C. Elston (Case Western Reserve University) for their technical help and advice using the S.A.G.E. software package.
Footnotes
AUTHOR CONTRIBUTIONS G.J. designed and performed the genetic association analyses and co-wrote the paper. H.A. performed the tau phosphorylation experiments. E.Z. and C-D.C. performed the amyloid-β and APP experiments. E.D. performed the PLXNA4 isoform studies in brain. J.H.P, S.K., and J.W.K. designed primer sets and tested the efficacy in blood. T.F. and R.M. ascertained, phenotyped and genotyped the NIA-LOAD Study participants. V.H. obtained and characterized the brain specimens. R.K., M.A.P-V, J.L.H, and G.D.S provided Alzheimer Disease Genetics Consortium datasets and helped interpret results. K.L.L. consulted on the statistical genetic analyses and critically evaluated the manuscript. J.D.B. supervised the PLXNA4 genotyping and isoform studies in brain and critically evaluated the manuscript. T.I. designed and supervised the tau phosphorylation experiments and assisted in the preparation of the manuscript. C.R.A. designed the amyloid-β and APP experiments and assisted in the preparation of the manuscript. L.A.F. obtained funding for the study, coordinated all components of the study, evaluated and interpreted results, and co-wrote the paper.
CONFLICTS OF INTEREST Authors declare no conflict of interest.
REFERENCES
- 1.Thies W, Bleiler L. 2011 Alzheimer's disease facts and figures. Alzheimers Dement. 2011 Mar;7(2):208–44. doi: 10.1016/j.jalz.2011.02.004. [DOI] [PubMed] [Google Scholar]
- 2.Farrer LA. Genetics and the dementia patient. Neurologist. 1997;3:13–30. [Google Scholar]
- 3.Farrer LA, Cupples LA, Haines JL, et al. Effects of age, sex, and ethnicity on the association between apolipoprotein E genotype and Alzheimer disease. A meta-analysis. APOE and Alzheimer Disease Meta Analysis Consortium. Jama. 1997 Oct 22–29;278(16):1349–56. [PubMed] [Google Scholar]
- 4.Lambert JC, Ibrahim-Verbaas CA, Harold D, et al. Meta-analysis of 74,046 individuals identifies 11 new susceptibility loci for Alzheimer's disease. Nat Genet. 2013 Dec;45(12):1452–8. doi: 10.1038/ng.2802. [DOI] [PMC free article] [PubMed] [Google Scholar]
- 5.Lill CM, Bertram L. Towards unveiling the genetics of neurodegenerative diseases. Semin Neurol. 2012 Nov;31(5):531–41. doi: 10.1055/s-0031-1299791. [DOI] [PubMed] [Google Scholar]
- 6.Paulson HL, Igo I. Genetics of dementia. Semin Neurol. 2012 Nov;31(5):449–60. doi: 10.1055/s-0031-1299784. [DOI] [PMC free article] [PubMed] [Google Scholar]
- 7.Naj AC, Jun G, Beecham GW, et al. Common variants at MS4A4/MS4A6E, CD2AP, CD33 and EPHA1 are associated with late-onset Alzheimer's disease. Nat Genet. 2011 May;43(5):436–41. doi: 10.1038/ng.801. [DOI] [PMC free article] [PubMed] [Google Scholar]
- 8.So HC, Gui AH, Cherny SS, Sham PC. Evaluating the heritability explained by known susceptibility variants: a survey of ten complex diseases. Genet Epidemiol. 2011 Jul;35(5):310–7. doi: 10.1002/gepi.20579. [DOI] [PubMed] [Google Scholar]
- 9.Manolio TA, Collins FS, Cox NJ, et al. Finding the missing heritability of complex diseases. Nature. 2009 Oct 8;461(7265):747–53. doi: 10.1038/nature08494. [DOI] [PMC free article] [PubMed] [Google Scholar]
- 10.Sherva R, Farrer LA. Power and pitfalls of the genome-wide association study approach to identify genes for Alzheimer's disease. Curr Psychiatry Rep. 2011 Apr;13(2):138–46. doi: 10.1007/s11920-011-0184-4. [DOI] [PMC free article] [PubMed] [Google Scholar]
- 11.Choi SH, Liu C, Dupuis J, Logue MW, Jun G. Using linkage analysis of large pedigrees to guide association analyses. BMC Proc. 2011 Nov 29;5(Suppl 9):S79. doi: 10.1186/1753-6561-5-S9-S79. [DOI] [PMC free article] [PubMed] [Google Scholar]
- 12.Cobb JL, Wolf PA, Au R, White R, D'Agostino RB. The effect of education on the incidence of dementia and Alzheimer's disease in the Framingham Study. Neurology. 1995 Sep;45(9):1707–12. doi: 10.1212/wnl.45.9.1707. [DOI] [PubMed] [Google Scholar]
- 13.Wijsman EM, Pankratz ND, Choi Y, et al. Genome-wide association of familial late-onset Alzheimer's disease replicates BIN1 and CLU and nominates CUGBP2 in interaction with APOE. PLoS Genet. 2011 Feb;7(2):e1001308. doi: 10.1371/journal.pgen.1001308. [DOI] [PMC free article] [PubMed] [Google Scholar]
- 14.Miyashita A, Koike A, Jun G, et al. SORL1 is genetically associated with late-onset Alzheimer's disease in Japanese, Koreans and Caucasians. PLoS One. 2013;8(4):e58618. doi: 10.1371/journal.pone.0058618. [DOI] [PMC free article] [PubMed] [Google Scholar]
- 15.Reitz C, Jun G, Naj A, et al. Variants in the ATP-binding cassette transporter (ABCA7), apolipoprotein E 4,and the risk of late-onset Alzheimer disease in African Americans. JAMA. 2013 Apr 10;309(14):1483–92. doi: 10.1001/jama.2013.2973. [DOI] [PMC free article] [PubMed] [Google Scholar]
- 16.Seshadri S, Fitzpatrick AL, Ikram MA, et al. Genome-wide analysis of genetic loci associated with Alzheimer disease. Jama. 2010 May 12;303(18):1832–40. doi: 10.1001/jama.2010.574. [DOI] [PMC free article] [PubMed] [Google Scholar]
- 17.Jun G, Naj AC, Beecham GW, et al. Meta-analysis confirms CR1, CLU, and PICALM as alzheimer disease risk loci and reveals interactions with APOE genotypes. Arch Neurol. 2010 Dec;67(12):1473–84. doi: 10.1001/archneurol.2010.201. [DOI] [PMC free article] [PubMed] [Google Scholar]
- 18.Li Y, Abecasis GR. Mach 1.0: Rapid Haplotype Reconstruction and Missing Genotype Inference. Am J Hum Genet. 2006;S79:2290. [Google Scholar]
- 19.Jun G, Moncaster JA, Koutras C, et al. Delta-catenin is genetically and biologically associated with cortical cataract and future Alzheimer-related structural and functional brain changes. PLoS One. 2012;7(9):e43728. doi: 10.1371/journal.pone.0043728. [DOI] [PMC free article] [PubMed] [Google Scholar]
- 20.Hanson RL, Knowler WC. Analytic strategies to detect linkage to a common disorder with genetically determined age of onset: diabetes mellitus in Pima Indians. Genet Epidemiol. 1998;15(3):299–315. doi: 10.1002/(SICI)1098-2272(1998)15:3<299::AID-GEPI7>3.0.CO;2-#. [DOI] [PubMed] [Google Scholar]
- 21.Jiang Y, Zhang H. Propensity score-based nonparametric test revealing genetic variants underlying bipolar disorder. Genet Epidemiol. 2011 Feb;35(2):125–32. doi: 10.1002/gepi.20558. [DOI] [PMC free article] [PubMed] [Google Scholar]
- 22.Schnell AH, Sun X, Igo RP, Jr, Elston RC. Some capabilities for model-based and model-free linkage analysis using the program package S.A.G.E. (Statistical Analysis for Genetic Epidemiology) Hum Hered. 2011;72(4):237–46. doi: 10.1159/000331672. [DOI] [PMC free article] [PubMed] [Google Scholar]
- 23.Jun G, Guo H, Klein BE, et al. EPHA2 is associated with age-related cortical cataract in mice and humans. PLoS Genet. 2009 Jul;5(7):e1000584. doi: 10.1371/journal.pgen.1000584. [DOI] [PMC free article] [PubMed] [Google Scholar]
- 24.Morris NJ, Elston R, Stein CM. Calculating asymptotic significance levels of the constrained likelihood ratio test with application to multivariate genetic linkage analysis. Stat Appl Genet Mol Biol. 2009;8(1):Article 39. doi: 10.2202/1544-6115.1456. [DOI] [PMC free article] [PubMed] [Google Scholar]
- 25.Wang T, Elston RC. Two-level Haseman-Elston regression for general pedigree data analysis. Genet Epidemiol. 2005 Jul;29(1):12–22. doi: 10.1002/gepi.20075. [DOI] [PubMed] [Google Scholar]
- 26.Liu JZ, McRae AF, Nyholt DR, et al. A versatile gene-based test for genome-wide association studies. Am J Hum Genet. 2010 Jul 9;87(1):139–45. doi: 10.1016/j.ajhg.2010.06.009. [DOI] [PMC free article] [PubMed] [Google Scholar]
- 27.Willer CJ, Li Y, Abecasis GR. METAL: fast and efficient meta-analysis of genomewide association scans. Bioinformatics. 2010 Sep 1;26(17):2190–1. doi: 10.1093/bioinformatics/btq340. [DOI] [PMC free article] [PubMed] [Google Scholar]
- 28.So PP, Zeldich E, Seyb KI, et al. Lowering of amyloid beta peptide production with a small molecule inhibitor of amyloid-beta precursor protein dimerization. Am J Neurodegener Dis. 2012;1(1):75–87. [PMC free article] [PubMed] [Google Scholar]
- 29.Sato S, Xu J, Okuyama S, et al. Spatial learning impairment, enhanced CDK5/p35 activity, and downregulation of NMDA receptor expression in transgenic mice expressing tau-tubulin kinase 1. J Neurosci. 2008 Dec 31;28(53):14511–21. doi: 10.1523/JNEUROSCI.3417-08.2008. [DOI] [PMC free article] [PubMed] [Google Scholar]
- 30.Haroutunian V, Perl DP, Purohit DP, et al. Regional distribution of neuritic plaques in the nondemented elderly and subjects with very mild Alzheimer disease. Arch Neurol. 1998 Sep;55(9):1185–91. doi: 10.1001/archneur.55.9.1185. [DOI] [PubMed] [Google Scholar]
- 31.Tamagnone L, Artigiani S, Chen H, et al. Plexins are a large family of receptors for transmembrane, secreted, and GPI-anchored semaphorins in vertebrates. Cell. 1999 Oct 1;99(1):71–80. doi: 10.1016/s0092-8674(00)80063-x. [DOI] [PubMed] [Google Scholar]
- 32.Suto F, Ito K, Uemura M, et al. Plexin-a4 mediates axon-repulsive activities of both secreted and transmembrane semaphorins and plays roles in nerve fiber guidance. J Neurosci. 2005 Apr 6;25(14):3628–37. doi: 10.1523/JNEUROSCI.4480-04.2005. [DOI] [PMC free article] [PubMed] [Google Scholar]
- 33.Good PF, Alapat D, Hsu A, et al. A role for semaphorin 3A signaling in the degeneration of hippocampal neurons during Alzheimer's disease. J Neurochem. 2004 Nov;91(3):716–36. doi: 10.1111/j.1471-4159.2004.02766.x. [DOI] [PubMed] [Google Scholar]
- 34.Cole AR, Knebel A, Morrice NA, et al. GSK-3 phosphorylation of the Alzheimer epitope within collapsin response mediator proteins regulates axon elongation in primary neurons. J Biol Chem. 2004 Nov 26;279(48):50176–80. doi: 10.1074/jbc.C400412200. [DOI] [PMC free article] [PubMed] [Google Scholar]
- 35.Hirsch E, Hu LJ, Prigent A, et al. Distribution of semaphorin IV in adult human brain. Brain Res. 1999 Mar 27;823(1–2):67–79. doi: 10.1016/s0006-8993(99)01103-8. [DOI] [PubMed] [Google Scholar]
- 36.Low LK, Liu XB, Faulkner RL, Coble J, Cheng HJ. Plexin signaling selectively regulates the stereotyped pruning of corticospinal axons from visual cortex. Proc Natl Acad Sci U S A. 2008 Jun 10;105(23):8136–41. doi: 10.1073/pnas.0803849105. [DOI] [PMC free article] [PubMed] [Google Scholar]
- 37.Sasaki Y, Cheng C, Uchida Y, et al. Fyn and Cdk5 mediate semaphorin-3A signaling, which is involved in regulation of dendrite orientation in cerebral cortex. Neuron. 2002 Aug 29;35(5):907–20. doi: 10.1016/s0896-6273(02)00857-7. [DOI] [PubMed] [Google Scholar]
- 38.Waimey KE, Huang PH, Chen M, Cheng HJ. Plexin-A3 and plexin-A4 restrict the migration of sympathetic neurons but not their neural crest precursors. Dev Biol. 2008 Mar 15;315(2):448–58. doi: 10.1016/j.ydbio.2008.01.002. [DOI] [PMC free article] [PubMed] [Google Scholar]
- 39.Takahashi T, Fournier A, Nakamura F, et al. Plexin-neuropilin-1 complexes form functional semaphorin-3A receptors. Cell. 1999 Oct 1;99(1):59–69. doi: 10.1016/s0092-8674(00)80062-8. [DOI] [PubMed] [Google Scholar]
- 40.Schulte EC, Stahl I, Czamara D, et al. Rare variants in PLXNA4 and Parkinson's disease. PLoS One. 2013;8(11):e79145. doi: 10.1371/journal.pone.0079145. [DOI] [PMC free article] [PubMed] [Google Scholar]
- 41.Hollingworth P, Harold D, Sims R, et al. Common variants at ABCA7, MS4A6A/MS4A4E, EPHA1, CD33 and CD2AP are associated with Alzheimer's disease. Nat Genet. 2011 May;43(5):429–35. doi: 10.1038/ng.803. [DOI] [PMC free article] [PubMed] [Google Scholar]
- 42.Rogaeva E, Meng Y, Lee JH, et al. The neuronal sortilin-related receptor SORL1 is genetically associated with Alzheimer disease. Nat Genet. 2007 Feb;39(2):168–77. doi: 10.1038/ng1943. [DOI] [PMC free article] [PubMed] [Google Scholar]
- 43.Schulze TG, Detera-Wadleigh SD, Akula N, et al. Two variants in Ankyrin 3 (ANK3) are independent genetic risk factors for bipolar disorder. Mol Psychiatry. 2009 May;14(5):487–91. doi: 10.1038/mp.2008.134. [DOI] [PMC free article] [PubMed] [Google Scholar]
- 44.Voight BF, Scott LJ, Steinthorsdottir V, et al. Twelve type 2 diabetes susceptibility loci identified through large-scale association analysis. Nat Genet. 2010 Jul;42(7):579–89. doi: 10.1038/ng.609. [DOI] [PMC free article] [PubMed] [Google Scholar]
- 45.Arimura N, Menager C, Kawano Y, et al. Phosphorylation by Rho kinase regulates CRMP-2 activity in growth cones. Mol Cell Biol. 2005 Nov;25(22):9973–84. doi: 10.1128/MCB.25.22.9973-9984.2005. [DOI] [PMC free article] [PubMed] [Google Scholar]
- 46.Brown M, Jacobs T, Eickholt B, et al. Alpha2-chimaerin, cyclin-dependent Kinase 5/p35, and its target collapsin response mediator protein-2 are essential components in semaphorin 3A-induced growth-cone collapse. J Neurosci. 2004 Oct 13;24(41):8994–9004. doi: 10.1523/JNEUROSCI.3184-04.2004. [DOI] [PMC free article] [PubMed] [Google Scholar]
Associated Data
This section collects any data citations, data availability statements, or supplementary materials included in this article.