

Abstract
Cognitive control plays an important role in goal-directed behavior, but dynamic brain mechanisms underlying it are poorly understood. Here, using multisite fMRI data from over 100 participants, we investigate causal interactions in three cognitive control tasks within a core Frontal-Cingulate-Parietal network. We found significant causal influences from anterior insula (AI) to dorsal anterior cingulate cortex (dACC) in all three tasks. The AI exhibited greater net causal outflow than any other node in the network. Importantly, a similar pattern of causal interactions was uncovered by two different computational methods for causal analysis. Furthermore, the strength of causal interaction from AI to dACC was greater on high, compared with low, cognitive control trials and was significantly correlated with individual differences in cognitive control abilities. These results emphasize the importance of the AI in cognitive control and highlight its role as a causal hub in the Frontal-Cingulate-Parietal network. Our results further suggest that causal signaling between the AI and dACC plays a fundamental role in implementing cognitive control and are consistent with a two-stage cognitive control model in which the AI first detects events requiring greater access to cognitive control resources and then signals the dACC to execute load-specific cognitive control processes.
Keywords: brain network, connectivity, fMRI, human, temporal dependence
Introduction
Humans have a remarkable capacity for flexible goal-directed behaviors. These behaviors depend on dynamic cognitive control processes for selectively enhancing task-relevant information, allocating attentional resources, suppressing inappropriate, and facilitating appropriate behavioral responses (Robbins 1996; Posner and DiGirolamo 1998; Miller and Cohen 2001; Gazzaley and Nobre 2012; Hofmann et al. 2012). Although brain areas underlying cognitive control have been extensively studied in the past decade, little is known about dynamic causal mechanisms underlying cognitive control as most previous research has focused on localization of brain function and magnitude of signal change within specific brain regions. Here, we use a novel neurocognitive systems analysis to investigate causal interactions within a core Frontal-Cingulate-Parietal network across 3 cognitive control studies from multiple sites.
Cognitive control refers to mechanisms responsible for guiding behavior and thought in accordance with current goals and intentions (Miller and Cohen 2001; O'Reilly et al. 2010). Cognitive control processes play a critical role in orienting attention, detecting conflict, inhibiting prepotent responses, and switching between tasks in response to changing goals. A number of experimental paradigms have been used to investigate the neural basis of cognitive control in the human brain. Among the most widely used are the Stop-Signal, Go/NoGo, Flanker, Stroop, and antisaccade tasks (see Fig. 1 for examples). Despite variations in stimulus and design, a common feature of these tasks is that each requires detection of a novel conflicting or countermanding event, suppression or override of prepotent cognitive and motor processes, and initiation of a new goal-relevant behavior.
Figure 1.

Task design. Illustration of the 3 cognitive control tasks. For the purpose of visualization, the figure for each task design was regenerated based on the stimuli and parameters described in the original publication. (A) SST1 (Xue et al. 2008)—participants are required to make left/right button presses (right index/middle finger) in response to letter “T”/”D” and try to stop the response if a beep is played. (B) Flanker (Kelly et al. 2008)—participants are required to make left/right button presses (right index/middle finger) in response to the direction of the central arrow. (C) SST2 (Zhang and Li 2012)—participants are required to make button presses (right index finger) in response to a circle and attempt to stop the response if an “X” is displayed. SST, stop-signal task.
There is growing evidence to suggest that these cognitive control tasks engage a common set of brain areas, most prominently the anterior insula (AI), ventrolateral prefrontal cortex (VLPFC), dorsal anterior cingulate cortex (dACC), dorsolateral prefrontal cortex (DLPFC), and posterior parietal cortex (PPC) (Buchsbaum et al. 2005; Wager et al. 2005; Levy and Wagner 2011; Swick et al. 2011; Cai et al. 2014). Furthermore, resting-state fMRI studies have pointed to these regions as forming a core intrinsically connected Frontal-Cingulate-Parietal network, which interact to implement different aspects of cognitive control in the human brain (Dosenbach et al. 2006; Menon and Uddin 2010). Studies using independent component analysis (ICA) have suggested that the Frontal-Cingulate-Parietal task network can be dissociated into 2 distinct intrinsic networks, a salience detection network and a central executive network (Seeley et al. 2007). Both the salience detection network, anchored in the AI, the adjoining VLPFC, and ACC, and the central executive network, anchored in the DLPFC and PPC, are important for implementing goal-directed behavior across a wide range of cognitive tasks (Dosenbach et al. 2006; Seeley et al. 2007; Sridharan et al. 2008; Menon and Uddin 2010; Menon 2011; Uddin et al. 2011; Supekar and Menon 2012). How these 2 systems implement cognitive control is unclear.
Critically, it is not known whether cognitive control relies on similar dynamic mechanisms operating within the same brain areas across different task contexts. Despite increasing support for the view that high-order cognitive functions, and cognitive control in particular, emerge as a result of dynamic interactions between distributed brain regions (Roebroeck et al. 2005; Bressler and Menon 2010), no studies have systematically investigated causal interactions within the same core network across different cognitive control tasks. A consistent network approach for characterizing common causal mechanisms within task-relevant Frontal-Cingulate-Parietal regions is important not only for understanding fundamental brain mechanisms underlying cognitive control, but also for creating a template that will facilitate a deeper understanding of several psychiatric and neurological disorders that are characterized by deficits in cognitive control (Menon 2011).
In the present study, we address a fundamental, and heretofore unaddressed, question in cognitive neuroscience: Are there common dynamic causal mechanisms and brain networks underlying different types of tasks commonly employed to investigate cognitive control? We selected three fMRI studies, including two from OpenfMRI.org, a public fMRI database—a Stop-signal task (SST1; Xue et al. 2008) and a Flanker task (Kelly et al. 2008)—and another Stop-signal task (SST2) acquired from over 59 participants at Yale University (Zhang and Li 2012). The stop-signal task has been extensively used to investigate response inhibition and inhibitory control processes (Logan et al. 1984; Verbruggen and Logan 2008). The flanker task is widely used to investigate response competition and conflict monitoring (Ullsperger and von Cramon 2001; Chambers et al. 2007). Both paradigms capture processes crucial for cognitive control. The data were collected from three institutions, UCLA, NYU Child Study Center, and Yale School of Medicine, including more than 100 adults in total. The recent meta-analysis by Button et al. (2013) reminds us that “Improving reproducibility in neuroscience is a key priority.” Surprisingly, they found that statistical power fell within the abysmal range of approximately 8% to 25% in most neuroimaging studies. Our study is a significant step forward, because it demonstrates strong and reliable effects across different studies from multiple sites.
Figure 1 illustrates the task paradigms and Table 1 summarizes critical study details. For each task, we estimated causal interactions within a common predefined Frontal-Cingulate-Parietal network using two different quantitative methods. The Frontal-Cingulate-Parietal network was composed of five regions of interest (ROIs) within the dACC, AI, DLPFC, VLPFC, and PPC (Fig. 2). Critically, ROIs were selected independently of the tasks and were based on the salience and central executive networks, two intrinsic brain networks that can be readily identified using resting-state fMRI data (Sridharan et al. 2008).
Table 1.
Task 1: Task information
| Task | Number of subjects | Task design | TR (s) |
|---|---|---|---|
| SST1a | 19 | fast-jitter (average ITI = 1 s) | 2 |
| Flankerb | 25 | slow-jitter (average ITI = 12 s) | 2 |
| SST2c | 59 | jittered fixation = 1–5 s ITI = 2 s | 2 |
Figure 2.
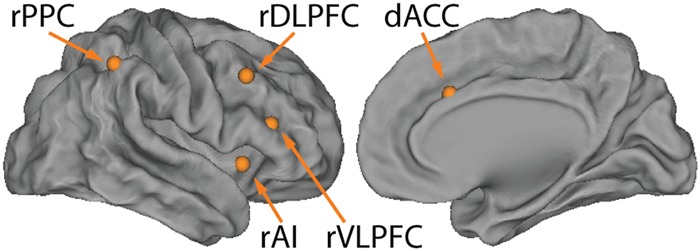
Anatomical locations of the five ROIs in the right hemisphere. ROIs were selected independently of the cognitive control tasks and were based on the salience and central executive networks, two intrinsic brain networks identified using a resting-state fMRI dataset. ROIs include dACC (x = 7, y = 18, z = 33, MNI coordinates), right anterior insula (rAI; x = 37, y = 16, z = −2), right dorsolateral prefrontal cortex (rDLPFC; x = 50, y = 18, z = 44), right ventrolateral prefrontal cortex (rVLPFC; x = 42, y = 26, z = 14), and right posterior parietal cortex (rPPC; x = 48, y = −52, z = 50).
Here, we apply a novel multivariate dynamical systems (MDSs) approach to estimate causal interactions between multiple brain regions (Ryali et al. 2011). MDS uses a state-space model for estimating causal interactions in fMRI time series and has several key advantages compared with traditional methods such as Granger causal analysis (GCA) and dynamic causal modeling (DCM) (Friston et al. 2003; Seth 2010). All three methods rely on predicting current task-evoked responses from the past (Granger 1969; Friston et al. 2003; Seth 2010; Ryali et al. 2011). Crucially, like DCM, MDS estimates causal interactions in latent neuronal signals, rather than the recorded fMRI signals, after taking into account interregional variations in hemodynamic response but, unlike DCM, does not require testing a large number of models (Ryali et al. 2011). Moreover, MDS can estimate trial-specific effects allowing us to investigate how the strength of causal interactions is modulated by increasing demands for cognitive control. Extensive computer simulations have demonstrated that MDS can accurately estimate causal interactions in fMRI data (Ryali et al. 2011).
We used MDS to investigate whether there are common patterns of causal interactions in the three cognitive control studies. Building on our previous work using a visual attention “oddball” task (Sridharan et al. 2008), we predicted that the right AI would emerge as a hub mediating causal interactions in the salience and executive control networks across all three cognitive control tasks. We then conducted trial-specific causal analyses and predicted that the strength of causal influences from the AI to other nodes of the Frontal-Cingulate-Parietal network would increase with cognitive control demand. In contrast to most previous studies which have primarily focused on the dACC and VLPFC, our results suggest that the AI, a key node of the salience network, plays the most critical role in implementing cognitive control. We also conducted additional analyses using GCA and DCM to provide converging evidence for a common dynamic causal mechanism during cognitive control. Our findings provide novel insights into a fundamental mechanism underlying cognitive control in the human brain.
Materials and Methods
Ethics Statement
All datasets used in the current study were approved by their local Institutional Review Boards (IRB).
Data Access and Selection Criteria
Two datasets were obtained from a public fMRI database—OpenfMRI (http://openfmri.org, Texas Advanced Computing Center, the University of Texas at Austin). All datasets were approved for public distribution by their local IRBs. All data had been deidentified by removing subject identities and facial features in MRI data.
Four criteria were applied for choosing datasets: 1) The data were previously published in peer-reviewed journals, 2) the task could be used to study cognitive control, 3) the dataset had a sample size of at least 15 subjects, and 4) TR in functional image acquisition protocol was at most 2 s to allow reliable estimation of causal interactions at the group level (Schippers et al. 2011). Two datasets were finally selected (Fig. 1 and Table 1): a stop-signal task (SST1 [Xue et al. 2008], 19 subjects) and a flanker task (Flanker, [Kelly et al. 2008], 25 subjects). One hallmark of cognitive control is being able to withhold or override an automatic, habitual, or prepotent response, thought, or urge. Both the stop-signal and flanker paradigms have been widely used in studying cognitive control (Chambers et al. 2007).
To replicate our findings in a large sample dataset, we obtained another dataset from Yale University School of Medicine. The study was approved by the Yale University IRB. This dataset has been published in peer-review journals (Zhang and Li 2012); it is a stop-signal task (SST2); there are 59 subjects and TR is 2 s; and it meets the above criteria.
Behavioral Paradigm
Here, we provide brief description of each of the three cognitive control tasks. Other details can be found in the original publications (Kelly et al. 2008; Xue et al. 2008; Zhang and Li 2012). Also see Figure 1 for illustration of the task designs.
Stop-Signal Task 1—SST1
In the SST1 (Xue et al. 2008), subjects made button-press response to a letter “T” or “D” (Go signal). In 25% of trials, the letter was followed by a beep (Stop signal) and subjects attempted to stop their responses. The stop-signal delay (SSD) varied dynamically in a stepwise procedure. If the subject successfully stopped on a stop trial, the SSD increased by 50 ms on the next stop trial. If the subject failed to stop on a stop trial, the SSD decreased by 50 ms on the next stop trial. Eight SSDs used in the fMRI experiment were generated based on the average SSD in the practice session ±60/20 ms.
Flanker Task—Flanker
In the Flanker, subjects made button-press responses to the direction of the central arrow within an array of arrows. Arrows in one array may point to the same direction (congruent trial) or to the different directions (incongruent trial).
Stop-Signal Task 2—SST2
In the SST2, subjects made button-press responses to a circle (Go signal), which was occasionally (∼25% of trials) followed by an “X” (Stop signal). If the stop signal was presented, subjects needed to stop their responses. The SSD varied dynamically in a stepwise procedure. If the subject successfully stopped on a stop trial, the SSD increased by 67 ms on the next stop trial. If the subject failed to stop on a stop trial, the SSD decreased by 67 ms on the next stop trial.
fMRI Preprocessing
Identical preprocessing steps were applied to each of the three datasets using SPM8 (http://www.fil.ion.ucl.ac.uk/spm/software/spm8). We first conducted slice-timing correction, because functional images were acquired in an interleaved fashion. Functional images were then realigned to correct rigid body motion. Subjects whose maximum displacement in any run is >1 voxel were discarded. Images were then normalized to the Montreal Neurological Institute (MNI) space and smoothed using a 5-mm full-width half-maximum 3D Gaussian kernel.
General Linear Model
A general linear model (GLM) analysis was first conducted to 1) confirm that the preprocessing procedures in our study led to similar activation patterns as in the original publications and 2) examine common brain activation patterns across these studies. The following regressors were used for each study.
The SST1 and SST2 included four regressors: Go, Successful Stop (SuccStop), Unsuccessful Stop, and non-interest (Go-error) trials. The contrast of interest was “SuccStop - Go.”
The Flanker task included three regressors: Congruent, Incongruent, and non-interest (error) trials. The contrast of interest was “Incongruent – Congruent.”
Six motion parameters were entered as covariates and regressed out as effects of no interest. A combined activation threshold (P < 0.05, FDR corrected) and a cluster threshold (cluster size >10 voxels) was applied to test for significance of whole-brain activation.
To investigate common neural substrates underlying the cognitive control across different studies, we applied a propositional logical “AND” operation on the group-level suprathreshold activation maps from each of the three contrasts described above. Specifically, all activation maps were first thresholded (P < 0.05, FDR corrected and cluster size >10 voxels) and then binarized (1 for suprathreshold voxels and 0 for others). The binarized activation maps were then multiplied so that only voxels that were significant across all studies survived.
Regions of Interest
ROIs were built using ICA on an independent resting-state dataset. ICA is a model-free, data-driven approach and has the flexibility to identify various independent spatial patterns and their associated temporal fluctuations (Beckmann et al. 2005). Critically, ROIs were selected independently of the task-fMRI datasets we examined, thus facilitating comparison between tasks and studies in an unbiased and principled manner. Additionally, it has been demonstrated that task-evoked brain networks can be similarly detected using ICA on resting-state fMRI (Smith et al. 2009; also see Supplementary Fig. S4). The same approach has been successfully applied to select ROIs in several previous studies (Sridharan et al. 2008; Uddin et al. 2011; Supekar and Menon 2012).
Twenty-two adults (11 males, 11 females, 19–22 years old) participated in the independent resting-fMRI session. All provided written informed consent. The study was approved by the Stanford University Institutional Review Board.
The same image preprocessing steps applied to task-fMRI datasets were applied to the resting-fMRI data. Each participant's smoothed, normalized images were concatenated across time to form a 4-dimensional matrix using FSL 3.3 (FMRIB's Software Library, www.fmrib.ox.ac.uk/fsl). This 4-dimensional matrix was then analyzed with FSL 4.4 MELODIC (Multivariate Exploratory Linear Decomposition into Independent Component) and concatenated across participants. Insula-cingulate and frontal-parietal networks were selected using previously validated methods (Greicius et al. 2004). Given the right hemispheric dominance in this class of cognitive control studies (Levy and Wagner 2011; Swick et al. 2011), we first selected peaks in the right hemisphere from ICA clusters, including dorsal ACC (x = 7, y = 18, z = 33), AI (x = 37, y = 16, z = −2), DLPFC (x = 50, y = 18, z = 44), VLPFC (x = 42, y = 26, z = 14), and PPC (x = 48, y = −52, z = 50). After selecting a voxel with the highest Z score within each cluster, the ROIs were constructed as spheres of 6 mm radius using Marsbar (http://marsbar.sourceforge.net). Details of ROI determination procedure can be found in our previous publication (Supekar and Menon 2012). To examine whether a similar causal mechanism exists in the left hemisphere, we built another set of corresponding ROIs in the left hemisphere except the dACC, including AI (x = −34, y = 20, z = −8), DLPFC (x = −46, y = 20, z = 44), VLPFC (x = −42, y = 26, z = 14), and PPC (x = −40, y = −56, z = 44).
These AI ROIs were localized to the dorsal aspects of the AI (Touroutoglou et al. 2012; Ryali et al. 2013, 2015). To further investigate the specificity of our findings with respect to the dorsal and ventral subdivisions of the AI, we conducted several additional analyses as described in the Supplementary Material.
Time Series Extraction
MarsBar was used to extract the 1st eigenvector from the preprocessed fMRI 4D data for each ROI. The original time series extracted from the ROI has a dimension of T × N, where T is the number of scans/time points and N is the number of voxels in the ROI. Singular value decomposition (SVD) is applied on the ROI time series matrix, and the resultant 1st eigenvector corresponding to the first principal component is extracted to represent the signals of interest within the ROI. The output was a T × 1 vector. We used the first eigenvector instead of mean signal within the ROI to reduce noise in potentially heterogeneous ROIs.
Causal Analysis
We used MDS to investigate causal interactions within the Frontal-Cingulate-Parietal network in each study. Secondary analyses were carried out using GCA and DCM, two other widely used approaches for estimating causal interactions in fMRI data. Note that although both MDS and GCA can examine nontrial-specific causal interaction, MDS has the additional ability to simultaneously model trial-specific causal interactions. Here we provide brief descriptions of each method. The details of these methods can be found in the original publications (Granger 1969; Roebroeck et al. 2005; Seth 2010; Ryali et al. 2011). Causal analyses, as measured by MDS and GCA, assess how well the current signal at a given node can be predicted from signals at previous time points in other nodes of the network. No specific temporal relationship between signals can be construed from this analysis. To address the question of temporal precedence, we conducted latency analysis as described in the Supplementary Material.
Multivariate Dynamical Systems
MDS is a state-space model consisting of a state equation to model the latent “neuronal-like” (quasi neuronal) states of the dynamic network and an observation equation to model BOLD-fMRI signals as a linear convolution of latent neural dynamics and hemodynamic responses (Ryali et al. 2011). MDS estimates both intrinsic and experimentally modulated causal interactions between brain regions while accounting for variations in hemodynamic responses in these regions.
The state equation in MDS is a multivariate linear difference equation or a first-order multivariate auto regressive (MVAR) model that defines the state dynamics
| (1) |
The model for the observed BOLD responses is a linear convolution model
| (2) |
| (3) |
In Equation (1), s(t) is a M×1 vector of latent signals at time t of M regions. Cj is an M×M connection matrix ensued by modulatory input vj(t), J is the number of modulatory inputs. The non-diagonal elements of Cj represent the coupling of brain regions in the presence of modulatory input vj(t). C(m,n) denotes the strength of causal connection from n-th region to m-th region. is an state noise vector that is assumed to be Gaussian distribution with covariance matrix . Additionally, state noise vector at time instances 1, 2, …, T () is assumed to be identical and independently distributed (iid). Equation (1) represents the time evolution of latent signals in M brain regions. The latent dynamics modeled in equation (1) gives rise to the observed fMRI time series represented by equation (3).
We model the fMRI time series in region m as a linear convolution of HRF and latent signal in that region. To represent this linear convolution model as an inner product of 2 vectors, the past L values of are stored as a vector. in equation (2) represents an vector with L past values of latent signal at mth region.
In equation (3), is the observed BOLD signal at time instance t for mth region. is a matrix whose rows contain bases for the HRF. Here, we use the canonical HRF and its time derivative as bases, as is common in most fMRI studies. is a coefficient vector representing the weights for each basis function in explaining the observed BOLD signal . Therefore, the HRF in the mth region is represented by the product The BOLD response in this region is obtained by convolving the HRF with the L past values of the region's latent signal and is represented mathematically by the vector inner product Uncorrelated observation noise with zero mean and variance is then added to generate the observed signal . is also assumed to be uncorrelated with , at all t.
Equations (1–3) together represent a state-space model for estimating the causal interactions in latent signals based on observed multivariate fMRI time series. This model can be seen as an extension of GCA wherein a VAR model for latent, rather than BOLD-fMRI, signals is used to model the causal interactions among brain regions. Furthermore, MDS model also takes into account variations in HRF while estimating causal interactions between the brain regions.
Estimating causal interactions between M regions specified in the model is equivalent to estimating the parameter . To estimate , the other unknown parameters, Q, , and and the latent signal based on the observations , where T is the total number of time samples and S is number of subjects, need to be estimated.
We used a nonparametric procedure to infer statistically significant causal interactions estimated by MDS (Uddin et al. 2011; Supekar and Menon 2012). Specifically, for each individual, we generated an instance of surrogate data by first applying a Fourier transform to each ROI time series, randomizing the phase of the transformed signal and then applying an inverse Fourier transform (Prichard and Theiler 1994). This procedure has the advantage that the magnitude spectrum of the data is preserved while any causal interactions between various regions are eliminated. MDS is then applied on the surrogate data to estimate causal interaction. The above procedure was repeated on 500 independently generated instances of surrogate data for each subject. At the group level, the median MDS value across subjects for each link and each instance of surrogate data was computed. The 500 median MDS estimations served as the empirical null distribution from which a P-value for each causal link was obtained. Finally, FDR correction (P < 0.05) was applied to correct for multiple comparisons.
We also modeled high and low cognitive control trials to estimate trial-specific causal networks. For the Flanker task, Congruent trials were modeled as low cognitive control trials, whereas Incongruent trials were high cognitive control trials. For the SST1 and SST2 tasks, Go trials were modeled as low cognitive control trials, whereas Stop trials were modeled as high cognitive control trials. We combined Successful and Unsuccessful Stop trials to increase samples for high cognitive control trials in the SST1 and SST2 tasks. Since, even after combination, the ratio of Stop versus Go trials is 1:3, Go trials were further randomly and equally split into three subgroups to balance the samples between Go and Stop trials. Then MDS was applied to estimate causal interactions on Stop trials as well as three subgroups of Go trials in the SST1 and SST2 tasks, or on Congruent and Incongruent trials in the Flanker task. The median of MDS estimation from the three subgroups of Go trials was used to compare with Stop trials. A permutation procedure was used to infer statistically significant causal links that differ between two types of trials. Specifically, in each permutation, trial labels (high vs. low) were randomly exchanged with a probability of 0.5 for each subject. Then, the difference between relabeled MDS causal strengths was computed for each subject, and the median of the causal strengths difference across all subjects was calculated. Median values of causal strength difference from 500 permutations were used to construct the empirical null distribution from which a P-value for each causal link was obtained. Finally, FDR correction (P < 0.05) was applied to correct for multiple comparisons to determine the causal links that show significantly greater causal interaction on high compared with low cognitive control trials.
Identifying Common Patterns of Causal Interactions
A logical “AND” operation was applied at the group level across the three tasks to identify common causal interactions in the Frontal-Cingulate-Parietal network. MDS results were first thresholded (P < 0.05, FDR corrected) and binarized (1 for significant causal influences 0 for others). The binarized results were multiplied to identify causal influences that were significant across all three tasks.
Graph-Theoretical Network Analysis
Graph-theoretical Network Analysis was used to evaluate the overall causal influence of each node in the networks identified by MDS and GCA. First, we estimated inflow and outflow degree of each node within the network for each subject. Inflow degree was determined by the number of significant causal inflow connections to a node from any other node in the network. Outflow degree was determined by the number of significant causal outflow connections from a node to any other node in the network. We then calculated Net Causal Outflow degree of each node for each subject, which is the difference between outflow degree and inflow degree. A positive value indicates that the node executes greater causal influence on other nodes than others influence it, whereas a negative value indicates that the node is more influenced by other nodes than it influences others. Note that a causal interaction map portrays significant causal influence from one node to another on each edge, whereas Net Causal Outflow indicates the overall causal drive from each node to all other nodes in the network.
Concretely, the Outflow and Inflow degree of each node was first calculated for each subject by counting how many estimated out- or in-direction causal influence from or to each node was highly unlikely under the null distribution (generated by 500 bootstrapped samples, see above) of estimated causal interaction in the network. Then, the Net Causal Outflow was computed for each node for each subject. Lastly, we tested whether the Net Causal Outflow of the AI is significantly greater than any other nodes using paired t-test with Bonferroni multiple comparison correction.
Granger Causal Analysis
Multivariate GCA was performed in accordance with the methods of Seth (2010). At the individual level, the first eigenvector from each ROI was first extracted for all subjects. Each time series was then detrended, demeaned, and normalized by its standard deviation. A multivariate vector autoregressive model was fitted using ROI time series from each subject. The optimal model order for each subject was determined using the Bayesian information criterion. To estimate the causal interaction between node “x” and node “y,” we used the measure “difference of influence” (DOI) as suggested in previous research (Roebroeck et al. 2005). This measure captures causal links that only show a dominant direction of influence and has the advantage of limiting potentially spurious links caused by hemodynamic blurring. For group-level analysis, we computed the median value of DOIs estimated for each link across all the subjects and used the same nonparametric statistical testing procedure used for MDS on median DOIs to infer statistical significance.
Specifically, for each individual, we generated an instance of surrogate data by first applying a Fourier transform to each ROI time series, randomizing the phase of the transformed signal and then applying an inverse Fourier transform. This procedure has the advantage that the magnitude spectrum of the data is preserved while any causal interactions between various regions are eliminated. Multivariate GCA is then applied on the surrogate data to estimate DOI values. The above procedure was repeated on 500 independently generated instances of surrogate data for each subject. At the group level, the median DOI value across subjects for each link and each instance of surrogate data was computed. The 500 median DOIs served as the empirical null distribution from which P-value for each causal link was obtained. Finally, FDR correction (P < 0.05) was applied to correct for multiple comparisons. All other methods are similar to those used for MDS.
Dynamic Causal Modelling
For completeness, we conducted additional analyses using DCM, a widely used method for investigating context-dependent causal interactions between brain regions (Friston et al. 2003). DCM is a confirmatory method where several causal models are tested, and the model with the highest evidence is chosen. Because it is computationally impractical to test all combinatorial models and perform model selection with the large number of nodes in the present study, we investigated a limited set models based on convergent findings from MDS and GCA. We applied DCM on the 3 datasets to investigate whether DCM produced convergent results across different datasets and whether DCM results were convergent with MDS and GCA findings. We used the stochastic DCM package implemented in SPM12 (http://www.fil.ion.ucl.ac.uk/spm/software/spm12/) to perform the analysis. Analysis of multiple models, including the ones identified by both MDS and GCA, did not produce replicable patterns of causal interactions across the three datasets and is not considered further here.
Relation Between Causal Interactions and Behavior
To investigate the relationship between causal interaction and cognitive control ability, we examined Pearson's correlation between MDS estimation and behavioral measures in each task, including stop-signal reaction time (SSRT) for stop-signal tasks and congruency effect = (Incongruent RT − Congruent RT)/Congruent RT for the Flanker task. To control the effect of outlier behavior, we screened subjects' performance: response accuracy in congruent and incongruent trials in the Flanker task and response accuracy in go and stop trials the SST1 and SST2 tasks. An outlier is defined as a data point whose value is larger than 1.5 times the interquartile range (IQR) above the third quartile or smaller than 1.5 times IQR below than the first quartile. One subject was excluded from the flanker task, 1 from the SST1, and 7 from the SST2.
Results
Common Frontal-Cingulate-Parietal Regions Are Involved in All 3 Cognitive Control Tasks
We first examined whole-brain activation during cognitive control in each task using GLM. For the SST1 and SST2 tasks, we examined brain responses to successful stop trials versus go trials (SuccStop-Go). For the Flanker task, we examined brain responses to incongruent trials versus congruent trials (Incongruent-Congruent). Consistent activation was observed in Frontal-Cingulate-Parietal regions, encompassing the dACC, AI, VLPFC, DLPFC, and PPC ROIs, in each of the three different tasks (all Ps < 0.05 FDR corrected, Fig. 3). A logical “AND” operation confirmed common, right hemispheric dominant activation of AI, VLPFC, dACC and adjoining dorsomedial prefrontal cortex, DLPFC, and PPC across the three different tasks (Fig. 3).
Figure 3.

Brain areas activated during the three cognitive control tasks. The first 3 columns show Frontal-Cingulate-Parietal activation in the three studies. All contrast maps were thresholded at P < 0.05, FDR corrected for multiple comparisons. The rightmost column shows the overlapped suprathreshold activation in all three studies identified using logical “AND” operation.
Causal Interactions in the Right Frontal-Cingulate-Parietal Network
Common Causal Influence from the Right AI to the dACC and the PPC Are Detected in All 3 Tasks
MDS analysis revealed significant causal influences from the right AI to the dACC, right VLPFC, and PPC in all three tasks (all Ps < 0.05 FDR corrected, Fig. 4A). Significant causal influences were also found from the right AI to the right DLPFC in the SST1 and SST2 but not in the Flanker task.
Figure 4.

Causal interactions identified by MDS and GCA in the three cognitive control tasks. (A) MDS result: Upper panel shows causal interaction graphs for each task (all Ps < 0.05, FDR corrected). The right AI showed significant causal influence to the dACC and right PPC in all 3 studies. Lower panel shows Net Causal Outflow (outflow degree − inflow degree) in each node in each task. The right AI had greater Net Causal Outflow than all other nodes in the network in all three studies. (B) GCA result: Upper panel shows causal interaction graph for each task (all Ps < 0.05, FDR corrected). The right AI showed significant causal influence to the dACC and right PPC in all three studies. Lower panel shows Net Causal Outflow (outflow degree − inflow degree) in each node in each task. The right AI had greater Net Causal Outflow than all other nodes in the network in all three studies. The rightmost column shows the common causal interaction in all three tasks identified using logical “AND” operation. Green edges indicate significant causal interactions along the direction of the arrow and significantly greater causal interaction along the direction of the arrow against the opposite direction (i.e., MDSrAI−>dACC − MDSdACC−>rAI or GCArAI−>dACC − GCAdACC−>rAI). * indicates statistical significance after Bonferroni multiple comparison correction (P < 0.05).
GCA also showed significant causal influences from the right AI to the dACC, the right DLPFC and PPC, and from the dACC to the right PPC in all three tasks, and from the right AI to the right VLPFC in SST2 and Flanker but not in SST1 (all Ps < 0.05 FDR corrected, Fig. 4B).
A logical “AND” operation was applied to examine common patterns of causal interactions across the three tasks (Fig. 4). Both MDS and GCA showed common causal influences from the right AI to the dACC and the right PPC.
Consistent with these results, analysis of the fitted hemodynamic response revealed that the right AI had higher amplitudes and shortest latencies relative to other network nodes (Supplementary Material, Fig. S9).
Right AI Is a Dominant Causal Outflow Hub in 3 Cognitive Control Tasks
Next, we compared the strength of causal influences of each node in the Frontal-Cingulate-Parietal network using graph-theoretical network analysis. The strength of causal influence was measured by Net Causal Outflow (Sridharan et al. 2008), the difference between outflow degree (the number of significant causal outflow connections from a node to any other node in the network), and inflow degree (the number of significant causal inflow connections to a node from any other node in the network), for each node for each subject in each task.
We first investigated Net Causal Outflow using MDS. Repeated-measures ANOVA with ROI as a within-subject factor was used to determine whether there is a significant difference among all ROIs in terms of Net Causal Outflow. The ANOVA revealed a significant difference in Net Causal Outflow among the five ROIs in all tasks (all Ps < 0.05). Overall, the right AI had greater Net Causal Outflow than any other ROI in the network in all tasks (Fig. 4A). To further quantify the Net Causal Outflow for the right AI relative to all other ROIs, we applied one-tailed paired t-tests. Multiple comparisons were corrected using the Bonferroni procedure (P < 0.05/4 = 0.0125). For the SST1 task, the right AI had significantly greater Net Causal Outflow than the dACC, right DLPFC, and PPC. For the Flanker task, the right AI had significantly greater Net Causal Outflow than the right DLPFC and PPC. For the SST2, the right AI had significantly greater Net Causal Outflow than the right PPC.
A similar pattern of Net Causal Outflow results was found with GCA. A significant difference of GCA Net Causal Outflows was identified among five ROIs in SST1 and Flanker tasks (all Ps < 0.05) but not for SST2 tasks (P = 0.121). Overall, the right AI had greater Net Causal Outflow than any other ROI in the network in any task (Fig. 4B). The same one-tailed paired t-tests and multiple comparison corrections (P < 0.05/4 = 0.0125) were conducted. For the SST1 task, the right AI had significantly greater Net Causal Outflow than the dACC, right DLPFC, and VLPFC. For the Flanker task, the right AI had significantly greater Net Causal Outflow than all the other ROIs. For the SST2 task, the right AI had significantly greater Net Causal Outflow than the right VLPFC.
Strength of Causal Interaction from Right AI to dACC Is Modulated by Cognitive Control Demand
To further characterize the relationship between causal interaction in the Frontal-Cingulate-Parietal network and cognitive control, we conducted trial-specific MDS analysis to examine whether the strength of causal interaction is modulated by cognitive control demand. Go trials in the SST tasks and Congruent trials in the Flanker task are low cognitive control trials, whereas Stop trials in the SST and Incongruent trials in the Flanker task are high cognitive control trials. The analysis revealed that the right AI has significantly greater causal interaction with the dACC on high cognitive control trials than on low cognitive control trials in SST1, Flanker and SST2 tasks (all Ps < 0.05, FDR corrected, Fig. 5).
Figure 5.

Trial-specific causal interaction in 3 cognitive control tasks. Trial-specific MDS revealed significant causal interactions in low cognitive control trials (i.e., Congruent trials in Flanker task, Go trials in SST1 and SST2 tasks), in high cognitive control trials (i.e., Incongruent trials in Flanker task, Stop trials in SST1 and SST2 tasks), and significantly greater causal interaction in high cognitive control trials than in low cognitive control trials (all Ps < 0.05, FDR corrected). Green edges indicate significant causal interactions along the direction of the arrow (i.e., MDSrAI−>dACC); red edges indicate significant bidirectional causal interactions (i.e., MDSrAI−>dACC and MDSdACC−>rAI).
Right AI-dACC Causal Interaction Is Related to Cognitive Control Ability
Lastly, we investigated the relationship between the strength of causal interaction in the Frontal-Cingulate-Parietal network and individual differences in cognitive control ability. Because the trial-specific MDS analysis showed that causal interactions between the right AI and dACC were modulated by cognitive control demand, we focused on causal interactions within this link. We derived task-specific cognitive control indices to assess each individual's ability to rapidly and flexibly adjust behavior. Consistent with previous behavioral literature (Logan et al. 1984; Verbruggen and Logan 2008), we used SSRT, the time to cancel a prepotent response, to measure cognitive control abilities in the SST1 and SST2 tasks. We used the Congruency Effect (Eriksen and Eriksen 1974; Henik et al. 1999; Fan et al. 2009), the time to resolve stimulus-response conflict, to measure cognitive control abilities in the Flanker task. We found that the net strength of causal interaction between right AI and dACC (MDSrAI −> dACC − MDSdACC −> rAI) was significantly correlated with measures of cognitive control ability in the Flanker task (r = 0.49, P < 0.05), the SST2 (r = 0.28, P < 0.05), and marginally in the SST1 (r = 0.43, P = 0.07) (Fig. 6). Since higher scores of SSRT or Congruency Effect indicate lower cognitive control ability, our finding suggests that individuals who have weaker cognitive control capacity require greater causal interactions between the right AI and dACC for successfully performing cognitive control tasks.
Figure 6.

Brain-behavior relations in three cognitive control tasks. The strength of causal interactions between the right AI and dACC was correlated with individual measures of cognitive control ability. Data from SST1 (A), Flanker (B), and SST2 (C) tasks. Congruency Effect = (Incongruent RT − Congruent RT)/Congruent RT. *P < 0.05.
Causal Interaction in the Left Frontal-Cingulate-Parietal Network
As noted above, despite that overall activations across the three tasks showed a right hemispheric dominance, a homologous Frontal-Cingulate-Parietal network in the left hemisphere was also activated in some of the tasks. It is possible that, even when left hemisphere responses are weaker than those in right hemisphere, causal interactions may be just as robust in homologous left hemisphere regions. To address this, we conducted parallel analyses on homologous ROIs in the left hemisphere.
Common Causal Influences from the Left AI to dACC Are Detected in All Three Tasks
MDS revealed significant causal influences from the left AI to dACC and from the left PPC to DLPFC in all three tasks (all Ps < 0.05 FDR corrected, Supplementary Fig. S1A). Significant causal influences from the left AI to the left DLPFC, VLPFC, and PPC were also found in SST1 and SST2 except in the Flanker task. GCA showed significant causal influences from the left AI to the dACC and left PPC and from the left PPC to the left DLPFC in all three tasks, from left AI to the left DLPFC in SST1 and SST2 but not in the Flanker (Supplementary Fig. S1B).
Left AI Is a Dominant Causal Outflow Hub
Repeated-measures ANOVA revealed a significant difference in Net Causal Outflow, as assessed using MDS, among the five ROIs in all the tasks (all Ps < 0.01). For the SST1 and SST2 task, the left AI had significantly greater Net Causal Outflow than all the other ROIs. For the Flanker task, the left AI had significantly greater Net Causal outflow than left PPC. For GCA results, there was a significant Net Causal Outflow difference in the SST1 and SST2 (all Ps < 0.05) but not in Flanker. For the Flanker, there was no significant difference between the left AI and any of the other ROIs. For the SST1, the left AI had significantly greater Net Causal Outflow than the dACC and left VLPFC. For the SST2, the left AI had significantly greater Net Causal Outflow than all the other ROIs. In sum, the AI is also a dominant causal outflow hub in the left hemisphere (Supplementary Fig. S1).
Strength of Causal Interactions from Left AI to dACC Is Modulated by Cognitive Control Demand
Trial-specific MDS showed significantly greater causal interaction between the left AI and the dACC on high versus low cognitive control trials in Flanker and SST2 but not in SST1 and significantly greater causal interaction between the left AI and left PPC and between the left DLPFC and left PPC in SST2 (all Ps < 0.05, FDR corrected, Supplementary Fig. S2).
Left AI-dACC Causal Interaction Is Related to Cognitive Ability in SST2
The brain-behavior analysis showed that the strength of causal interaction between the left AI and dACC is significantly correlated with SSRT in the SST1 (r = 0.51, P < 0.05) but not in the Flanker and SST2 tasks (all Ps > 0.05), as illustrated in Supplementary Figure S3.
Discussion
Across multiple tasks, scanners, and cohorts, our findings demonstrate strong and reliable causal interactions between core Frontal-Cingulate-Parietal regions involved in cognitive control. The datasets investigated in this study encompass paradigms, such as the stop-signal task and the flanker task, that have been widely used to investigate the neural basis of cognitive control in humans. Critically, we used a task-independent approach based on a neurocognitive network model to specify key nodes of a Frontal-Cingulate-Parietal network that has been implicated in a wide range of cognitive tasks (Dosenbach et al. 2006, 2007; Sridharan et al. 2008; Wen et al. 2012; Cole et al. 2013). The AI, dACC, DLPFC, VLPFC, and PPC nodes of this network were consistently activated in the three datasets, with a right hemisphere dominant profile of brain activation. Importantly, we found that across each of the three tasks, the right AI exerts strong causal influences over the dACC and the right PPC. This common causal mechanism within the Frontal-Cingulate-Parietal network was affirmed by two different quantitative methods for estimating causal interactions. Both analyses also revealed that the AI had greater Net Causal Outflow than any other nodes in the network. Furthermore, trial-specific MDS analysis revealed that the strength of causal interactions between the right AI and dACC was modulated by cognitive control demands. More strikingly, the strength of causal influence from the right AI to dACC was correlated with individual cognitive control capacity. Additional analyses revealed that these results were specific to the dorsal subdivision of the AI (Supplementary Material). Taken together, our findings suggest that causal interactions from the AI, and more specifically its dorsal subdivision, to dACC play a key role in implementing cognitive control in the human brain and help elucidate fundamental aspects of Frontal-Cingulate-Parietal network function.
AI: an Important, but Oft-Neglected, Brain Area for Cognitive Control
The AI is involved in a wide range of cognitive processes (Craig 2009), but its role in cognitive control remains unclear. Although many neuroimaging studies have reported activation of the AI in a wide range of cognitive control tasks, including the Stop-signal, Flanker, and Go/NoGo tasks (Buchsbaum et al. 2005; Wager et al. 2005; Levy and Wagner 2011; Swick et al. 2011), the AI has often been sidelined in favor of adjacent lateral prefrontal cortex, most notably the VLPFC. The mechanistic role of the AI in cognitive control tasks has been poorly understood, and, furthermore, despite its theoretical importance (Levy and Wagner 2011), no studies have attempted to disambiguate causal interactions between the AI and VLPFC.
An alternate line of research has suggested that the AI plays an important role in detecting salient events and recruiting cognitive resources for effortful implementation of control processes (Dosenbach et al. 2006; Menon and Uddin 2010; Ullsperger et al. 2010; Cai et al. 2014), but evidence for a direct causal role in implementing cognitive control has been missing. The current study provides strong evidence for a key role of the right AI in cognitive control across multiple task paradigms. We found that the right AI exerts a significant causal influence on the dACC, and it is the predominant source of Net Causal Outflow within the Frontal-Cingulate-Parietal network (Fig. 4). Furthermore, the strength of causal interaction between the right AI and dACC was modulated by cognitive control demands (Fig. 5). These results suggest that the right AI implements a core mechanism in some of the most widely used cognitive control tasks. One candidate function of the right AI is bottom–up detection of salient or behaviorally relevant stimuli. Corbetta and Shulman (2002) have suggested that the ventral frontal-parietal network including the right AI is actively engaged in detecting behaviorally relevant stimuli and other studies have more directly associated the right AI with saliency detection (Seeley et al. 2007; Sridharan et al. 2008). Detection of salient behaviorally relevant stimuli is an essential process in many cognitive control tasks, including the Go/NoGo and Stop-signal tasks. Once a salient stimulus is detected, the AI is well positioned to generate control signals that influence or switch on other brain areas (Menon and Uddin 2010).
Anterior Insula Triggers the Salience Network During Cognitive Control
The AI and dACC constitute key nodes of the salience network (Seeley et al. 2007), and prior research has suggested that these regions form part of a “core” task set within the fronto-opercular cortex (Dosenbach et al. 2006; Menon and Uddin 2010). Yet, previous studies have not systematically examined causal interactions within the salience network during cognitive control tasks. Across all three tasks, we found that the right AI exerts significant causal influences on the dACC. Critically, trial-specific MDS analysis revealed that the strength of causal interactions between the right AI and dACC was modulated by cognitive control demands (Fig. 5) and was correlated with individual differences in cognitive control capacity (Fig. 6). Our findings are consistent with and extend previous research suggesting an important role for a dedicated AI-dACC network in implementing cognitive control. First, the AI and dACC are structurally connected (van den Heuvel et al. 2009; Allman et al. 2010) with strong connections along the uncinate fasciculus (Uddin et al. 2011). Second, the AI and dACC are often coactivated across a variety of cognitive tasks (Buchsbaum et al. 2005; Wager et al. 2005; Dosenbach et al. 2006). Third, functional parcellation studies have demonstrated strong functional covariance between the AI and dACC (Cauda et al. 2011; Deen et al. 2011; Chang et al. 2013). Fourth, resting-state fMRI studies have revealed strong intrinsic connectivity between the AI and dACC (Seeley et al. 2007; Sridharan et al. 2008; Taylor et al. 2009; Uddin et al. 2011; Supekar and Menon 2012; Cai et al. 2014). Fifth, it was the dorsal, rather than ventral, AI, which showed stronger intrinsic connectivity to the dACC and stronger modulation of causal interactions with cognitive control demands (Supplementary Material). Our study provides robust evidence for the involvement of a common core intrinsically connected AI-ACC network across cognitive control tasks.
Although the AI and dACC have both been implicated in error detection (Menon et al. 2001; Li et al. 2008; Hendrick et al. 2010; Ham et al. 2013; Ide et al. 2013), our results suggest that causal interactions between the AI and dACC found in the current study do not arise primarily from error processing. First, task accuracy was uniformly high approaching 98% for incongruent trials on the Flanker task. Second, analysis of correctly performed trials revealed stronger interactions between the AI and dACC for incongruent, compared with congruent, trials. Therefore, greater causal interactions from the AI to dACC were unlikely to arise from error-related processing in our study.
A further insight here relates to the precise direction of causal mechanisms underlying AI-dACC interactions. Although the dACC has been the focus of many studies of cognitive control, its role relative to the AI has been less clear. The dACC has been associated with a broad range of high-order cognitive processes, including error processing, conflict monitoring, decision-making, and overriding prepotent responses (Botvinick et al. 2004; Rushworth et al. 2004). Our analysis of causal interactions revealed that even though the AI and dACC form part of the same intrinsic brain network, it is the AI that has the dominant and behaviorally relevant causal influence on the dACC during cognitive control, and not the other way around. These results are consistent with anatomical models that emphasize the AI as a locus of sensory inputs and the ACC as the locus of motor outputs (Butti and Hof 2010; Menon and Uddin 2010). Our findings further support and corroborate a neurocognitive model (Menon and Uddin 2010) of the AI-ACC network in which the AI detects increased sensory demands for cognitive control and then signals the ACC to initiate, maintain, and implement actions necessary for appropriate goal-directed behaviors during cognitive control tasks.
Interestingly, previous studies have suggested that the AI and ACC are also engaged by interoceptive and affective processes (Damasio et al. 2000; Seeley et al. 2007; Craig 2009), and more broadly by a wide range of cognitive tasks (Buchsbaum et al. 2005; Wager et al. 2005; Rushworth et al. 2007; Levy and Wagner 2011; Swick et al. 2011; Cai et al. 2014). A common link here is that these processes all require detection of, and attention to, salient events, both internal and external. The cognitive control tasks used in the present study allowed us to investigate causal interactions of the salience and executive network in a more precise, and load-dependent, manner. Whether similar processes operate in other domains and how causal interactions change with task and context remain open and important questions for future research.
Parallel Processes in Left Frontal-Cingulate-Parietal Network
Another noteworthy finding of our study is that despite relatively weaker activation profiles in the left hemisphere, the left Frontal-Cingulate-Parietal network showed a surprisingly similar profile of significant causal interactions between the AI and dACC as in the right hemisphere (Supplementary Fig. S1). The left AI showed strong causal influences on the dACC, and the strength of causal influences was modulated by cognitive control demand (Supplementary Fig. S2), similar to the patterns found in the right hemisphere. This result is consistent with previous research and extends them in novel ways. First, although the right hemisphere dominance is emphasized in the class of cognitive control tasks examined here, many previous studies have demonstrated consistent, albeit weaker, activations in the left hemisphere (Levy and Wagner 2011; Swick et al. 2011; Boehler et al. 2012). Second, patients with left frontal-insula lesions have shown impaired cognitive control abilities, but previous studies have not disambiguated behavioral impairments arising from the left AI or VLPFC lesions (Swick et al. 2008). Third, similar causal interaction patterns between the left AI and other left hemisphere ROIs have been reported during a problem-solving task (Supekar and Menon 2012). Importantly, our findings suggest that strong causal control signals consistent with task demands can be generated even when activation levels are weak. However, the relationship between the strength of causal interaction within the left hemisphere salience network and cognitive control ability was less robust than in the right hemisphere (Supplementary Fig. S3). Overall, our analysis of the left Frontal-Cingulate-Parietal network suggests that the left AI may play an important, but hitherto unappreciated, causal role in cognitive control. One possibility suggested by a recent study is that the left AI may facilitate behavioral adaptation after errors (Ham et al. 2013).
Right AI Mediates Interaction Between the Salience and Central Executive Networks
The salience network, anchored in the AI and dACC, and the central executive network, anchored in the DLPFC and PPC, form two dissociable systems based on their patterns of intrinsic brain connectivity. While some studies have pointed out functional independence of these two systems (Nomura et al. 2010), the saliency and central executive networks are almost universally coactivated during cognitive control tasks (Dosenbach et al. 2007; Menon and Uddin 2010). No studies to date have examined the nature of causal interactions between these two networks during cognitive control and almost nothing is known about the robustness of putative signaling mechanisms across tasks and datasets. Our analysis revealed common causal interactions between the right AI and right PPC in all three cognitive control tasks (Fig. 4). The PPC has been implicated in planning and controlling goal-directed behavior (Andersen and Cui 2009) and coactivation of the PPC with AI is often observed during cognitive control tasks (Buchsbaum et al. 2005; Wager et al. 2005). However, functional interactions between the AI and the PPC in cognitive control have rarely been examined. Consistent with our findings, a recent study found that phasic activity of the AI, PPC, and ACC increased with demand for moment-to-moment tuning of cognitive control (Wilk et al. 2012). Our findings reveal that such adjustments are driven by the AI, which exerts strong causal influences on the PPC region across multiple cognitive control tasks (Fig. 4). Furthermore, the AI also exhibited dominant causal influences on DLPFC and VLPFC nodes in the majority of tasks tested here (Fig. 4). The right VLPFC has been widely implicated in cognitive control, especially the class of studies requiring response inhibition (Levy and Wagner 2011; Swick et al. 2011).
In many previous studies of cognitive control, the right AI and VLPFC are strongly coactivated (Levy and Wagner 2011), making it difficult to disentangle their primacy in cognitive control. Interestingly, several recent studies offered strong evidence for functional dissociation of the right AI and VLPFC in cognitive control (Cai et al. 2014; Erika-Florence et al. 2014). Our study overcomes this limitation by defining nodes within the right AI and VLPFC independent of the task activations and reveals that the right AI has stronger causal effects on the right VLPFC. Thus, causal interactions functionally differentiate the right AI and VLPFC during cognitive control. The dominant causal influence from the right AI to each node in the Frontal-Cingulate-Parietal network is consistent with its role as a causal control hub. Together, our findings suggest that the right AI is a key hub that mediates interactions between the salience and central executive networks during cognitive control. More broadly, they illustrate how the right AI facilitates behaviorally meaningful dynamic cooperation between segregated brain systems during cognitive control.
Summary
We have uncovered a common Frontal-Cingulate-Parietal network in three different cognitive control tasks. Critically, our approach has focused on causal interactions within this network, rather than increased levels of regional activation that have been the mainstay of brain imaging studies of cognitive control. The approach we have used here is useful in disentangling causal interactions from adjacent brain structures within the fronto-insular cortex and is a highly valuable and complementary approach for understanding causal mechanisms underlying key aspects of cognitive control. Our findings are consistent with a two-stage cognitive control model in which the AI first detects events that require great engagement of cognitive control and then signals the dACC to implement trial-specific cognitive control processes (Menon and Uddin 2010). The reliable identification of a common and fundamental control process involving the AI will serve as a useful template for understanding deficits in cognitive control that are prominent in many psychiatric and neurological disorders including autism, attention deficit hyperactivity disorder, schizophrenia, and fronto-temporal dementia (Menon 2011).
Supplementary Material
Supplementary material can be found at: http://www.cercor.oxfordjournals.org
Funding
This work was supported by National Institutes of Health Grants NS071221 (V.M.), NS086085 (V.M.), DA026990 (C.-S.R.L.), DA023248 (C.-S.R.L.), AA021449 (C.-S.R.L.), K25HD074652 (S.R.), National Science Foundation Grant BCS1309260 (C-.S.R.L.), and Li Ka Shing Foundation Big Data for Human Health Seed Grant.
Supplementary Material
Notes
We are grateful to Dr Russell Poldrack and colleagues for sharing their data via OpenfMRI.org and to Dr Sheng Zhang for assistance with data acquired at the Yale University School of Medicine. We thank Drs Arron Metcalfe, Shaozheng Qin, and Lucina Uddin for helpful feedback on the study. Conflict of Interest: None declared.
References
- Allman JM, Tetreault NA, Hakeem AY, Manaye KF, Semendeferi K, Erwin JM, Park S, Goubert V, Hof PR. 2010. The von Economo neurons in frontoinsular and anterior cingulate cortex in great apes and humans. Brain Struct Funct. 214:495–517. [DOI] [PubMed] [Google Scholar]
- Andersen RA, Cui H. 2009. Intention, action planning, and decision making in parietal-frontal circuits. Neuron. 63:568–583. [DOI] [PubMed] [Google Scholar]
- Beckmann CF, DeLuca M, Devlin JT, Smith SM. 2005. Investigations into resting-state connectivity using independent component analysis. Philos T Roy Soc B. 360:1001–1013. [DOI] [PMC free article] [PubMed] [Google Scholar]
- Boehler CN, Appelbaum LG, Krebs RM, Hopf JM, Woldorff MG. 2012. The influence of different Stop-signal response time estimation procedures on behavior-behavior and brain-behavior correlations. Behav Brain Res. 229:123–130. [DOI] [PMC free article] [PubMed] [Google Scholar]
- Botvinick MM, Cohen JD, Carter CS. 2004. Conflict monitoring and anterior cingulate cortex: an update. Trends Cogn Sci. 8:539–546. [DOI] [PubMed] [Google Scholar]
- Bressler SL, Menon V. 2010. Large-scale brain networks in cognition: emerging methods and principles. Trends Cogn Sci. 14:277–290. [DOI] [PubMed] [Google Scholar]
- Buchsbaum BR, Greer S, Chang WL, Berman KF. 2005. Meta-analysis of neuroimaging studies of the Wisconsin card-sorting task and component processes. Hum Brain Mapp. 25:35–45. [DOI] [PMC free article] [PubMed] [Google Scholar]
- Butti C, Hof PR. 2010. The insular cortex: a comparative perspective. Brain Struct Funct. 214:477–493. [DOI] [PubMed] [Google Scholar]
- Button KS, Ioannidis JP, Mokrysz C, Nosek BA, Flint J, Robinson ES, Munafo MR. 2013. Power failure: why small sample size undermines the reliability of neuroscience. Nat Rev Neurosci. 14:365–376. [DOI] [PubMed] [Google Scholar]
- Cai W, Ryali S, Chen T, Li CS, Menon V. 2014. Dissociable roles of right inferior frontal cortex and anterior insula in inhibitory control: evidence from intrinsic and task-related functional parcellation, connectivity, and response profile analyses across multiple datasets. J Neurosci. 34:14652–14667. [DOI] [PMC free article] [PubMed] [Google Scholar]
- Cauda F, D'Agata F, Sacco K, Duca S, Geminiani G, Vercelli A. 2011. Functional connectivity of the insula in the resting brain. Neuroimage. 55:8–23. [DOI] [PubMed] [Google Scholar]
- Chambers CD, Bellgrove MA, Gould IC, English T, Garavan H, McNaught E, Kamke M, Mattingley JB. 2007. Dissociable mechanisms of cognitive control in prefrontal and premotor cortex. J Neurophysiol. 98:3638–3647. [DOI] [PubMed] [Google Scholar]
- Chang LJ, Yarkoni T, Khaw MW, Sanfey AG. 2013. Decoding the role of the insula in human cognition: functional parcellation and large-scale reverse inference. Cereb Cortex. 23:739–749. [DOI] [PMC free article] [PubMed] [Google Scholar]
- Cole MW, Reynolds JR, Power JD, Repovs G, Anticevic A, Braver TS. 2013. Multi-task connectivity reveals flexible hubs for adaptive task control. Nat Neurosci. 16:1348–1355. [DOI] [PMC free article] [PubMed] [Google Scholar]
- Corbetta M, Shulman GL. 2002. Control of goal-directed and stimulus-driven attention in the brain. Nat Rev Neurosci. 3:201–215. [DOI] [PubMed] [Google Scholar]
- Craig AD. 2009. How do you feel--now? The anterior insula and human awareness. Nat Rev Neurosci. 10:59–70. [DOI] [PubMed] [Google Scholar]
- Damasio AR, Grabowski TJ, Bechara A, Damasio H, Ponto LL, Parvizi J, Hichwa RD. 2000. Subcortical and cortical brain activity during the feeling of self-generated emotions. Nat Neurosci. 3:1049–1056. [DOI] [PubMed] [Google Scholar]
- Deen B, Pitskel NB, Pelphrey KA. 2011. Three systems of insular functional connectivity identified with cluster analysis. Cereb Cortex. 21:1498–1506. [DOI] [PMC free article] [PubMed] [Google Scholar]
- Dosenbach NU, Fair DA, Miezin FM, Cohen AL, Wenger KK, Dosenbach RA, Fox MD, Snyder AZ, Vincent JL, Raichle ME et al. 2007. Distinct brain networks for adaptive and stable task control in humans. Proc Natl Acad Sci USA. 104:11073–11078. [DOI] [PMC free article] [PubMed] [Google Scholar]
- Dosenbach NU, Visscher KM, Palmer ED, Miezin FM, Wenger KK, Kang HC, Burgund ED, Grimes AL, Schlaggar BL, Petersen SE. 2006. A core system for the implementation of task sets. Neuron. 50:799–812. [DOI] [PMC free article] [PubMed] [Google Scholar]
- Erika-Florence M, Leech R, Hampshire A. 2014. A functional network perspective on response inhibition and attentional control. Nat Commun. 5:4073. [DOI] [PMC free article] [PubMed] [Google Scholar]
- Eriksen BA, Eriksen CW. 1974. Effects of noise letters upon identification of a target letter in a nonsearch task. Percept Psychophys. 16:143–149. [Google Scholar]
- Fan J, Gu XS, Guise KG, Liu X, Fossella J, Wang HB, Posner MI. 2009. Testing the behavioral interaction and integration of attentional networks. Brain Cogn. 70:209–220. [DOI] [PMC free article] [PubMed] [Google Scholar]
- Friston KJ, Harrison L, Penny W. 2003. Dynamic causal modelling. Neuroimage. 19:1273–1302. [DOI] [PubMed] [Google Scholar]
- Gazzaley A, Nobre AC. 2012. Top-down modulation: bridging selective attention and working memory. Trends Cogn Sci. 16:129–135. [DOI] [PMC free article] [PubMed] [Google Scholar]
- Granger CWJ. 1969. Investigating causal relations by econometric models and cross-spectral methods. Econometrica. 37:424–438. [Google Scholar]
- Greicius MD, Srivastava G, Reiss AL, Menon V. 2004. Default-mode network activity distinguishes Alzheimer's disease from healthy aging: evidence from functional MRI. Proc Natl Acad Sci USA. 101:4637–4642. [DOI] [PMC free article] [PubMed] [Google Scholar]
- Ham T, Leff A, de Boissezon X, Joffe A, Sharp DJ. 2013. Cognitive control and the salient network: an investigation of error processing and effective connectivity. J Neurosci. 33:7091–8098. [DOI] [PMC free article] [PubMed] [Google Scholar]
- Hendrick OM, Ide JS, Luo X, Li CS. 2010. Dissociable processes of cognitive control during error and non-error conflicts: a study of the stop signal task. PLoS ONE. 5:e13155. [DOI] [PMC free article] [PubMed] [Google Scholar]
- Henik A, Ro T, Merrill D, Rafal R, Safadi Z. 1999. Interactions between color and word processing in a flanker task. J Exp Psychol Hum. 25:198–209. [DOI] [PubMed] [Google Scholar]
- Hofmann W, Schmeichel BJ, Baddeley AD. 2012. Executive functions and self-regulation. Trends Cogn Sci. 16:174–180. [DOI] [PubMed] [Google Scholar]
- Ide JS, Shenoy P, Yu AJ, Li CS. 2013. Bayesian prediction and evaluation in the anterior cingulate cortex. J Neurosci. 33:2039–2047. [DOI] [PMC free article] [PubMed] [Google Scholar]
- Kelly AM, Uddin LQ, Biswal BB, Castellanos FX, Milham MP. 2008. Competition between functional brain networks mediates behavioral variability. Neuroimage. 39:527–537. [DOI] [PubMed] [Google Scholar]
- Levy BJ, Wagner AD. 2011. Cognitive control and right ventrolateral prefrontal cortex: reflexive reorienting, motor inhibition, and action updating. Ann N Y Acad Sci. 1224:40–62. [DOI] [PMC free article] [PubMed] [Google Scholar]
- Li CS, Yan P, Chao HH, Sinha R, Paliwal P, Constable RT, Zhang S, Lee TW. 2008. Error-specific medial cortical and subcortical activity during the stop signal task: a functional magnetic resonance imaging study. Neuroscience. 155:1142–1151. [DOI] [PMC free article] [PubMed] [Google Scholar]
- Logan GD, Cowan WB, Davis KA. 1984. On the ability to inhibit simple and choice reaction time responses: a model and a method. J Exp Psychol Hum Percept Perform. 10:276–291. [DOI] [PubMed] [Google Scholar]
- Menon V. 2011. Large-scale brain networks and psychopathology: a unifying triple network model. Trends Cogn Sci. 15:483–506. [DOI] [PubMed] [Google Scholar]
- Menon V, Adleman NE, White CD, Glover GH, Reiss AL. 2001. Error-related brain activation during a Go/NoGo response inhibition task. Hum Brain Mapp. 12:131–143. [DOI] [PMC free article] [PubMed] [Google Scholar]
- Menon V, Uddin LQ. 2010. Saliency, switching, attention and control: a network model of insula function. Brain Struct Funct. 214:655–667. [DOI] [PMC free article] [PubMed] [Google Scholar]
- Miller EK, Cohen JD. 2001. An integrative theory of prefrontal cortex function. Annu Rev Neurosci. 24:167–202. [DOI] [PubMed] [Google Scholar]
- Nomura EM, Gratton C, Visser RM, Kayser A, Perez F, D'Esposito M. 2010. Double dissociation of two cognitive control networks in patients with focal brain lesions. Proc Natl Acad Sci USA. 107:12017–12022. [DOI] [PMC free article] [PubMed] [Google Scholar]
- O'Reilly RC, Herd SA, Pauli WM. 2010. Computational models of cognitive control. Curr Opin Neurobiol. 20:257–261. [DOI] [PMC free article] [PubMed] [Google Scholar]
- Posner MI, DiGirolamo GJ. 1998. Executive attention: conflict, target detection, and cognitive control. In: Parasuraman R, editor. The attentative brain. Cambridge: (MA: ): The MIT Press; p. 401–423. [Google Scholar]
- Prichard D, Theiler J. 1994. Generating surrogate data for time series with several simultaneously measured variables. Phys Rev Lett. 73:951–954. [DOI] [PubMed] [Google Scholar]
- Robbins TW. 1996. Dissociating executive functions of the prefrontal cortex. Phil Trans R Soc Lond B Biol Sci. 351:1463–1470. discussion 1470–1461. [DOI] [PubMed] [Google Scholar]
- Roebroeck A, Formisano E, Goebel R. 2005. Mapping directed influence over the brain using Granger causality and fMRI. Neuroimage. 25:230–242. [DOI] [PubMed] [Google Scholar]
- Rushworth MF, Behrens TE, Rudebeck PH, Walton ME. 2007. Contrasting roles for cingulate and orbitofrontal cortex in decisions and social behaviour. Trends Cogn Sci. 11:168–176. [DOI] [PubMed] [Google Scholar]
- Rushworth MF, Walton ME, Kennerley SW, Bannerman DM. 2004. Action sets and decisions in the medial frontal cortex. Trends Cogn Sci. 8:410–417. [DOI] [PubMed] [Google Scholar]
- Ryali S, Chen T, Padmanabhan A, Cai W, Menon V. 2015. Development and validation of consensus clustering-based framework for brain segmentation using resting fMRI. J Neurosci Methods. 240:128–140. [DOI] [PMC free article] [PubMed] [Google Scholar]
- Ryali S, Chen T, Supekar K, Menon V. 2013. A parcellation scheme based on von Mises-Fisher distributions and Markov random fields for segmenting brain regions using resting-state fMRI. Neuroimage. 65:83–96. [DOI] [PMC free article] [PubMed] [Google Scholar]
- Ryali S, Supekar K, Chen T, Menon V. 2011. Multivariate dynamical systems models for estimating causal interactions in fMRI. Neuroimage. 54:807–823. [DOI] [PMC free article] [PubMed] [Google Scholar]
- Schippers MB, Renken R, Keysers C. 2011. The effect of intra- and inter-subject variability of hemodynamic responses on group level Granger causality analyses. Neuroimage. 57:22–36. [DOI] [PubMed] [Google Scholar]
- Seeley WW, Menon V, Schatzberg AF, Keller J, Glover GH, Kenna H, Reiss AL, Greicius MD. 2007. Dissociable intrinsic connectivity networks for salience processing and executive control. J Neurosci. 27:2349–2356. [DOI] [PMC free article] [PubMed] [Google Scholar]
- Seth AK. 2010. A MATLAB toolbox for Granger causal connectivity analysis. J Neurosci Methods. 186:262–273. [DOI] [PubMed] [Google Scholar]
- Smith SM, Fox PT, Miller KL, Glahn DC, Fox PM, Mackay CE, Filippini N, Watkins KE, Toro R, Laird AR et al. 2009. Correspondence of the brain's functional architecture during activation and rest. Proc Natl Acad Sci USA. 106:13040–13045. [DOI] [PMC free article] [PubMed] [Google Scholar]
- Sridharan D, Levitin DJ, Menon V. 2008. A critical role for the right fronto-insular cortex in switching between central-executive and default-mode networks. Proc Natl Acad Sci USA. 105:12569–12574. [DOI] [PMC free article] [PubMed] [Google Scholar]
- Supekar K, Menon V. 2012. Developmental maturation of dynamic causal control signals in higher-order cognition: a neurocognitive network model. PLoS Comput Biol. 8:e1002374. [DOI] [PMC free article] [PubMed] [Google Scholar]
- Swick D, Ashley V, Turken U. 2011. Are the neural correlates of stopping and not going identical? Quantitative meta-analysis of two response inhibition tasks. Neuroimage. 56:1655–1665. [DOI] [PubMed] [Google Scholar]
- Swick D, Ashley V, Turken AU. 2008. Left inferior frontal gyrus is critical for response inhibition. BMC Neurosci. 9:102. [DOI] [PMC free article] [PubMed] [Google Scholar]
- Taylor KS, Seminowicz DA, Davis KD. 2009. Two systems of resting state connectivity between the insula and cingulate cortex. Hum Brain Mapp. 30:2731–2745. [DOI] [PMC free article] [PubMed] [Google Scholar]
- Touroutoglou A, Hollenbeck M, Dickerson BC, Feldman Barrett L. 2012. Dissociable large-scale networks anchored in the right anterior insula subserve affective experience and attention. Neuroimage. 60:1947–1958. [DOI] [PMC free article] [PubMed] [Google Scholar]
- Uddin LQ, Supekar KS, Ryali S, Menon V. 2011. Dynamic reconfiguration of structural and functional connectivity across core neurocognitive brain networks with development. J Neurosci. 31:18578–18589. [DOI] [PMC free article] [PubMed] [Google Scholar]
- Ullsperger M, Harsay HA, Wessel JR, Ridderinkhof KR. 2010. Conscious perception of errors and its relation to the anterior insula. Brain Struct Funct. 214:629–643. [DOI] [PMC free article] [PubMed] [Google Scholar]
- Ullsperger M, von Cramon DY. 2001. Subprocesses of performance monitoring: a dissociation of error processing and response competition revealed by event-related fMRI and ERPs. Neuroimage. 14:1387–1401. [DOI] [PubMed] [Google Scholar]
- van den Heuvel MP, Mandl RC, Kahn RS, Hulshoff Pol HE. 2009. Functionally linked resting-state networks reflect the underlying structural connectivity architecture of the human brain. Hum Brain Mapp. 30:3127–3141. [DOI] [PMC free article] [PubMed] [Google Scholar]
- Verbruggen F, Logan GD. 2008. Response inhibition in the stop-signal paradigm. Trends Cogn Sci. 12:418–424. [DOI] [PMC free article] [PubMed] [Google Scholar]
- Wager TD, Sylvester CY, Lacey SC, Nee DE, Franklin M, Jonides J. 2005. Common and unique components of response inhibition revealed by fMRI. Neuroimage. 27:323–340. [DOI] [PubMed] [Google Scholar]
- Wen X, Yao L, Liu Y, Ding M. 2012. Causal interactions in attention networks predict behavioral performance. J Neurosci. 32:1284–1292. [DOI] [PMC free article] [PubMed] [Google Scholar]
- Wilk HA, Ezekiel F, Morton JB. 2012. Brain regions associated with moment-to-moment adjustments in control and stable task-set maintenance. Neuroimage. 59:1960–1967. [DOI] [PubMed] [Google Scholar]
- Xue G, Aron AR, Poldrack RA. 2008. Common neural substrates for inhibition of spoken and manual responses. Cereb Cortex. 18:1923–1932. [DOI] [PubMed] [Google Scholar]
- Zhang S, Li CS. 2012. Functional networks for cognitive control in a stop signal task: independent component analysis. Hum Brain Mapp. 33:89–104. [DOI] [PMC free article] [PubMed] [Google Scholar]
Associated Data
This section collects any data citations, data availability statements, or supplementary materials included in this article.