Abstract
Parasitic helminths and allergens induce a type 2 immune response leading to profound changes in tissue physiology, including hyperplasia of mucus-secreting goblet cells1 and smooth muscle hypercontractility2. This response, known as ‘weep and sweep’, requires interleukin (IL)-13 production by tissue-resident group 2 innate lymphoid cells (ILC2s) and recruited type 2 helper T cells (TH2 cells)3. Experiments in mice and humans have demonstrated requirements for the epithelial cytokines IL-33, thymic stromal lymphopoietin (TSLP) and IL-25 in the activation of ILC2s4–11, but the sources and regulation of these signals remain poorly defined. In the small intestine, the epithelium consists of at least five distinct cellular lineages12, including the tuft cell, whose function is unclear. Here we show that tuft cells constitutively express IL-25 to sustain ILC2 homeostasis in the resting lamina propria in mice. After helminth infection, tuft-cell-derived IL-25 further activates ILC2s to secrete IL-13, which acts on epithelial crypt progenitors to promote differentiation of tuft and goblet cells, leading to increased frequencies of both. Tuft cells, ILC2s and epithelial progenitors therefore comprise a response circuit that mediates epithelial remodelling associated with type 2 immunity in the small intestine, and perhaps at other mucosal barriers populated by these cells.
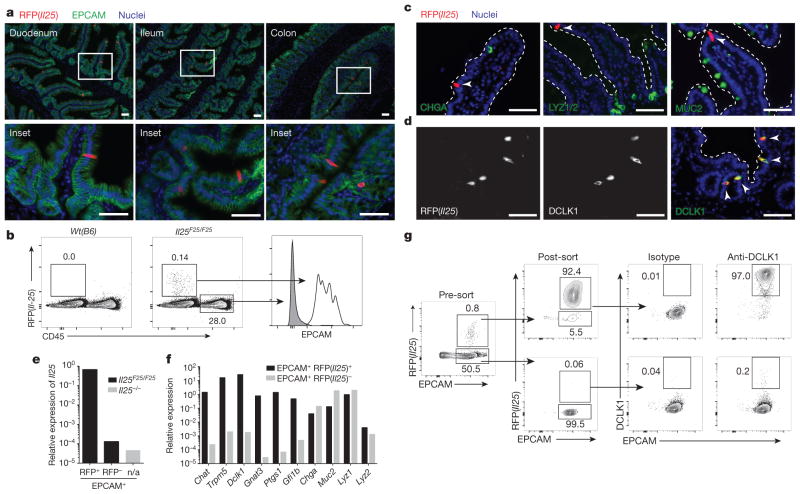
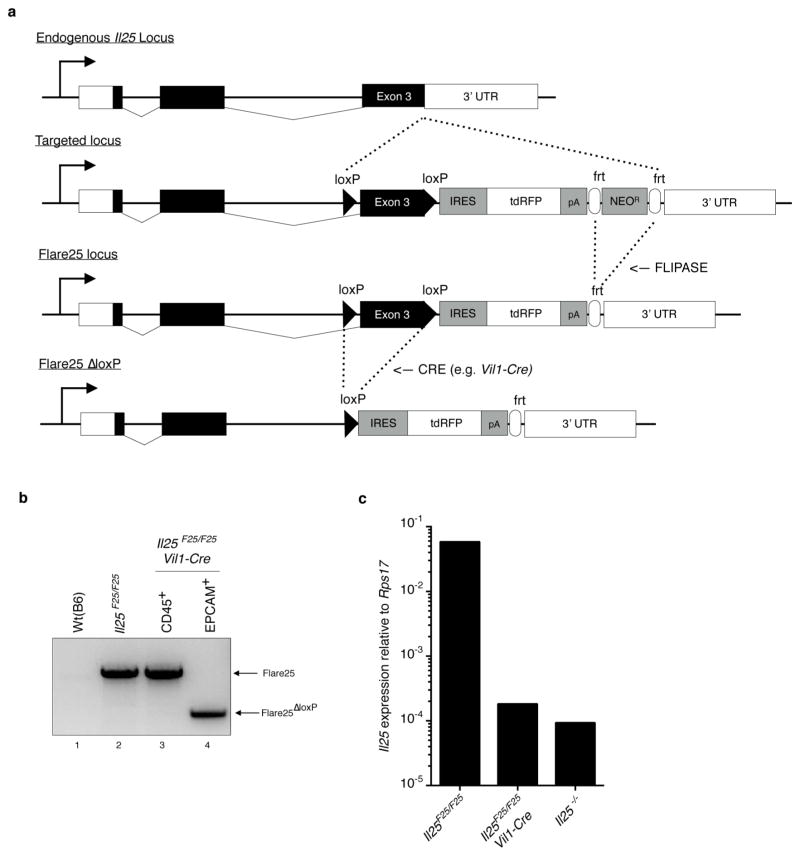
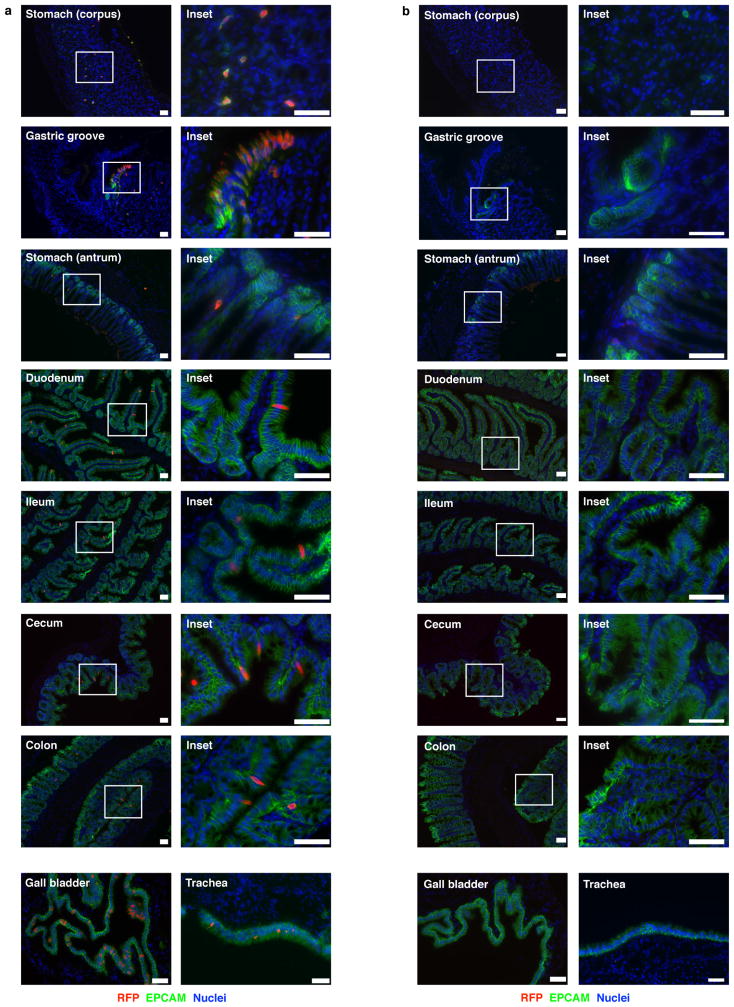
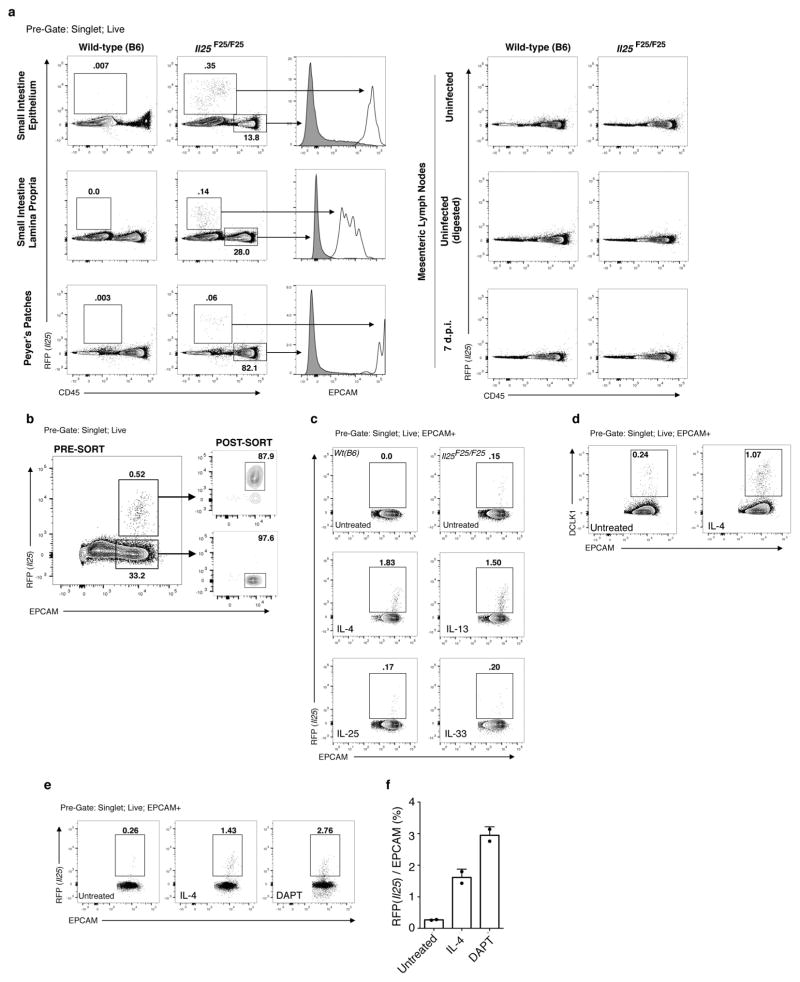
To study the source and regulation of Il25 in vivo, we generated a knock-in mouse termed Flare25 (flox and reporter of Il25; Il25F25/F25) that expresses tandem-dimer red fluorescent protein (RFP) from the Il25 locus and enables conditional deletion of IL-25 activity (Extended Data Fig. 1a). Immunohistochemistry and flow cytometry revealed RFP only in rare epithelial (epithelial cell adhesion molecule (EPCAM)+) cells throughout the digestive tract (Fig. 1a, b and Extended Data Fig. 2). We also found RFP in epithelial cells of the trachea and gall bladder, but not in haematopoietic cells (Extended Data Figs 2 and 3a).
Figure 1. Intestinal tuft cells constitutively express Il25.
a, Indicated tissues from Il25F25/F25 mice stained for RFP (red), EPCAM (green) and 4′,6-diamidino-2-phenylindole (DAPI; blue). b, Flow cytometry of digested jejunum. c, d, Jejunum from Il25F25/F25 mice stained as indicated. Dotted lines outline villi. Arrowheads indicate RFP+ cells. e, f, Quantitative polymerase chain reaction with reverse transcription (RT–PCR) on cells sorted from small intestines of Il25−/− (e) and Il25F25/F25 (e, f) mice. n/a, not applicable. g, Flow cytometry of cells sorted from small intestines of Il25F25/F25 mice and stained with anti-DCLK1. Scale bars,350 μm. All data are biological replicates. Data are representative of two (b–d, g), or at least three (a, e, f) experiments. In a, n >5; in b–d, g, n =2; in e, f, n =3.
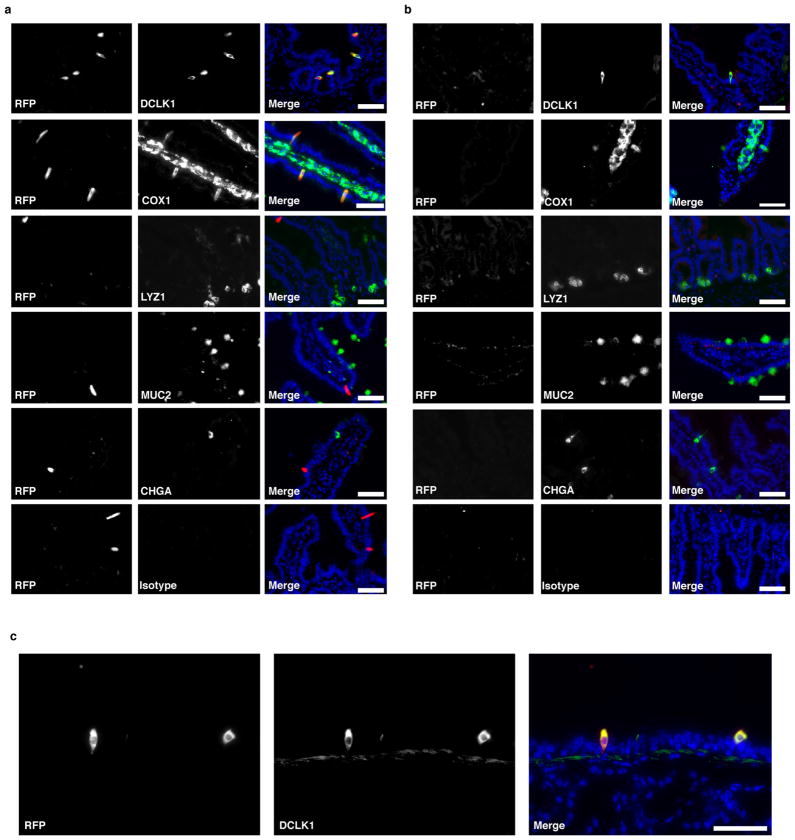
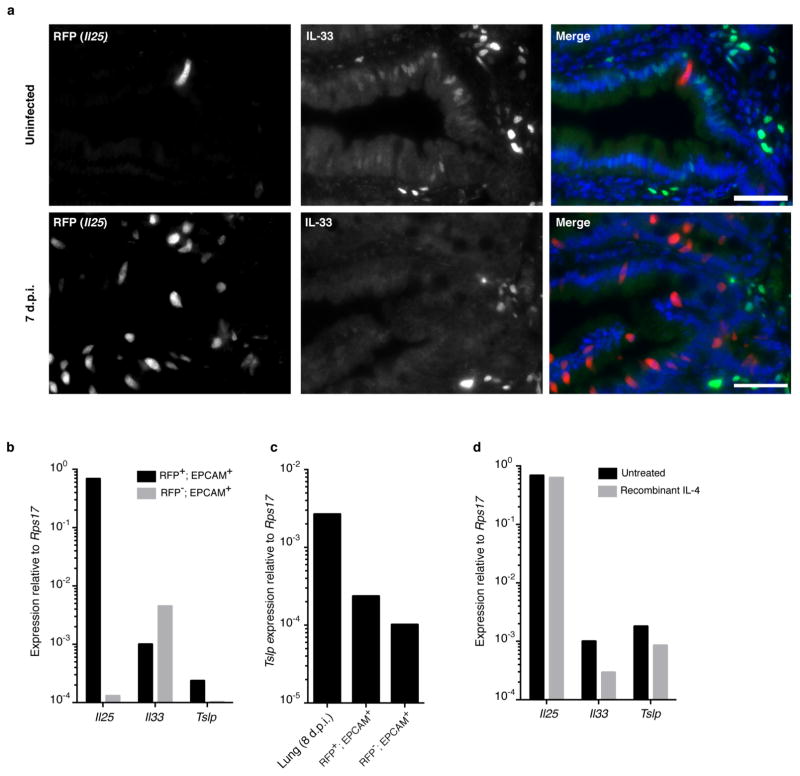
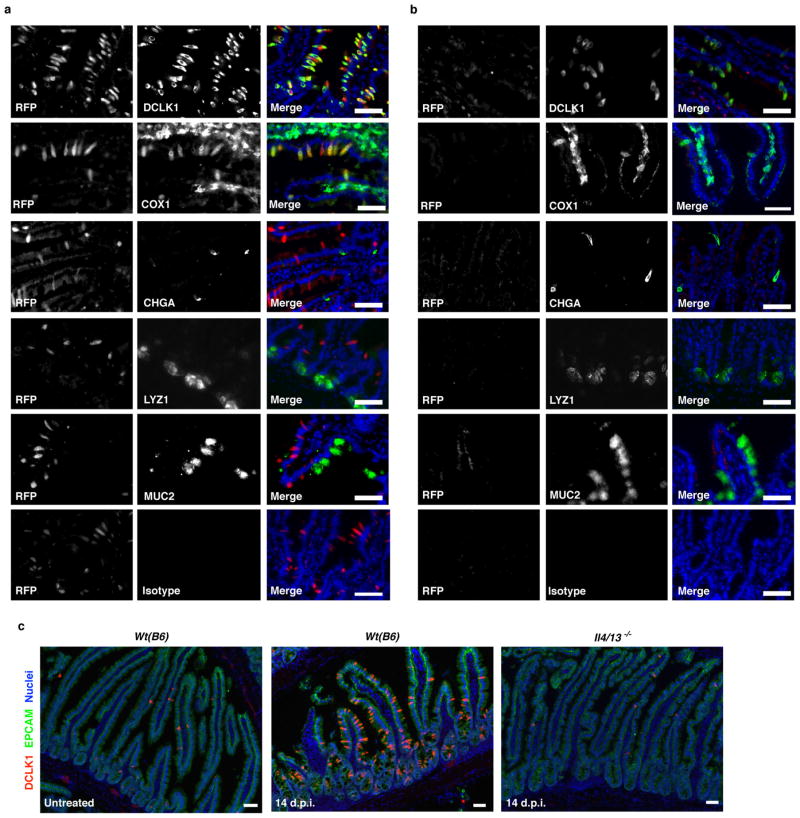
The small intestinal epithelium consists of a single cell layer continuously repopulated from stem cells in underlying crypts; cells progress up the villi and are sloughed into the lumen with a turnover of 3–5 days. Nascent progenitors proliferate in the transit amplifying region before fate commitment to become absorptive enterocytes or, less frequently, one of four secretory cell types: Paneth, enteroendocrine, goblet, or tuft12,13. We tested whether Flare25 marks one or more secretory lineages. Immunohistochemistry showed no colocalization of RFP with the enteroendocrine marker chromogranin A (CHGA), the Paneth-cell markers lysozyme (LYZ)1 and LYZ2, or the goblet-cell marker mucin 2 (MUC2) (Fig. 1c and Extended Data Fig. 4a, b). Unexpectedly, expression of RFP and the tuft-cell markers doublecortin-like kinase 1 (DCLK1) and epithelial prostaglandin-endoperoxide synthase 1 (PTGS1) completely overlapped (Fig. 1d and Extended Data Fig. 4a, b). Transcriptional analysis comparing sorted RFP+EPCAM+ with RFP−EPCAM+ intestinal epithelium demonstrated Il25 expression almost exclusively in RFP+ cells (Fig. 1e), and confirmed co-staining results (Fig. 1f and Extended Data Fig. 3b). The tuft-cell markers Dclk1, Ptgs1, Gnat3, Chat, Gfi1b and Trpm5 (ref. 14, 15) were each enriched at least 750-fold in RFP+ cells, while Chga, Muc2, Lyz1 and Lyz2 showed no enrichment (Fig. 1f). Finally, >99% of sorted RFP+EPCAM+ and <1% of RFP−EPCAM+ cells were DCLK1+ by flow cytometry (Fig. 1g). Given these results, and our identification of RFP+ cells only in epithelia where tuft cells have been noted (Extended Data Figs 2 and 4c; data not shown)14, we conclude that tuft cells constitutively express Il25 and that all Il25+ cells are tuft cells, at least as assessed using this reporter. By contrast, tuft cells are not major sources of TSLP or IL-33 in the small intestine (Extended Data Fig. 5).
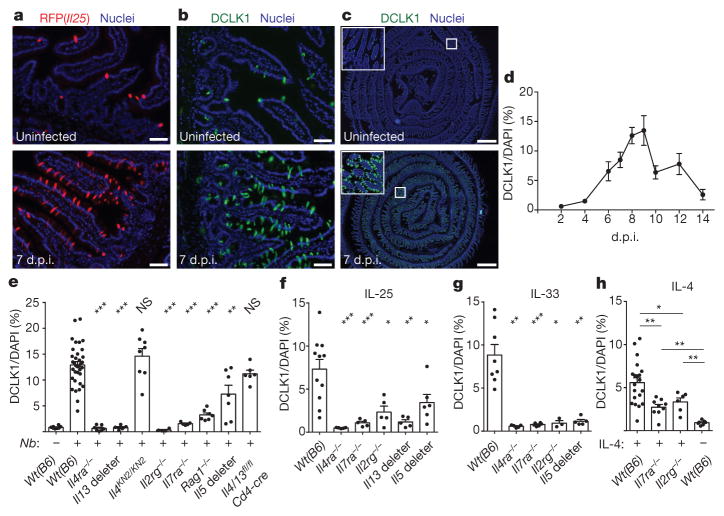
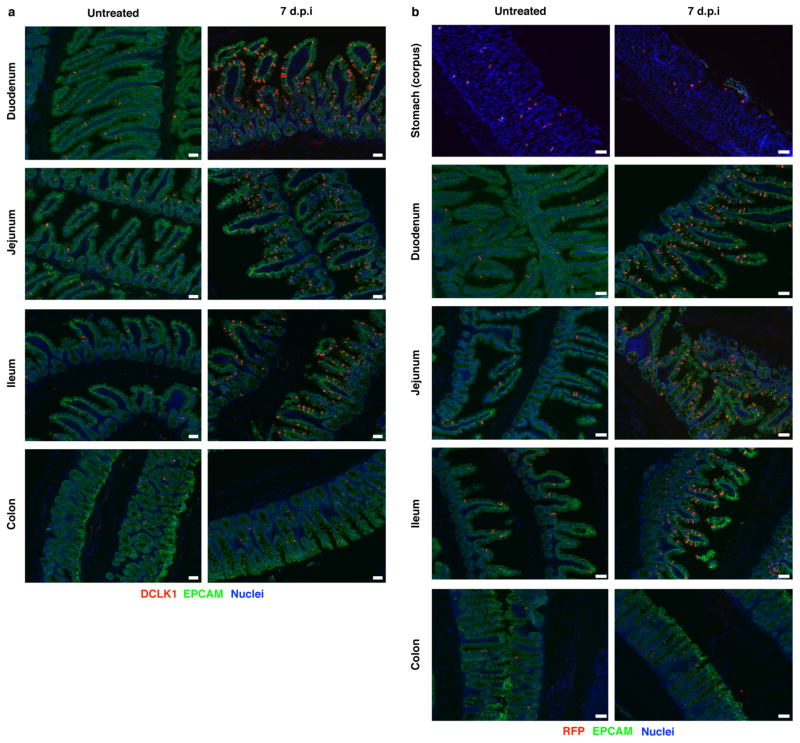
Although intestinal tuft cells (also called brush cells) were discovered more than 50 years ago, their function remains largely unknown. Given the link between IL-25 and type 2 immunity, we investigated the role of tuft cells during infection of mice with the roundworm Nippostrongylus brasiliensis, which induces a strong type 2 immune response that clears intestinal worms 7–10 days post-infection (d.p.i.). Although tuft cells account for <1% of intestinal epithelium in uninfected mice, we found dramatic (>15-fold) tuft cell hyperplasia in the small intestine 7 d.p.i. (Fig. 2a–c). The extent of hyperplasia was uniform throughout the small intestine (Extended Data Fig. 6), but we focused further experiments on the duodenum and jejunum, where N. brasilienesis resides. We observed no hyperplasia in the stomach or colon (Extended Data Fig. 6), through which the worms briefly transit. Hyperplasia in the small intestine peaked 8–9 d.p.i. and returned to near homeostatic levels by 14 d.p.i. (Fig. 2d). As in uninfected mice, RFP+ cells were CHGA−, MUC2− and LYZ1/2−, and DCLK1+ and PTGS1+ 7 d.p.i. (Extended Data Fig. 7). Given the complete overlap of RFP and DCLK1, we used these markers interchangeably in further experiments.
Figure 2. Worm infection induces IL-13-dependent tuft cell hyperplasia.
a–c, Jejunum from Il25F25/F25 mice stained for RFP (a) or DCLK1 (b, c). d–h, Immunohistochemical quantification of tuft cells (DCLK1+) in duodenum/jejunum of mice infected with N. brasiliensis for indicated days (d) or 7 days (e) or injected with indicated protein (f–h). Scale bars: 50 μm (a, b), 1 mm (c). All data are biological replicates. Data are representative of at least three (a–c) experiments or pooled (d–h) from multiple experiments. In a–c, n >10; in d, day 2: n = 2; days 4, 12, 14: n = 4; day 9: n = 5; days 6, 8, 10: n = 6; day 7: n =8; in e–h, n is as shown. Nb, N. brasiliensis. *P <0.05; **P <0.01, ***P < 0.001; NS, not significant (Mann–Whitney test). Error bars represent mean ±standard error of the mean (s.e.m.).
Since helminth-induced goblet cell hyperplasia is mediated by IL-13 (ref. 16), we asked whether IL-13 also mediates tuft cell hyperplasia. Indeed, tuft cell hyperplasia was absent in infected interleukin 4 receptor α (Il4ra)-deficient mice, in which both IL-4 and IL-13 signalling is disrupted, and in Il13 deleter mice (Il13cre/cre; Gt(ROSA)26STOP-flox::DTA/+) (Fig. 2e). Because tuft cell hyperplasia was normal in IL-4-deficient mice (Il4KN2/KN2) (Fig. 2e), and because the predominant role of IL-13 in IL-25-mediated pathologies is well established17,18, we conclude that IL-13 is the primary signal driving tuft cell hyperplasia in vivo. We also found Il4/13-dependent tuft cell hyperplasia after infection with Heligmosomoides polygyrus, another intestinal parasite (Extended Data Fig. 7c).
Lamina propria ILC2s are the principal intestinal source of IL-13 in the first week of N. brasiliensis infection19,20. Accordingly, tuft cell hyperplasia was absent or reduced 7 d.p.i. in mice lacking nearly all lymphoid cells (Il7ra−/−, Il2rg−/−) or IL-5+ ILC2 cells (Il5 deleter: Il5cre/cre;Gt(ROSA)26STOP-flox::DTA/STOP-flox::DTA) (Fig. 2e). Hyperplasia was greatly reduced in Rag1−/− mice, but nearly normal in Il4/13fl/fl; Cd4-cre mice (Fig. 2e), consistent with the model that T cells produce little IL-13 at early time points but can boost IL-13 levels by supporting ILC2 activation21.
To test if type 2 cytokines are sufficient to induce tuft cell hyperplasia, we injected mice with stabilized IL-4–anti-IL-4 complexes that mimic IL-13 signalling, or with IL-25 or IL-33. All three treatments expanded tuft cells, but the effects of IL-25 and IL-33 were IL4RA-dependent and severely reduced in the absence of lymphoid cells (Il7ra−/−, Il2rg−/−), Il5+ cells, or Il13+ cells (Fig. 2f, g), suggesting that IL-25 and IL-33 trigger hyperplasia indirectly by inducing IL-13 production in ILC2s. By contrast, tuft cell hyperplasia was reduced only partially in Il7ra−/− and Il2rg−/− mice injected with IL-4 (Fig. 2h), raising the possibility that exogenous IL-4 or endogenous IL-13 induces tuft cell hyperplasia by directly targeting the epithelium.
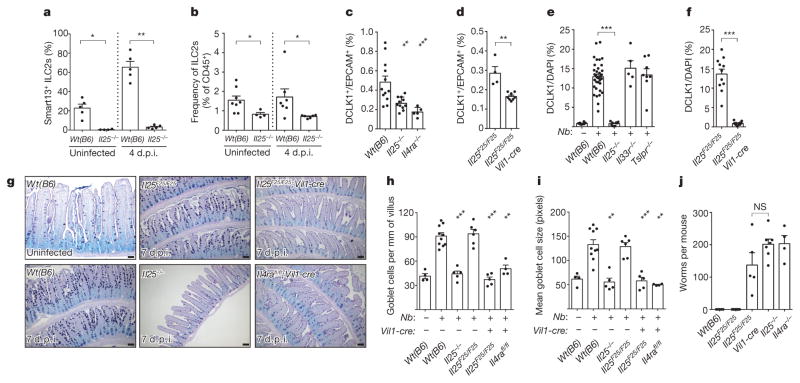
Consistent with this model, recombinant IL-4 and IL-13 induced tuft cell hyperplasia in intestinal organoids, which contain only epithelial cells; by contrast, IL-25 and IL-33 neither induced hyperplasia nor enhanced induction by IL-4/IL-13 in this system (Fig. 3a and Extended Data Fig. 3c, d). As expected, tuft cell hyperplasia was absent in Il4rafl/fl; Vil1-cre mice, confirming that tuft cell hyperplasia requires IL4RA signalling in the intestinal epithelium in vivo (Fig. 3b). We conclude that ILC2-derived IL-13 signals through IL4RA in the intestinal epithelium to induce tuft cell hyperplasia.
Figure 3. IL-13 signalling in epithelial progenitors gives rise to tuft cell hyperplasia.
a, Flow cytometric quantification of RFP+ tuft cells in intestinal organoids grown from Il25F25/F25 mice and treated with indicated recombinant proteins (20 ng ml−1). b, Immunohistochemical quantification of tuft cells (DCLK1+) in duodenum/jejunum of mice infected 7 days with N. brasiliensis. c, Jejunum of Lgr5cre-Ert2/+; Gt(ROSA)26STOP-flox::RFP/+ mice treated 5 days with tamoxifen and stained for DCLK1 (green) and DAPI (blue). N. brasiliensis infection as indicated. d, e, Jejunum of Il25F25/F25 (d) or Wt(B6) (e) mice infected for 7 days (d) or indicated number of days (e) with N. brasiliensis and stained for RFP (red) and Ki67 (green) (d) or DCLK1 (green) and DAPI (blue) (e). d, e, Dotted lines outline villi. Scale bars, 50 μm. Arrowheads indicate Ki67 and RFP overlap. Data in a are technical replicates, all other data are biological replicates. Data are representative of two (c–e) or three (a) experiments or pooled (b) from multiple experiments. In a, b, n is as shown; in c, uninfected: n =4; 7 d.p.i.: n =5; in d, n =2; in e, n =4. Nb, N. brasiliensis. *P < 0.05; NS, not significant (Mann–Whitney test). Error bars represent mean ±s.e.m.
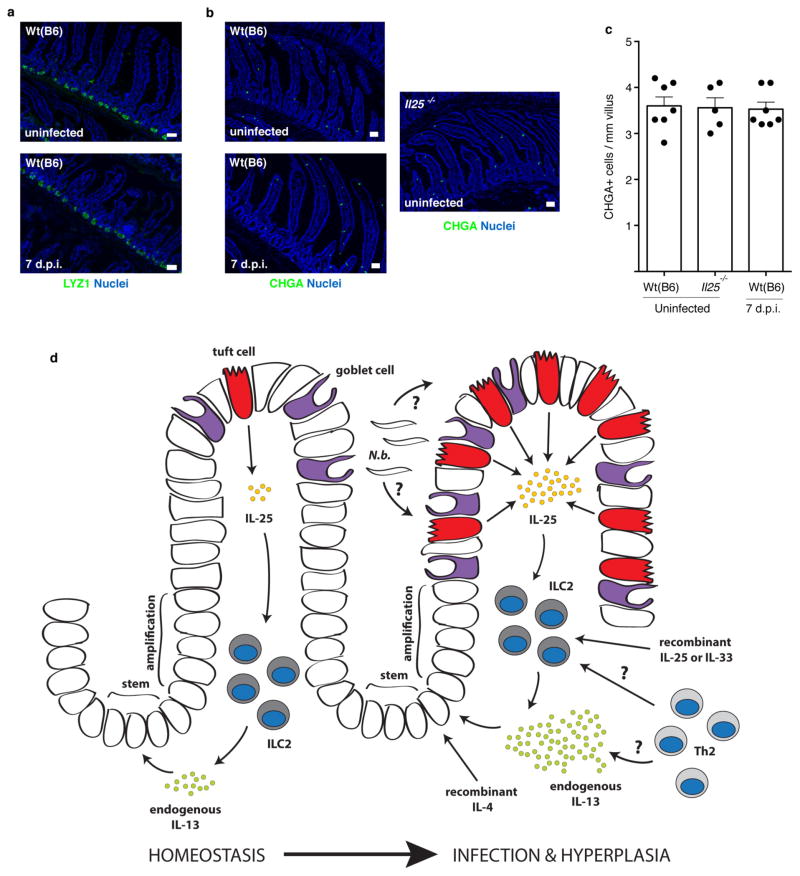
We examined several possible mechanisms of IL-13-induced tuft cell hyperplasia. First, CHGA+ cell numbers did not change during infection (Extended Data Fig. 8b, c), confirming a selective increase in tuft cells rather than a global expansion of intestinal epithelium. Through lineage tracing, we confirmed that tuft cells, as under resting conditions, continue to arise from Lgr5+ stem cells during N. brasiliensis-induced hyperplasia (Fig. 3c). Since Il4ra is expressed throughout the intestinal epithelium22,23, tuft cell expansion could occur either before or after lineage commitment; however, we found expression of the proliferation marker Ki67 in only a few nascent tuft cells (Fig. 3d), suggesting that tuft cell hyperplasia is induced in the stem or transit amplifying compartments. Consistent with this model, kinetic studies revealed a wave of hyperplastic tuft cells appearing near the crypts 6 d.p.i. and moving up the villi by 8 d.p.i. (Fig. 3e). Taken together, these results suggest that IL-13 signalling in uncommitted intestinal epithelium shifts cell fate decisions towards the tuft (and goblet) cell lineage, perhaps by altering the balance of Notch signalling12. Indeed, the Notch signalling inhibitor N-[N-(3,5-Difluorophenacetyl)-3-alanyl]-S-phenylglycine t-butyl ester (DAPT) also induced tuft cell hyperplasia in organoids (Extended Data Fig. 3e–f).
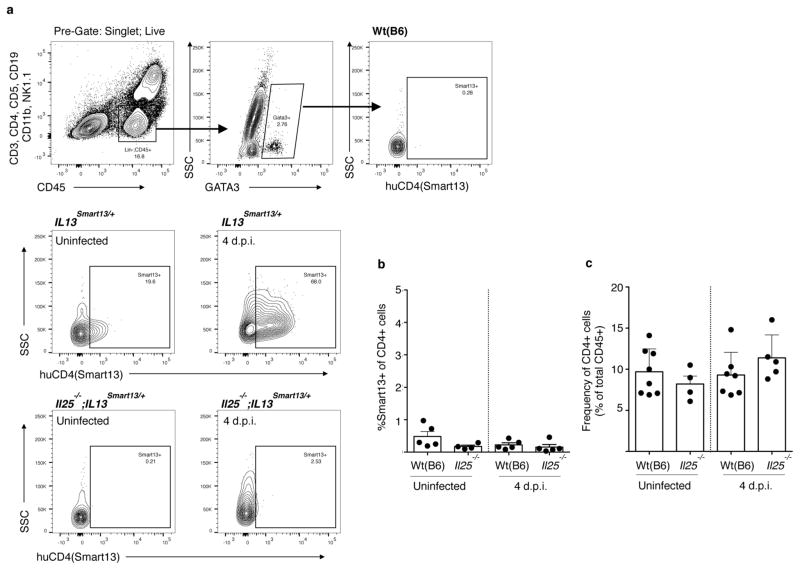
Since ILC2s secrete IL-13 in response to IL-25, and tuft cells are the source of intestinal IL-25, we hypothesized a feed-forward circuit between tuft cells, ILC2s, and epithelial progenitors (Extended Data Fig. 8d). Tuft cells constitutively express Il25 (Fig. 1a, e) and some lamina propria ILC2s constitutively express Il13 (ref. 24), so we first examined the interaction of tuft cells and ILC2s in uninfected mice. Using Il13Smart/Smart reporter mice to mark IL-13-secreting cells, we found that ~20% of lamina propria ILC2s make IL-13 in the absence of infection, and this is dependent on IL-25 (Fig. 4a and Extended Data Fig. 9a). The frequency of ILC2s is also decreased in Il25−/− mice (Fig. 4b), suggesting that tuft-cell-derived IL-25 promotes ILC2 maintenance in the small intestine. ILC2 activation remains IL-25-dependent at 4 d.p.i., the latest time point before worm clearance at which we could recover viable cells from infected intestines (Fig. 4a and Extended Data Fig. 9a). TH2 cells are not a major source of IL-13 at rest or 4 d.p.i. (Extended Data Fig. 9b, c).
Figure 4. Tuft cells regulate intestinal physiology through an ILC2–epithelium response circuit.
a, b, Flow cytometric analysis of lamina propria ILC2s (Lin−, CD45+, GATA3+) from Il13Smart/+ and Il25−/−;Il13Smart/+ mice. c, d, Flow cytometric quantification of tuft cells (DCLK1+) in jejunum of uninfected mice. e, f, Immunohistochemical quantification of tuft cells (DCLK1+) in jejunum/duodenum of mice infected 7 days with N. brasiliensis. In e, wild-type controls are the same as in Fig. 2e. g, Jejunum of mice treated as indicated and stained for goblet cells with periodic acid Schiff (PAS) Alcian blue. h, i, Goblet cell number (h) and size (i) calculated from imaging. j, Intestinal worm burden in mice infected 10 days with N. brasiliensis. Scale bars, 50 μm. All data are biological replicates. Data are representative of two (g) experiments or pooled (a–f, h–j) from multiple experiments. In g, n is as shown in h and i; in a–f, h–j, n is as shown. Nb, N. brasiliensis. *P <0.05; **P <0.01; ***P < 0.001; NS, not significant (Mann–Whitney test). Error bars represent mean ±s.e.m.
Our model of an ILC2–epithelial circuit predicts that loss of homeostatic IL-25 or IL-13 would reduce the frequency of tuft cells. Indeed, the already small number of tuft cells was further reduced in uninfected Il25−/− and Il4ra−/− mice (Fig. 4c), with the remaining tuft cells in these mice probably representing stochastic production independent of type 2 immunity. The frequency of CHGA+ cells was unchanged in Il25−/− mice (Extended Data Fig. 8b, c). We generated Il25F25/F25;Vil1-cre mice to delete Il25 selectively from the epithelium (Extended Data Fig. 1b, c). The basal frequency of tuft cells again decreased (Fig. 4d), confirming that tuft cells are the relevant source of IL-25 upstream of homeostatic production of IL-13 by intestinal ILC2s.
The dependence of tuft cell frequency on autocrine IL-25 was even more striking during N. brasiliensis infection. Tuft cell hyperplasia was absent in Il25−/− and Il25F25/F25;Vil1-cre mice 7 d.p.i., but unaffected by the absence of TSLP or IL-33 signalling (Fig. 4e, f). Taken together, our data support a model in which IL-25 from tuft cells induces ILC2s to produce IL-13, which in turn regulates the frequency of tuft cells in the intestinal epithelium. The capacity of IL-13 to alter the cellular composition of the epithelium raised the possibility that tuft cells might also regulate other secretory lineages. While neither CHGA+ nor Paneth cell hyperplasia occurred during worm infection (Extended Data Fig. 8a–c), goblet cell hyperplasia and hypertrophy were absent in infected mice lacking epithelial IL-25 (Fig. 4g–i). Moreover, as in Il25−/− mice, Il25F25/F25;Vil1-cre mice failed to clear worms by 10 d.p.i., thereby identifying tuft cells as key regulators of the type 2 immune response (Fig. 4j).
Our findings uncover an unexpected role for tuft cells in intestinal immune defence, suggest a link between type 2 immune signalling and epithelial cell fate decisions, and describe an ILC2–epithelial response circuit that regulates the cellular composition of the intestinal epithelium. This circuit could integrate homeostatic signals, such as ILC2 activation during feeding24, with additional signals to tune the barrier’s absorptive–secretory balance. Indeed, despite the feed-forward nature of the circuit, tuft and goblet cell hyperplasia are restrained during homeostasis, suggesting that worm infection provides another activating signal or removes an inhibitory signal. Given their positioning in the intestinal epithelium, tuft cells appear poised to monitor luminal homeostasis and transduce activating signals to immune cells in the lamina propria. Interestingly, tuft cells encode the complete bitter and umami taste transduction pathways and release acetylcholine when activated14. In the airways and urethra, this pathway has been linked to smooth muscle contraction and is proposed to promote innate defence against invading bacteria25–28.
In the absence of IL-25, other signals such as IL-33 become induced5 and can activate ILC2s to mediate expansion of tuft and goblet cells associated with worm clearance. Nonetheless, our findings delineate a key role for tuft cells in the physiological host response to helminths. Tuft cells appear to be the primary source of IL-25 in the lung as well (Extended Data Fig. 4c); thus, their involvement may extend to other conditions in which IL-25 has been implicated, such as airway disease11,29 and allergic diarrhoea30. Indeed, mucosal tuft cell hyperplasia may be a generalizable hallmark of type 2 immune responses, and strategies to short-circuit tuft cell activation may have therapeutic potential for these widespread afflictions.
METHODS
Il25 reporter mice
Flare25 mice were generated by homologous gene targeting in C57BL/6 embryonic stem cells. A 2.2 kb 3′ homology arm beginning in the 3′3UTR of Il25 was amplified from C57BL/6 genomic DNA and cloned into pKO915-DT (Lexicon Genetics) using BamHI and HindIII. Next, a DNA strand encoding (from 5′ to 3′) a loxP site and the complete third exon of Il25 was synthesized (Blue Heron). This synthetic strand and genomic DNA were used as PCR templates to generate a 2.1 kb 5′ homology arm by overlap extension PCR. The 5′ homology arm was cloned into the pK0915-DT vector containing the 3′ homology arm using XhoI and EcoRI. Finally, a reporter cassette encoding (in order from 5′ to 3′): a loxP site, encephalomyocarditis virus IRES, tandem RFP, bovine growth hormone poly(A), and a frt-flanked neomycin resistance cassette, was subcloned into the homology arm containing pKO915-DT vector using AscI. The final construct was linearized with NotI and transfected by electroporation into C57BL/6 embryonic stem cells. Cells were grown on irradiated feeders with the aminoglycoside G418 in the media, and neomycin-resistant clones were screened for 5′ and 3′ homologous recombination by PCR. Four positive clones were selected and further tested to confirm insertion of the 5′loxP site. Two clones were selected for injection into albino C57BL/6 blastocysts to generate chimaeras, and the male pups with highest ratios of black-to-white coat colour from a single clone were selected to breed with homozygous Gt(ROSA26)FLP1/FLP1 females (Jackson Laboratories catalogue no. 009086) to excise the neomycin resistance cassette. Deletion of neomycin was confirmed by PCR. Flare25 genotyping primers were as follows: KI_F: GTATTGGGTGCCAGAACAG; KI_R: GGGTCGCTACAGACGTTGTTTGTC (715 bp knock-in band; 374 bp floxed band); WT_F: ACTTTACCACAACCAGACG; WT_R: AGTTTCTCCCCAAGTCCTCC (290 bp wild-type band).
Other mice
Mice were maintained in the University of California San Francisco (UCSF) specific pathogen-free animal facility in accordance with the guidelines established by the Institutional Animal Care and Use Committee and Laboratory Animal Resource Center. All experimental procedures were approved by the Laboratory Animal Resource Center at the UCSF. Mice aged 6–12 weeks were used for all experiments. Mice were age- and sex-matched in figures displaying a single representative experiment. Pooled results include both male and female mice. For some experiments, mice encoding a reporter allele that does not impact endogenous gene expression (B6.Il13Smart or B6.Arg1YARG) were used as wild-type controls. Il7ra−/− (B6.129S7- Il7rtm1Imx/J; 002295), Rag1−/− (B6.129S7-Rag1tm1Mom/J; 002216), Cd4-cre (B6.Cg-Tg(Cd4-cre); 022071) and wild-type (C57BL/6J; 000664) mice were purchased from Jackson Laboratories. Il4ra−/− (BALB/c-Il4ratm1Sz/J; 003514) mice were purchased from Jackson Laboratories and backcrossed to C57BL/6J for at least eight generations. Il2rg−/− (B10;B6-Il2rgtm1Wjl; 4111-F) were purchased from Taconic as Rag-2−/−;Il2rg−/− and outcrossed to isolate the Il2rg allele. B6.Il25−/−, B6.Tslpr−/−, B6.Il33r−/−, B6.Il13Smart/Smart, B6.Il4KN2/KN2, B6.Il5cre/cre;Gt(ROSA)26STOP-flox::DTA/STOP-flox::DTA and B6.Il13cre/cre; Gt(ROSA)26STOP-flox::DTA/+ mice were obtained or generated as described9,19,24. BALB/c.Il4/13fl/fl mice were generated as described20 and backcrossed to C57BL/6J for at least eight generations. B6.Il4rafl/fl mice were provided by A. Chawla. B6.Tg(Vil1-cre) mice were provided by A. Ma. B6.Lgr5Egfp::cre-Ert2/+; Gt(ROSA)26STOP-flox::RFP/+ mice were provided by O. Klein.
Mouse infection and treatment
Infectious third-stage N. brasiliensis larvae (L3) were raised and maintained as described19. Mice were infected subcutaneously with 500 N. brasiliensis L3 or by oral gavage with 200 H. polygyrus L3, and were killed at the indicated time points to collect tissues for staining or to count intestinal worm burden, as described19. Mice were given IL-4, IL-25, and IL-33 as follows: IL-4 complexes were generated by incubating 2 μ g mouse IL-4 (R&D Systems) with 10 μ g LEAF purified anti-mouse IL4 antibody (clone 11B11, Biolegend) for 30 min at room temperature, and then administered on day 0 and day 2. IL-25 and IL-33 were given in doses of 500 ng on days 0, 1, 2, and 3. All injections were given intraperitoneally in 200 μ l, and all intestines were harvested for sectioning and staining on day 4. For lineage tracing, 2.5 mg of tamoxifen in 250 μ l corn oil were given intraperitoneally 5 days before harvest.
Fixed tissue preparation and staining
For immunohistochemistry, tissues were fixed in 4% paraformaldehyde for 3 h at 4 °C followed by PBS wash and overnight incubation in 30% (w/v) sucrose. For stomach, small intestine, caecum and large intestine, tissues were flushed with PBS before fixation. Unless otherwise noted, the proximal 10–12 cm of small intestine (duodenum and partial jejunum) were harvested. Tissues were embedded in Optimal Cutting Temperature Compound (Tissue-Tek) and stored at −80 °C before sectioning (8–10 μ m) on a Cryostat (Leica). To facilitate analysis of the entire sample, small and large intestines were coiled into a ‘Swiss roll’ before embedding.
Immunohistochemistry was performed in Tris/NaCl blocking buffer (0.1 M Tris-HCl, 0.15 M NaCl, 5 μgml−1 blocking reagent (Perkin Elmer), pH 7.5) as follows: 1 h 5% goat serum, 1 h primary antibody, 40 min secondary antibody, 5 min DAPI (Roche). For RFP co-labelling experiments, slides were stained for MUC2, LYZ1, CHRA, or DCLK1 as described above, excluding the DAPI step. RFP staining was then as follows: 1 h rabbit IgG, 20 min each of biotin and streptavidin block (Vector Labs), 1 h anti-RFP-biotin, 40 min streptavidin-Cy3 (Caltag), and 5 min DAPI. See Extended Data Table 1 for a list of antibodies used in this study.
For goblet cell staining, 8-cm sections of jejunum were fixed for 3 h in 10% buffered formalin (Fisher Scientific) at 4 °C before coiling into a ‘Swiss roll’ and returning to formalin. After 24 h, tissues were moved to 70% ethanol for storage. Tissue processing, paraffin embedding, and sectioning were performed by the UCSF Mouse Pathology Core. Periodic acid Schiff (PAS) and Alcian blue staining were performed as follows: cleared with xylenes (Fisher Scientific), rehydrated, 30 min in Alcian blue (Thermo Scientific), 5 min in periodic acid (Thermo Scientific), 15 min in Schiff reagent (Thermo Scientific), dehydrated, and mounted. Brightfield and fluorescent images were acquired with an AxioCam HR camera on an AxioImagerM2 upright microscope (Zeiss).
Tuft and goblet cell quantification
In uninfected mice, a 2.5-cm section of small intestine was harvested beginning 10 cm distal to the stomach and processed into a single-cell epithelial suspension as described later. After analysis by flow cytometry, frequency of tuft cells was calculated as number of DCLK1+EPCAM+ cells/total number of EPCAM+ cells. Because viable epithelial cells cannot be harvested from N. brasiliensis-infected intestines from ~5 to ~12 d.p.i., immunohistochemistry was used to quantify tuft cell frequency in infected mice. The proximal 10 cm of small intestine were harvested and stained for DCLK1 as described earlier. A 4 ×4 grid of images was collected at ×200 magnification and the total area of DCLK1 and DAPI staining above background was calculated using ImageJ. Tuft cell frequency was calculated as DCLK1 staining area/DAPI staining area.
For goblet cell quantification, tissue sections were prepared and stained with PAS Alcian blue as described earlier. Goblet cells were manually counted and the total length of all analysed villi was measured using ImageJ. Goblet cell frequency was expressed as number of goblet cells/millimetre of villus. At least 15 villi were counted for each replicate. Mucus production was estimated by measuring the area of at least 15 goblet cells for each biological replicate.
Single-cell tissue preparation
For single-cell epithelial preparations, small intestines were flushed with PBS, opened, and rinsed with PBS to remove luminal contents. Two-and-a-half- to five-cm-long segments of jejunum were incubated with rocking for 20 min at 37 °C in 5 ml PBS containing 2.5 mM EDTA (Sigma-Aldrich), 0.75 mM dithiothreitol (DTT; Sigma-Aldrich), and 10 μgml−1 DNaseI (Sigma-Aldrich). Tissues were shaken vigorously for 30 s and released cells were incubated with rocking for 10 min at 37 °C in 5 ml HBSS (Ca2+/Mg2+ free) containing 1.0 U ml−1 Dispase (Gibco) and 10 μgml−1 DNaseI. Digested cells were passed through a 70 μ m filter and washed once before staining for flow cytometry.
For lamina propria preparations, small intestine was harvested from 4–10 cm distal to the stomach (duodenum/jenunum), flushed with PBS, opened, and thoroughly cleaned with PBS. Intestines were incubated with gentle rocking for 15 min at 37 °C in 10 ml HBSS (Ca2+/Mg2+ free) supplemented with 5% fetal calf serum (FCS), 10 mM HEPES (UCSF Cell Culture Facility), 10 mM DTT and 5 mM EDTA. Intestines were gently vortexed, supernatants discarded, and incubation repeated with fresh DTT/EDTA solution. Next, intestines were incubated with gentle rocking for 20 min at 37 °C in 20 ml HBSS (Ca2+/Mg2+ replete) supplemented with 5% FCS and 10 mM HEPES. After incubation, intestines were gently vortexed, cut into small pieces and incubated with gentle rocking for 30 min at 37 °C in 5 ml HBSS (Ca2+/Mg2+ replete) supplemented with 5% FCS, 10 mM HEPES, 30 μgml−1 DNaseI, and 0.1 Wunsch ml−1 LiberaseTM (Roche). After digest, intestines were mechanically dissociated in GentleMACS C tubes (Miltenyi Biotec), passed through a 70 μ m filter, and washed. The resulting cell pellet was resuspended in 4 ml 40% Percoll (Sigma-Aldrich), underlaid with 4 ml 90% Percoll and centrifuged at 2,200 r.p.m. for 20 min at 4 °C. The 40/90 interphase of the Percoll gradient was harvested, washed, and stained for flow cytometry.
Flow cytometry
For surface staining, single-cell suspensions prepared as described earlier were incubated with anti-CD16 and CD32 monoclonal antibodies (UCSF Antibody Core Facility) for 10 min at 4 °C. The cells were stained with antibodies to surface markers for 20 min at 4 °C followed by DAPI for dead cell exclusion. See Extended Data Table 1 for a list of antibodies used in this study.
For intracellular DCLK1 staining, single-cell epithelial suspensions were prepared from 2.5 cm sections of small intestine harvested 8 cm distal to the stomach. Staining was as follows: 15 min at 4 °C in Violet Live/Dead fixable stain (Life Technologies), 15 min at room temperature in 2% paraformaldehyde (Electron Microscopy Sciences), 20 min at room temperature in saponin-based permeabilization and wash (perm/wash) reagent (Life Technologies) supplemented with 10% goat serum, 30 min with rabbit anti-doublecortin-like kinase (Abcam; ab31704) in perm/wash, 20 min in F(ab′)2 goat anti-rabbit IgG-Alexa Fluor 488 (Life Technologies) and rat anti-EPCAM-PerCP-Cy5.5 (Biolegend; 16A8). For intracellular GATA3 staining, single-cell lamina propria suspensions were prepared from the small intestines as described earlier and stained according to manufacturer’s protocol for FoxP3/Transcription Factor Staining Buffer Set (eBiosciences).
Samples were analysed on an LSR II (BD Biosciences) with four lasers (403 nm, 488 nm, 535 nm, and 633 nm). Samples were FSC-A/SSC-A gated to exclude debris, FSC-W/FSC-A gated to select single cells, and gated to exclude DAPI+ dead cells. Data were analysed with FlowJo 10 (Treestar).
Quantitative RT–PCR
Single-cell epithelial suspensions were isolated and stained as described earlier and then sorted into RFP+EPCAM+ and RFP−EPCAM+ populations using a MoFlo XDP (Beckman Coulter). RNA was isolated using the Micro Plus RNeasy kit (Qiagen) and reverse transcribed using the SuperScript Vilo Master Mix (Life Technologies). The resulting cDNA was used as template for quantitative PCR with the Power SYBR Green reagent on a StepOnePlus cycler (Applied Biosystems). Transcripts were normalized to Rps17 (40S ribosomal protein S17) expression. See Extended Data Table 1 for a list of primers used in this study.
Organoid culture
Small intestinal crypt-derived organoids were grown as described31, replacing recombinant R-spondin with supernatants from R-spondin expressing L-cells (provided by O. Klein). Crypts were harvested from Il25F25/F25 mice and plated on day 0. On day 3 and day 5, media were replaced and organoids were treated with 20 ng ml−1 of the indicated recombinant protein. On day 6 organoids were harvested into HBSS (Ca2+/Mg2+ replete) containing 200 U ml−1 Collagenase I (Gibco) and 1.8 U ml−1 Dispase (Gibco). Organoids were incubated for 1.5 h at 37 °C with shaking, washed, and then stained for flow cytometry as described earlier.
Statistical analysis
All experiments were performed using randomly assigned mice without investigator blinding. All data points and n values reflect biological replicates (that is, mice), except in Fig. 3a, where data points on the graph represent technical replicates. No data were excluded. Where noted in the figures, statistical significance was calculated without assumption of normal distribution using a Mann–Whitney test. Experimental groups included a minimum of three biological replicates, as required by the Mann–Whitney test. Intragroup variation was not assessed. All statistical analysis was performed using Prism 6 (GraphPad Software). Figures display means ± s.e.m. No statistical methods were used to predetermine sample size.
Extended Data
Extended Data Figure 1. Flare25 mouse and Vil1-cre-mediated Il25 deletion.
a, Gene-targeting strategy for the flox and reporter of Il25 (Flare25) mouse. b, PCR of genomic DNA isolated from the tail (lane 1, 2) or cells sorted from the small intestine (lane 3, 4) of indicated mice. c, Quantitative RT–PCR for Il25 on cDNA from EPCAM+ cells sorted from the small intestine of indicated mice. b, c, Data are representative of two experiments (n = 2). Frt, target site for FLIPASE recombinase; IRES, internal ribosomal entry site; loxP, target site for Cre recombinase; pA, bovine growth hormone poly(A) tail; tdRFP,3tandem-dimer red fluorescent protein; UTR, untranslated region. For gel source data (b) see Supplementary Fig. 1.
Extended Data Figure 2. Il25 expression in epithelial surfaces.
a, b, Indicated tissues of Il25F25/F25 (a) and wild-type control (b) mice stained by immunohistochemistry for RFP (red), EPCAM (green), and DAPI (blue). Some data from Fig. 1a are repeated here to allow complete comparison. Scale bars, 50 μm. Images are representative of at least three independent experiments. n =3.
Extended Data Figure 3. Flow cytometry gating strategies and organoid culture.
a, Flow cytometric analysis of indicated tissues in Il25F25/F25 and wild-type mice. b, Flow cytometric analysis of small intestine epithelial cells of Il25F25/F25 mice before and after fluorescence-activated cell sorting (FACS) into RFP+EPCAM+ and RFP−EPCAM+ pools for analysis by quantitative RT–PCR. c–e, Representative flow cytometric analysis of small-intestine-derived organoids from Il25F25/F25 (c–e) and wild-type (c) mice cultured with or without recombinant protein (20 ng ml−1), as indicated (c–e) or Notch signalling inhibitor DAPT (25 μM) (e). Single-cell suspensions of the organoids were stained for EPCAM (c–e) and DCLK1 (d), and gated to quantify tuft cell (RFP+EPCAM+ or DCLK1+EPCAM+) frequency. f, Quantification of two technical replicates from experiment shown in e. d.p.i., days post-N. brasiliensis infection. Data in f are technical replicates. Data are representative of three (a, b, d) or two (c, e, f) independent experiments. In a–d, n =3; in e, f, n =2. Error bars represent mean ±s.e.m.
Extended Data Figure 4. Il25 is expressed constitutively in tuft cells.
a–c, Jejunum (a, b) or trachea (c) of Il25F25/F25 (a, c) and wild-type control (b) mice stained by immunohistochemistry for RFP (red), indicated lineage markers (green), and DAPI (blue). Scale bars, 50 μm. Images are representative of one (c) or two (a, b) independent experiments. n =2.
Extended Data Figure 5. Tuft cells are not a major source of intestinal TSLP or IL-33.
a, Jejunum of Il25F25/F25 mice stained for RFP (red), IL-33 (green), and DAPI (blue). b–d, Quantitative RT–PCR on indicated (b, c) or RFP+EPCAM+ (d) cells sorted from untreated (b, c) mice or mice treated as indicated (d). RNA isolated from whole lung 8 days post-N. brasiliensis infection is used as a positive control for Tslp expression in c. Expression of Tslp in sorted Tslp-expressing cells of the lung would probably be higher. Scale bars, 50 μm. Data are representative of two independent experiments. In a, n =3; in b–d, n =2.
Extended Data Figure 6. N. brasiliensis induces tuft cell hyperplasia throughout the small intestine but not in stomach and colon.
a, b, Indicated tissues of Il25F25/F25 (a) and wild-type control (b) mice treated as indicated and stained by immunohistochemistry for RFP (a) or DCLK1 (b) (red), EPCAM (green), and DAPI (blue). d.p.i., days post-N. brasiliensis infection. Scale bars, 50 μm. Data are representative of two (stomach and colon) or at least three (all others) independent experiments. In a, stomach and colon: n = 2; all others: n >5.
Extended Data Figure 7. Il25 is expressed only in tuft cells during worm infection and H. polygyrus infection also induces tuft cell hyperplasia.
a, b, Jejunum of Il25F25/F25 (a) and wild-type control (b) mice infected for 7 days with N. brasiliensis stained by immunohistochemistry for RFP (red), indicated lineage markers (green), and DAPI (blue). c, Jejunum of indicated mice left untreated or infected 14 days with H. polygyrus and stained by immunohistochemistry for DAPI (blue), EPCAM (green) and DCLK1 (red). Scale bars, 50 μm. d.p.i., days post-H. polygyrus infection. Images are representative of one (c) or two (a, b) independent experiments. In a, b, n =2; in c, n = 1 (uninfected) or n =2 (infected).
Extended Data Figure 8. Absence of Paneth and CHGA+ cell hyperplasia after N. brasiliensis infection and model of ILC2–epithelial signalling circuit.
a, b, Jejunum of indicated mice stained for DAPI (blue) and LYZ1/2 (a) or CHGA (b) (green). c, Quantification of CHGA+ cells from imaging in (b). d, During homeostasis, rare epithelial tuft cells of the small intestine constitutively express Il25, which maintains low levels of IL-13 production in lamina propria ILC2s. IL-13 in turn signals uncommitted epithelial progenitors to promote emergence of tuft and goblet cells. In the absence of infection, this feed-forward ILC2–epithelial circuit is restrained by as yet unknown mechanisms. After N. brasiliensis (N.b.) infection, a helminth-derived signal or a change in host physiology activates the ILC2–epithelial circuit leading to tuft and goblet cell hyperplasia and enhanced IL-13 production by ILC2s. Adaptive TH2 cells probably also provide IL-13 and/or support ILC2 activation, especially when infection or inflammation lasts more than a week. Recombinant proteins are sufficient to induce tuft cell hyperplasia, either by inducing IL-13 production in lymphoid cells (IL-25 or IL-33) or by directly binding epithelial progenitors (IL-4). Scale bars, 50 μ m. d.p.i., days post-N. brasiliensis infection. Data in c are biological replicates. Data are representative of two (a) or three (b) independent experiments or pooled from multiple experiments (c). In a, n =2; in b, c, n is as shown in c. Error bars represent mean ±s.e.m.
Extended Data Figure 9. IL-13 production by lamina propria ILC2 and CD4+ cells.
a, b, Lamina propria cells from Il25−/−;Il13Smart/+, Il13Smart/+, and wild-type control mice analysed by flow cytometry and gated on ILC2 (a, Lin−CD45+GATA3+) or CD45+CD4+ (b) cells. IL-13 secretion was quantified by measuring surface expression of human CD4, which is expressed from the Il13 locus in Il13Smart reporter mice. c, Frequency of lamina propria CD4+ cells as a percentage of total CD45+ cells as assessed by flow cytometry. d.p.i., days post-N. brasiliensis infection. Data in b, c are biological replicates. Data are representative of at least three (a) independent experiments, or pooled from multiple experiments (b, c). In a, n =5; in b, c, n is as shown. Error bars represent mean ±s.e.m.
Extended Data Table 1.
Antibodies and quantitative RT–PCR primers used in this study
| a | ||||
|---|---|---|---|---|
| Immunohistochemistry Antibodies
| ||||
| Target | Conjugation | Host | Source | Dilution |
| dsRED | none | rabbit | Clontech (632496) | 1:500 |
| RFP | biotin | rabbit | Abcam (ab34771) | 1:500 |
| MUC2 | none | rabbit | Santa Cruz (sc-15334) | 1:100 |
| LYS | none | rabbit | Dako (2017-06) | 1:1000 |
| CHGA | none | rabbit | Immunostar (20085) | 1:250 |
| DCLK1 | none | rabbit | Abcam (ab31704) | 1:1000 |
| PTGS1 | none | goat | Santa Cruz (sc-1754) | 1:100 |
| GFI1B | none | goat | Santa Cruz (sc-8559) | 1:100 |
| EPCAM | AF488 | rat | Biolegend (G8.8) | 1:250 |
| KI67 | AF488 | rat | Biolegend (16A8) | 1:100 |
| rabbit IgG | AF488 | goat | Life Technologies F(ab′)2 | 1:1000 |
| rabbit IgG | AF555 | goat | Life Technologies F(ab′)2 | 1:1000 |
| rabbit IgG | AF488 | chicken | Life Technologies F(ab′)2 | 1:1000 |
| goat IgG | AF555 | donkey | Life Technologies F(ab′)2 | 1:1000 |
| b | ||||
|---|---|---|---|---|
| Flow Cytometry Antibodies
| ||||
| Target | Conjugation | Source | Clone | Dilution |
| CD3 | PerCP/Cy5.5 | Biolegend | 17A2 | 1:100 |
| CD19 | PerCP/Cy5.5 | BD Biosciences | 1D3 | 1:100 |
| CD11B | PerCP/Cy5.5 | Biolegend | M1/70 | 1:300 |
| CD5 | PerCP/Cy5.5 | eBiosciences | 53-7.3 | 1:1000 |
| NK1.1 | PerCP/Cy5.5 | eBiosciences | PK136 | 1:100 |
| EPCAM | PerCP/Cy5.5 | Biolegend | G8.8 | 1:300 |
| EPCAM | AF488 | Biolegend | G8.8 | 1:300 |
| GATA3 | AF488 | eBiosciences | TWAJ | 2.5 μl/test |
| EPCAM | APC | Biolegend | G8.8 | 1:300 |
| CD4 | APC | BD Biosciences | RM4–5 | 1:100 |
| CD45 | BV605 | Biolegend | 30-F11 | 1:100 |
| human CD4 | PE | eBiosciences | RPA-T4 | 5 μl/test |
| DCLK1 | none | Abcam | 1:1000 | |
| rabbit IgG | AF488 | Life Technologies | 1:2000 | |
| c | ||
|---|---|---|
| qRT-PCR Primers
| ||
| Target | Forward Primer (5′ -> 3′) | Reverse Primer (5′ -> 3′) |
| Dclk1 | CAAGCCAGCCATGTCGTTC | TTCCTTTGAAGTAGCGGTCAC |
| Chga | ATCCTCTCTATCCTGCGACAC | GGGCTCTGGTTCTCAAACACT |
| Chat | GGCCATTGTGAAGCGGTTTG | GCCAGGCGGTTGTTTAGATACA |
| Trpm5 | TATGGCTTGTGGCCTATGGT | ACCAGCAGGAGAATGACCAG |
| Muc2 | ATGCCCACCTCCTCAAAGAC | GTAGTTTCCGTTGGAACAGTGAA |
| Gnat3 | TAGGAGCCGAGAGGACCAAG | GCTGGTATTCAGATGCCCTTTC |
| Lyz1 | GAGACCGAAGCACCGACTATG | CGGTTTTGACATTGTGTTCGC |
| Lyz2 | ATGGAATGGCTGGCTACTATGG | ACCAGTATCGGCTATTGATCTGA |
| Ptgs1 | ATGAGTCGAAGGAGTCTCTCG | GCACGGATAGTAACAACAGGGA |
| Gfi1b | ATGCCACGGTCCTTTCTAGTG | GGAAGGCTCTGGTTCAGCAA |
| Il25 | ACAGGGACTTGAATCGGGTC | TGGTAAAGTGGGACGGAGTTG |
| Tslp | ACGGATGGGGCTAACTTACAA | AGTCCTCGATTTGCTCGAACT |
| Il33 | GCTGCGTCTGTTGACACATTGAG | GGTCTTGCTCTTGGTCTTTTCCAG |
| Rps17 | CGCCATTATCCCCAGCAAG | TGTCGGGATCCACCTCAATG |
Acknowledgments
We thank M. Consengco, R. Noyes, and Z. Wang for technical expertise, Y. Nusse for mice, members of the Locksley laboratory for helpful discussions, and R. Vance, M. Fontana, M. Anderson, and O. Klein for comments on the manuscript. This work was supported by the National Institutes of Health (AI026918, AI030663, HL107202), a Diabetes Endocrinology Research Center grant (DK063720), the Howard Hughes Medical Institute (HHMI), and the Sandler Asthma Basic Research Center at the University of California, San Francisco. J.v.M. is an HHMI Fellow of the Damon Runyon Cancer Research Foundation (DRG-2162-13).
Footnotes
Online Content Methods, along with any additional Extended Data display items and Source Data, are available in the online version of the paper; references unique to these sections appear only in the online paper.
Supplementary Information is available in the online version of the paper.
Author Contributions J.v.M. conceived the study, designed and performed experiments, analysed data, and wrote the paper with R.M.L. M.J. performed experiments. H.-E.L. cloned the Flare25 reporter cassette, performed the Flare25 embryonic stem cell work, and assisted with additional experiments. R.M.L. directed the study and wrote the paper with J.v.M.
The authors declare no competing financial interests.
Readers are welcome to comment on the online version of the paper.
References
- 1.Miller HR, Nawa Y. Immune regulation of intestinal goblet cell differentiation. Specific induction of nonspecific protection against helminths? Nouv Rev Fr Hematol. 1979;21:31–45. [PubMed] [Google Scholar]
- 2.Castro GA, Badial-Aceves F, Smith JW, Dudrick SJ, Weisbrodt NW. Altered small bowel propulsion associated with parasitism. Gastroenterology. 1976;71:620–625. [PubMed] [Google Scholar]
- 3.Grencis RK. Immunity to helminths: resistance, regulation, and susceptibility to gastrointestinal nematodes. Annu Rev Immunol. 2015;33:201–225. doi: 10.1146/annurev-immunol-032713-120218. [DOI] [PubMed] [Google Scholar]
- 4.Price AE, et al. Systemically dispersed innate IL-13-expressing cells in type 2 immunity. Proc Natl Acad Sci USA. 2010;107:11489–11494. doi: 10.1073/pnas.1003988107. [DOI] [PMC free article] [PubMed] [Google Scholar]
- 5.Neill DR, et al. Nuocytes represent a new innate effector leukocyte that mediates type-2 immunity. Nature. 2010;464:1367–1370. doi: 10.1038/nature08900. [DOI] [PMC free article] [PubMed] [Google Scholar]
- 6.Fallon PG, et al. Identification of an interleukin (IL)-25-dependent cell population that provides IL-4, IL-5, and IL-13 at the onset of helminth expulsion. J Exp Med. 2006;203:1105–1116. doi: 10.1084/jem.20051615. [DOI] [PMC free article] [PubMed] [Google Scholar]
- 7.Kang Z, et al. Epithelial cell-specific Act1 adaptor mediates interleukin-25-dependent helminth expulsion through expansion of Lin−c-Kit+ innate cell population. Immunity. 2012;36:821–833. doi: 10.1016/j.immuni.2012.03.021. [DOI] [PMC free article] [PubMed] [Google Scholar]
- 8.Zhao A, et al. Critical role of IL-25 in nematode infection-induced alterations in intestinal function. J Immunol. 2010;185:6921–6929. doi: 10.4049/jimmunol.1000450. [DOI] [PMC free article] [PubMed] [Google Scholar]
- 9.Van Dyken SJ, et al. Chitin activates parallel immune modules that direct distinct inflammatory responses via innate lymphoid type 2 and γδ T cells. Immunity. 2014;40:414–424. doi: 10.1016/j.immuni.2014.02.003. [DOI] [PMC free article] [PubMed] [Google Scholar]
- 10.Owyang AM, et al. Interleukin 25 regulates type 2 cytokine-dependent immunity and limits chronic inflammation in the gastrointestinal tract. J Exp Med. 2006;203:843–849. doi: 10.1084/jem.20051496. [DOI] [PMC free article] [PubMed] [Google Scholar]
- 11.Angkasekwinai P, et al. Interleukin 25 promotes the initiation of proallergic type 2 responses. J Exp Med. 2007;204:1509–1517. doi: 10.1084/jem.20061675. [DOI] [PMC free article] [PubMed] [Google Scholar]
- 12.Clevers H. The intestinal crypt, a prototype stem cell compartment. Cell. 2013;154:274–284. doi: 10.1016/j.cell.2013.07.004. [DOI] [PubMed] [Google Scholar]
- 13.Bjerknes M, et al. Origin of the brush cell lineage in the mouse intestinal epithelium. Dev Biol. 2012;362:194–218. doi: 10.1016/j.ydbio.2011.12.009. [DOI] [PMC free article] [PubMed] [Google Scholar]
- 14.Gerbe F, Legraverend C, Jay P. The intestinal epithelium tuft cells: specification and function. Cell Mol Life Sci. 2012;69:2907–2917. doi: 10.1007/s00018-012-0984-7. [DOI] [PMC free article] [PubMed] [Google Scholar]
- 15.Bezençon C, et al. Murine intestinal cells expressing Trpm5 are mostly brush cells and express markers of neuronal and inflammatory cells. J Comp Neurol. 2008;509:514–525. doi: 10.1002/cne.21768. [DOI] [PubMed] [Google Scholar]
- 16.McKenzie GJ, Bancroft A, Grencis RK, McKenzie ANJ. A distinct role for interleukin-13 in Th2-cell-mediated immune responses. Curr Biol. 1998;8:339–342. doi: 10.1016/s0960-9822(98)70134-4. [DOI] [PubMed] [Google Scholar]
- 17.Fort MM, et al. IL-25 induces IL-4, IL-5, and IL-13 and Th2-associated pathologies in vivo. Immunity. 2001;15:985–995. doi: 10.1016/s1074-7613(01)00243-6. [DOI] [PubMed] [Google Scholar]
- 18.Hurst SD, et al. New IL-17 family members promote Th1 or Th2 responses in the lung: in vivo function of the novel cytokine IL-25. J Immunol. 2002;169:443–453. doi: 10.4049/jimmunol.169.1.443. [DOI] [PubMed] [Google Scholar]
- 19.Liang HE, et al. Divergent expression patterns of IL-4 and IL-13 define unique functions in allergic immunity. Nature Immunol. 2012;13:58–66. doi: 10.1038/ni.2182. [DOI] [PMC free article] [PubMed] [Google Scholar]
- 20.Voehringer D, Reese TA, Huang X, Shinkai K, Locksley RM. Type 2 immunity is controlled by IL-4/IL-13 expression in hematopoietic non-eosinophil cells of the innate immune system. J Exp Med. 2006;203:1435–1446. doi: 10.1084/jem.20052448. [DOI] [PMC free article] [PubMed] [Google Scholar]
- 21.Oliphant CJ, et al. MHCII-mediated dialog between group 2 innate lymphoid cells and CD4+ T cells potentiates type 2 immunity and promotes parasitic helminth expulsion. Immunity. 2014;41:283–295. doi: 10.1016/j.immuni.2014.06.016. [DOI] [PMC free article] [PubMed] [Google Scholar]
- 22.Muñoz J, et al. The Lgr5 intestinal stem cell signature: robust expression of proposed quiescent ‘+4’ cell markers. EMBO J. 2012;31:3079–3091. doi: 10.1038/emboj.2012.166. [DOI] [PMC free article] [PubMed] [Google Scholar]
- 23.Reinecker HC, Podolsky DK. Human intestinal epithelial cells express functional cytokine receptors sharing the common gamma c chain of the interleukin 2 receptor. Proc Natl Acad Sci USA. 1995;92:8353–8357. doi: 10.1073/pnas.92.18.8353. [DOI] [PMC free article] [PubMed] [Google Scholar]
- 24.Nussbaum JC, et al. Type 2 innate lymphoid cells control eosinophil homeostasis. Nature. 2013;502:245–248. doi: 10.1038/nature12526. [DOI] [PMC free article] [PubMed] [Google Scholar]
- 25.Deckmann K, et al. Bitter triggers acetylcholine release from polymodal urethral chemosensory cells and bladder reflexes. Proc Natl Acad Sci USA. 2014;111:8287–8292. doi: 10.1073/pnas.1402436111. [DOI] [PMC free article] [PubMed] [Google Scholar]
- 26.Krasteva G, et al. Cholinergic chemosensory cells in the trachea regulate breathing. Proc Natl Acad Sci USA. 2011;108:9478–9483. doi: 10.1073/pnas.1019418108. [DOI] [PMC free article] [PubMed] [Google Scholar]
- 27.Saunders CJ, Christensen M, Finger TE, Tizzano M. Cholinergic neurotransmission links solitary chemosensory cells to nasal inflammation. Proc Natl Acad Sci USA. 2014;111:6075–6080. doi: 10.1073/pnas.1402251111. [DOI] [PMC free article] [PubMed] [Google Scholar]
- 28.Lee RJ, et al. Bitter and sweet taste receptors regulate human upper respiratory innate immunity. J Clin Invest. 2014;124:1393–1405. doi: 10.1172/JCI72094. [DOI] [PMC free article] [PubMed] [Google Scholar]
- 29.Ballantyne SJ, et al. Blocking IL-25 prevents airway hyperresponsiveness in allergic asthma. J Allergy Clin Immunol. 2007;120:1324–1331. doi: 10.1016/j.jaci.2007.07.051. [DOI] [PubMed] [Google Scholar]
- 30.Han H, Thelen TD, Comeau MR, Ziegler SF. Thymic stromal lymphopoietin-mediated epicutaneous inflammation promotes acute diarrhea and anaphylaxis. J Clin Invest. 2014;124:5442–5452. doi: 10.1172/JCI77798. [DOI] [PMC free article] [PubMed] [Google Scholar]
- 31.Sato T, Clevers H. Primary mouse small intestinal epithelial cell cultures. Methods Mol Biol. 2013;945:319–328. doi: 10.1007/978-1-62703-125-7_19. [DOI] [PubMed] [Google Scholar]


