

Abstract
Background
Molecular resistance testing fails to explain all fluoroquinolone resistance, with a continued need for a suitable rapid phenotypic drug susceptibility testing method.
Objective
To evaluate the optimal method for phenotypic fluoroquinolone susceptibility testing.
Methods
Using Löwenstein–Jensen medium, Middlebrook 7H11 agar, BACTEC-MGIT 960 and the resazurin microtitre plate assay, we determined susceptibility to fluoroquinolones in Mycobacterium tuberculosis and investigated cross-resistance between ofloxacin, levofloxacin, moxifloxacin and gatifloxacin. We compared MICs of all four fluoroquinolones for 91 strains on Löwenstein–Jensen (as the gold standard) with their MICs in resazurin plates, and with ofloxacin susceptibility at a single concentration in MGIT and on 7H11 agar, in addition to sequencing of the gyrAB genes.
Results and conclusions
Applying a cut-off of 2 mg/L ofloxacin, 1 mg/L levofloxacin and 0.5 mg/L moxifloxacin and gatifloxacin in all methods, some discordance between solid medium and MGIT methods was observed, yet this tended to be explained by MICs around the cut-off. The high discordance between Löwenstein–Jensen (LJ) and resazurin plates suggests that the currently applied cut-offs for all fluoroquinolones in the resazurin method should decrease and minor changes in colour (from blue to purple) be considered as meaningful. High-level resistance in all assays to all drugs correlated well with the presence of gyrA mutations, in support of recent findings that fluoroquinolone resistance should be tested at different concentrations, as patients with lower levels of resistance may continue to benefit from high-dose fluoroquinolone-based therapy.
Introduction
Drug-resistant TB continues to be of great concern to global public health, primarily due to limited treatment options, poor treatment outcomes and increased local epidemics of MDR-TB.1 In 2013, MDR-TB—defined as resistance to isoniazid and rifampicin—was reported in 3.5% of newly diagnosed TB patients and in 20.5% of retreatment patients. Moreover, 9% of MDR-TB patients' isolates showed evidence of additional resistance to one of the fluoroquinolones (FQs) and one of the second-line injectables, classified as XDR-TB.1
FQs are among the key drugs in current MDR-TB treatment regimens and are an important predictor for successful treatment outcome. While high-level resistance increases the risk of unfavourable treatment outcome, low-level resistance can still be overcome by high-dose treatment.2,3 Furthermore, despite cross-resistance between FQs, newer FQs—including levofloxacin (third-generation FQ), moxifloxacin (fourth generation) and gatifloxacin (fourth generation)—may continue to be effective even when ofloxacin resistance has been demonstrated.4–6
Owing to the long incubation time of phenotypic drug susceptibility testing (DST) methods, molecular assays including the GenoType® MTBDRsl Line Probe Assay and targeted Sanger sequencing of the gyrA and gyrB genes are suitable alternatives for the rapid detection of FQ resistance, with highly specific results. However, only ∼50%–90% of clinical isolates showing phenotypic FQ resistance harbour mutations in the quinolone resistance-determining region (QRDR) of gyrA,7–9 while gyrB mutations explain a small additional proportion of FQ resistance.10–12 Consequently, true (phenotypic) FQ resistance in WT isolates remains undetected if only molecular methods are used. Hence, there is a remaining need to complement molecular techniques with rapid and reliable phenotypic DST assays.
Standard recommended phenotypic methods to test FQ susceptibility include the indirect proportion method on solid (LJ and Middlebrook 7H10 or 7H11) and in liquid (BACTEC-MGIT 960)13 medium, but are hampered by a long incubation time (4–6 weeks for solid medium versus up to 14 days for liquid medium, after primary isolation) and consequently a delay in diagnosis. Rapid non-commercial DST methods—including the colorimetric resazurin microtitre plate assay (REMA)—could reduce this delay to 9 days after primary isolation.14 Although REMA is not a widely used DST method, its flexibility, ease of use and speed are great advantages compared with solid media and, for these reasons, REMA lends itself as a rapid DST method for research studies to determine MICs of second-line drugs, including FQs, with reportedly high sensitivity and specificity rates for the detection of ofloxacin resistance.15–17 Nevertheless, this method is only recommended for conditional use in central or reference laboratories18 and critical concentrations are currently lacking for the different FQs.
Given the remaining need for a suitable rapid phenotypic DST method, a more extensive evaluation of the optimal methods for FQ susceptibility testing is needed. To this end, we compared ofloxacin susceptibility testing in MGIT and on 7H11 agar, with susceptibility to all FQs in REMA, and on LJ medium (as the gold standard) in addition to Sanger sequencing of the gyrA and gyrB genes.
Materials and methods
Strains
In this study, only pre-XDR Mycobacterium tuberculosis strains were included. Based on previous identification as ofloxacin resistant at 2 mg/L, and susceptible to kanamycin (10 mg/L) and capreomycin (6 mg/L) as determined per routine on Middlebrook 7H11 agar, the first consecutive 77 M. tuberculosis isolates available from the collection of stored clinical isolates at the Institute for Tropical Medicine (ITM; Antwerp, Belgium) were tested (Figure 1). The isolates originated from Georgia, Bangladesh, Rwanda, Democratic Republic of Congo, Central African Republic, Nigeria, Niger, Myanmar, Peru, Cameroon and the USA. As a control group, 21 ofloxacin-susceptible M. tuberculosis strains were selected by taking the first available ofloxacin-susceptible M. tuberculosis strain after every third ofloxacin-resistant strain of the selected group. Control strains had a similar geographical distribution and resistance profile to first-line drugs, relative to the tested strains.
Figure 1.

Overview of the M. tuberculosis strains included in the study. OFX, ofloxacin; KAN, kanamycin; CAP, capreomycin; LVX, levofloxacin; MXF, moxifloxacin; GAT, gatifloxacin; S, susceptible; R, resistant; PM, proportion method; REMA, resazurin microtitre assay; LJ, Löwenstein–Jensen.
All strains were subcultured on LJ medium 3–4 weeks before the experiments.
Antibiotics and media
Stock solutions were prepared for ofloxacin (Sigma–Aldrich), levofloxacin (Sigma–Aldrich), moxifloxacin (Bayer or Molekula) and gatifloxacin (Lupin, India or Sigma–Aldrich) at 10 000 mg/L in 0.1 N sterile NaOH and stored in aliquots at below −18°C for 1 year maximum. Leftover thawed aliquots were not refrozen.
Middlebrook 7H9 broth medium was prepared by adding distilled water, 10% Middlebrook OADC [Becton Dickinson (BD)], 0.5% glycerol (Sigma–Aldrich) and 0.1% casitone (BD) to Middlebrook 7H9 powder (BD) and stored at 2–8°C for 3 months maximum.
Quality control
The pan-susceptible M. tuberculosis strain H37Rv (ATCC 27294, BCCM/ITM 083715) was included as quality control strain (per testing day for REMA and with each new batch of drug powder, stock solutions and homemade medium as well as MGIT tubes).
DST
MICs of ofloxacin, levofloxacin, moxifloxacin and gatifloxacin were determined in liquid (REMA) and on solid medium (LJ) (Table 1). For REMA, all standard procedures (preparation of the plate, stock and working solutions of all FQs and of the bacterial suspension) were performed according to the previously described protocol.14 After incubation for 7 days at 37°C, 0.01% resazurin (Sigma–Aldrich) was added to each well. Interpretation by visual inspection was done after 48 h. The MIC was determined as the lowest concentration of the drug that prevented a colour change of resazurin from blue to purple or pink.14 Results were only considered valid if the positive control turned pink (and not blue or purple) combined with a true negative control (blue). Applying this strict rule for acceptance of results, purple results for drug-containing wells—indicative of some growth—were considered as pink, approaching as much as possible an MIC100.
Table 1.
Drug concentrations tested in REMA, in MGIT 960, on Löwenstein–Jensen and on Middlebrook 7H11 agar
| Drug concentrations (mg/L) |
||||
|---|---|---|---|---|
| OFX | LVX | MXF | GAT | |
| REMA | 0.25–0.5–1a–2b–4–8 | 0.125–0.25–0.5c–1–2–4 | ||
| Löwenstein–Jensen | 0.5–1a–2b–4–8 | 0.25–0.5c–1–2–4 | ||
| MGIT 960 | 2 | ND | ND | ND |
| Middlebrook 7H11 agar | 2 | ND | ND | ND |
OFX, ofloxacin; LVX, levofloxacin; MXF, moxifloxacin; GAT, gatifloxacin; ND, not done.
aApplied cut-off for LVX.
bApplied cut-off for OFX.
cApplied cut-off for MXF and GAT.
For MIC testing on LJ medium, a 1 mg/mL bacterial suspension and serial dilutions were prepared as follows: a 10−1 dilution was inoculated into the drug-containing tubes and one control tube, while a 10−3 dilution was inoculated into a second control tube. Reading was done after 4 weeks of incubation at 34–38°C. The MIC was determined as the lowest drug concentration that inhibited 99% of visible growth, compared with the 10−3 control tube.19
For the proportion method on 7H11, ofloxacin susceptibility testing was done on Middlebrook 7H11 agar with 2 mg/L critical concentration, as per routine testing (Table 1). Strains were considered resistant if >1% of bacilli grew at the critical concentration.19 In MGIT, resistance to 2 mg/L ofloxacin was determined based on previously described protocols.20,21
To declare strains resistant, cut-offs of 2 mg/L for ofloxacin, 1 mg/L for levofloxacin and 0.5 mg/L for moxifloxacin and gatifloxacin were used for all media.13,22–24 Strains with an MIC greater than cut-off were considered as resistant to that particular FQ.
Sensitivity and specificity—including their 95% CIs—were calculated based on the phenotypic drug susceptibility results as LJRREMAR/(LJRREMAR + LJRREMAS) and LJSREMAS/(LJSREMAS + LJSREMAR), respectively. The same calculations were used for MGIT and 7H11 agar.
Sanger sequencing
DNA extracts from all strains were prepared by adding a loopful of colonies to 200 μL of Tris-EDTA buffer (10 mM Tris-HCl, 1 mM EDTA, pH 8.0) followed by heat inactivation at 100°C for 5 min. Sequencing of the gyrA and gyrB genes was performed as previously described.11
CLC Sequence Viewer (version 6.0) was used for analysis by identifying mutations in the gyrA and gyrB genes compared with the M. tuberculosis H37Rv sequence (NCBI NC_000962).
Variants outside the QRDR and those within the QRDR that are known not to confer ofloxacin resistance (95Thr)11 or that are found to confer hypersusceptibility towards ofloxacin rather than resistance (80Ala and the double mutation 80Ala + 90Gly)10,11,25,26 were considered as WT. Strains with sequence showing double peaks indicating a WT plus gyrA or gyrB mutant were considered to be heteroresistant.
Ethics
Ethics approval for the use of M. tuberculosis isolates was obtained from the ITM Institutional Review Board (reference 833/12) and the CPP Ile de France XI (Paris, France).
Results
Our dataset comprised a total of 91 strains for final analysis (Figure 1). For two of the 98 tested strains, the positive growth control repeatedly failed to grow: one strain in MGIT and one strain in REMA; the latter one also failing by repeated sequencing. Five heteroresistant isolates showing a mixture of mutant and WT alleles in gyrA were considered separately in the analysis.
Ofloxacin
Based on their ofloxacin susceptibility on LJ medium (as gold standard), 53 of the 91 strains (58%) were considered to be ofloxacin resistant whereas 38 (42%) were ofloxacin susceptible. All 53 strains were previously found to be ofloxacin resistant on 7H11 as per routine testing, of which 35 (66%) harboured mutations in the QRDR whereas 18 (34%) were WT (including one strain with a gyrB 551Arg mutation) despite an ofloxacin MIC of ≥4 mg/L on LJ (Figure 2). Among the 38 ofloxacin-susceptible strains on LJ, 21 were previously found to be susceptible on 7H11 (control group) while 17 were ofloxacin resistant on 7H11. All strains of the control group were WT (including one strain with a gyrB 551Arg mutation and one strain with a gyrA 80Ala mutation) and had an ofloxacin MIC ranging from 0.5 to 2 mg/L on LJ. All LJ–7H11 discordant strains had WT QRDR and an ofloxacin MIC on LJ ranging from 1 to 2 mg/L. 7H11 agar testing thus achieved a sensitivity of 100% (95% CI 92%–100%) with a specificity of 55% (95% CI 39%–71%) compared with LJ as the reference method, with the low specificity entirely explained by LJ MICs of one or two dilutions below the cut-off.
Figure 2.
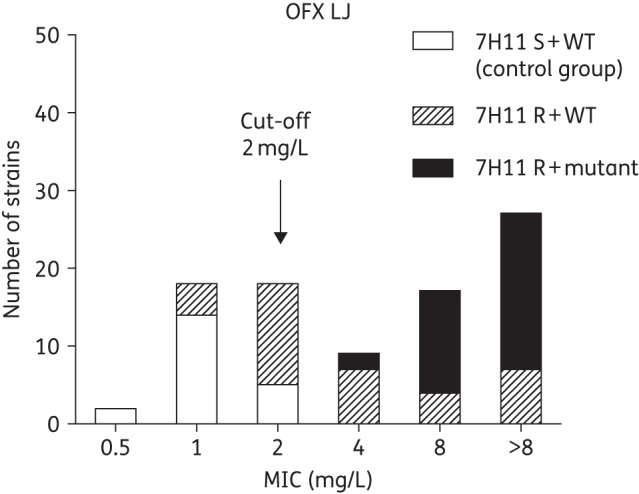
MIC distribution of ofloxacin on Löwenstein–Jensen medium stratified to the historical resistance profile on Middlebrook 7H11 agar as well as gyrAB mutations. OFX, ofloxacin; S, susceptible; R, resistant; LJ, Löwenstein–Jensen.
When comparing ofloxacin susceptibility in REMA with the LJ reference, REMA achieved a sensitivity of 66% (95% CI 52%–78%)—which increased to 80% (95% CI 62%–91%) when including only QRDR mutants—and a specificity of 100% in both scenarios (95% CI 89%–100%). Seventy-three out of 91 strains tested (80%) had concordant results—including 35 ofloxacin-resistant strains and 38 ofloxacin-susceptible strains—of which 20 were susceptible by all methods (Figure 3a). All 18 LJ–REMA discordant strains were susceptible in REMA and resistant on LJ. Seven (39%) were QRDR mutants (including 90Val, 90Val + 683Asp, 94Ala, Ala94 + Ala80 and 89Asn) and 11 (61%) WT. All 18 strains showed a 2- to 5-fold difference in MIC between both methods.
Figure 3.
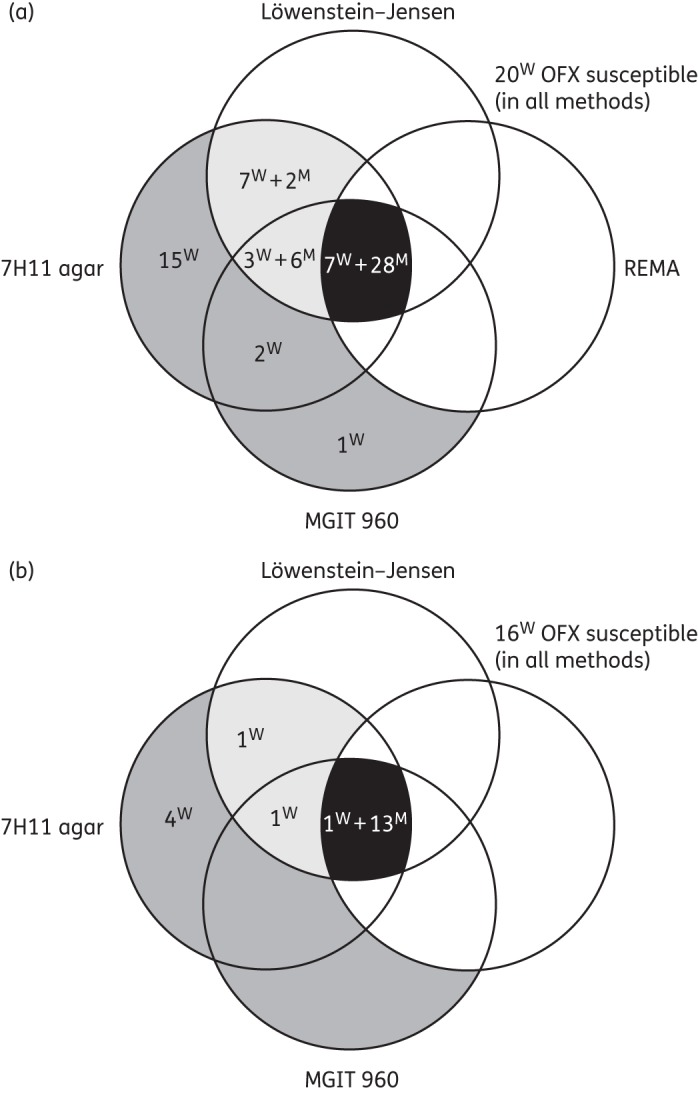
(Dis)agreement between Löwenstein–Jensen medium, Middlebrook 7H11 agar, REMA and MGIT 960 regarding ofloxacin susceptibility (cut-off 2 mg/L) considering Löwenstein–Jensen as gold standard: (a) all 91 M. tuberculosis strains and (b) excluding strains with an MIC around the cut-off (2 or 4 mg/L). Numbers inside the Venn diagram indicate ofloxacin-resistant strains in one or more methods. Black, concordantly resistant in all methods; light grey, ofloxacin resistant on Löwenstein–Jensen and resistant by one or more other methods; and dark grey, ofloxacin resistant by one or more methods, yet susceptible on Löwenstein–Jensen. W, gyrAB WT; M, gyrAB mutant; OFX, ofloxacin.
When comparing ofloxacin susceptibility testing in MGIT with the LJ reference, MGIT achieved a sensitivity of 83% (95% CI 70%–92%)—increasing to 94% (95% CI 80%–99%) when including only QRDR mutants—and a specificity of 92% (95% CI 78%–98%). Seventy-nine out of 91 strains (87%) had concordant results, including 35 ofloxacin-susceptible strains and 44 ofloxacin-resistant strains (Figure 3a). Of the concordantly resistant strains, 33 (75%) harboured a mutation in QRDR while 11 (25%) were WT (including one strain with a gyrB 551Arg mutation). Of the 12 discordant strains, 9 were susceptible in MGIT and resistant on LJ (7 WT strains and 2 gyrA mutants) while the remaining 3 strains (all WT) were resistant in MGIT and susceptible on LJ.
As to the overall agreement between LJ, 7H11, REMA and MGIT, 60% of the strains were concordant (35 ofloxacin-resistant and 20 ofloxacin-susceptible strains) while 40% were discordant in at least one method (Figure 3a). However, it must be noted that 36 of the 91 strains had an MIC on LJ and/or REMA around the cut-off. For high-level resistant strains only, the overall agreement was 83%, with none of the QRDR mutants classified as ofloxacin susceptible by any of the methods: one WT strain classified as ofloxacin susceptible in REMA only, one WT strain classified as ofloxacin resistant on LJ and 7H11 and four WT strains classified as ofloxacin resistant on 7H11 only (Figure 3b).
Levofloxacin, moxifloxacin and gatifloxacin
Although cross-resistance between the various FQs was noticed, MICs of the fourth-generation FQs were systematically lower compared with ofloxacin and levofloxacin, with gatifloxacin showing the lowest MICs. MICs of levofloxacin were comparable to those of ofloxacin with a ≤1-fold difference in the MIC on LJ and in REMA for 93% and 91% of the strains, respectively. Similarly, 91% and 97% of the strains showed a ≤1-fold difference in MIC between moxifloxacin and gatifloxacin on LJ and in REMA, respectively.
On LJ medium, 52 (98%), 50 (94%) and 46 (87%) of the 53 ofloxacin-resistant strains were found to be cross-resistant to levofloxacin, moxifloxacin and gatifloxacin, respectively, applying a cut-off of 1 mg/L for levofloxacin and 0.5 mg/L for moxifloxacin and gatifloxacin. All QRDR mutants were resistant to ofloxacin, levofloxacin and moxifloxacin and 97% were gatifloxacin resistant. Their MICs ranged from 4 to >8 mg/L with a mode of >8 mg/L for ofloxacin, from 2 to >8 mg/L with a mode of 8 mg/L for levofloxacin [Figure 4 and Table S1 (available as Supplementary data at JAC Online)], whereas those of moxifloxacin ranged from 1 to >4 mg/L with a mode of 2 mg/L and of gatifloxacin from 0.5 to >4 mg/L with a mode of 2 mg/L (Figure 4 and Table S2). The cumulative percentage of difference between WT and QRDR mutant strains was the greatest at 4 mg/L ofloxacin, 2 mg/L levofloxacin, 1 mg/L moxifloxacin and 0.5 mg/L gatifloxacin (Figure 4).
Figure 4.

Cumulative percentage of WT and QRDR mutant strains against respective MICs of ofloxacin, levofloxacin, moxifloxacin and gatifloxacin in REMA and on Löwenstein–Jensen medium. LJ, Löwenstein–Jensen; OFX, ofloxacin; LVX, levofloxacin; MXF, moxifloxacin; GAT, gatifloxacin. Dark/light curves represent strains without/with QRDR mutation detected and the vertical line indicates maximum discrimination between WT and QRDR mutant strains.
In REMA, 35 (66%), 33 (62%), 24 (45%) and 9 (17%) of the 53 ofloxacin-resistant strains on LJ showed ofloxacin, levofloxacin, moxifloxacin and gatifloxacin resistance, respectively. Among QRDR mutants only, 80%, 77%, 54% and 23% were ofloxacin, levofloxacin, moxifloxacin and gatifloxacin resistant, respectively. MICs for these strains were widely dispersed, ranging from 0.5 to >8 mg/L for ofloxacin and from ≤0.25 to 8 mg/L for levofloxacin (Figure 4 and Table S3). For moxifloxacin, MICs ranged from ≤0.125 to 4 mg/L and for gatifloxacin MICs from ≤0.125 to 2 mg/L (Figure 4 and Table S4). As seen for ofloxacin, the sensitivity of REMA was only 62% (95% CI 64%–87%) for levofloxacin, 47% (95% CI 33%–61%) for moxifloxacin and 20% (95% CI 10%–34%) for gatifloxacin, while the specificity was 100% (95% CI 89%–100%) in all cases.
Comparing the maximum difference in cumulative percentage between WT and QRDR mutant strains between LJ and REMA for each of the drugs revealed a systematic shift towards a 4-fold lower concentration for REMA (Figure 4), suggesting the following critical concentrations for REMA: 1 mg/L for ofloxacin, 0.5 mg/L for levofloxacin, 0.25 mg/L for moxifloxacin and ≤0.125 mg/L for gatifloxacin.
The five isolates showing heterogeneity at codon 94 (Gly mutation, n = 4) or 90 (Val mutation, n = 1) were all found to be resistant to ofloxacin in MGIT and on LJ medium with an MIC ≥8 mg/L. Their MICs in REMA ranged from 0.5 to 4 mg/L.
Discussion
In this study, we evaluated the use of LJ, 7H11, MGIT and REMA to determine FQ susceptibility in M. tuberculosis and investigated cross-resistance between ofloxacin, levofloxacin, moxifloxacin and gatifloxacin.
Considering LJ as the gold standard, our data demonstrated a relatively high discordance between the different methods for determining ofloxacin resistance, yet this tended to be explained by MICs around the cut-off.
Applying 2 mg/L as the cut-off, sensitivity for ofloxacin resistance was 100% on 7H11 agar while the specificity was only 55%. This low specificity can be attributed to 17 strains previously identified as ofloxacin resistant on 7H11 as per routine testing yet susceptible on LJ in the current study. All of them were gyrAB WT and had an LJ MIC of 1 or 2 mg/L, i.e. close to the cut-off, explaining their misclassification in routine diagnostic testing. Some qualifying remarks need to be made, however. Minor differences in MIC between LJ and 7H11 have been reported previously.27 At our unit, the quality of DST is assured by internal quality control of each batch of homemade medium and participation in external quality assessment panel testing provided by the WHO and local providers (Belgian Public Health Institute; INSTAND), showing excellent accuracy over the last decade.
REMA achieved only 66% sensitivity for any ofloxacin resistance on LJ—or 80% when limited to gyrAB mutants—whereas previous studies described sensitivity between 97% and 100% using the same methodology,15–17 albeit with a possible different interpretation of the colour change, explained below. The low sensitivity might be explained by the high proportion of strains having an MIC around the cut-off. Exclusion of strains with an MIC of 2 and 4 mg/L resulted in a sensitivity of 88%. Besides, the maximum distance in cumulative percentage between WT and QRDR mutant strains at 1 mg/L ofloxacin in REMA, suggests a reduction of the currently applied cut-offs in REMA from 2 mg/L to 1 mg/L may enhance the sensitivity of REMA to detect ofloxacin resistance. A similar observation was made for levofloxacin, moxifloxacin and gatifloxacin, contrary to previous studies that showed reliable results for the detection of resistance against these newer FQs. Revising the obtained MIC values against these proposed cut-offs was not possible within this study, given the concentration range as previously published. A more extended validation including lower test concentrations and a larger set of susceptible control strains is needed to decide whether REMA can reliably serve as a diagnostic test for FQ resistance.
It should be noted that in this study, REMA plates, based on visual inspection in accordance with the REMA manual instructions, had the MIC interpreted as ‘the lowest concentration of drug that prevented any colour change from blue to purple or pink (MIC100)’. The REMA manual cites: ‘A change in colour from blue to pink means a growth of the isolate at that concentration of the drug. For better interpretation of the results, the colour must be compared to the colour present in the growth control well.’ The presence of ‘purple’ results is not mentioned in the REMA manual, leaving room for interpretation. In our study, considering only pink wells as being resistant would dramatically decrease the sensitivity: from 66% to 47% for ofloxacin, from 62% to 49% for levofloxacin, from 47% to 33% for moxifloxacin and from 20% to 11% for gatifloxacin. Hence, we suggest applying the strict ‘MIC100’ interpretation for FQ resistance testing in REMA, in which both purple and pink wells are interpreted as indicative of growth.
MGIT tends to give more reliable results compared with REMA with a sensitivity of 83% (including all strains) or 94% (including only strains with resistance-conferring mutations), while the specificity was 92% (95% CI 78%–98%). This rate is within the previously reported ranges.28–30
Although it is most likely that the high proportion of discordant strains in REMA and LJ can be resolved by decreasing currently applied cut-offs, REMA still fails to detect all FQ resistance. Considering that both REMA and MGIT are liquid medium-based DST methods, this inability to detect FQ resistance in REMA could be explained by bacterial fitness loss, as previously seen for rifampicin susceptibility testing.31–35 In the study by Rigouts et al.,32 discordance between LJ and MGIT susceptibility to rifampicin was attributed to specific rpoB mutations. Considering that all ofloxacin-resistant strains included in our study are MDR-TB, we checked whether missed ofloxacin resistance could be explained by specific rpoB mutations in our samples, yet no such association could be identified (data not shown). Moreover, missed resistance in REMA could not be linked to specific QRDR mutations.
Our data corroborate findings of cross-resistance between the four FQs10,11,36–38 with greater bacterial activity of the third- and fourth-generation FQs compared with ofloxacin and with gatifloxacin as the most potent drug (ofloxacin < levofloxacin < moxifloxacin < gatifloxacin). Resistance to levofloxacin—which is widely used in MDR-TB treatment regimens—was comparable to the level of ofloxacin resistance, which is not surprising as levofloxacin constitutes one of the two optically active isomers comprised in ofloxacin. Already in the early days of its introduction, similar MIC90 values between ofloxacin and levofloxacin were found.39 On the other hand, 11% of the strains showed susceptibility to gatifloxacin despite ofloxacin and levofloxacin resistance. Despite earlier concerns about the risk of dysglycaemia and prolonged QT interval upon gatifloxacin treatment,40 recent studies in TB have not identified any such association,3,41 suggesting that gatifloxacin can remain a preferred FQ choice in MDR-TB combination therapies.
Data on the clinical relevance of this observation are still scarce.3,41,42 However, in a recent study, we identified specific QRDR mutations predictive of worse FQ resistance and poor clinical outcome with standardized FQ-based MDR treatment regimens.43
Finally, one-third of the FQ-resistant strains on LJ harboured WT gyrA and gyrB genes, supporting the assumptions of alternative mechanisms of FQ resistance12,44–46 or potentially undetected heteroresistance, requiring more in-depth research. Heteroresistance is common in clinical M. tuberculosis isolates and has been reported for several antibiotics. Although most studies describing resistance to FQs among clinical isolates do not provide specific data on heteroresistance, the few published studies show frequencies ranging from 16.7% to 38% in some high-burden countries.47–50 The capacity to detect heteroresistance largely depends on the technique applied, with an overall higher sensitivity for phenotypic assays: the original Canetti proportion method is based on detection of >99% inhibition, i.e. a limit of detection of 1% for the presence of resistant subpopulations.19 Sanger sequencing typically requires the mutant to form ≥10% of the population to be detectable.51,52 The use of increasingly deep sequencing may ultimately overcome the lower sensitivity for genotypic detection of heteroresistance. In our study, heteroresistance was detected through Sanger sequencing, indicating the presence of a significant proportion of mutants, which resulted in phenotypic resistance by all three methods, considering the lower breakpoints for REMA.
Alternative mechanisms of FQ resistance could comprise increased efflux pump activity, pentapeptide proteins or enzymes that inactivate the FQs—as demonstrated in non-mycobacteria—although these have not yet been described in FQ-resistant M. tuberculosis.53
In conclusion, the high level of phenotypic FQ resistance unexplained by gyrAB mutations supports the need for a reliable rapid phenotypic DST method. While discordance was relatively high between the different methods, this tended to be explained by MICs around the cut-off for all methods and low-level resistance may not preclude the clinical utility of high-dose FQ. Given the high discordance between LJ and REMA, our findings suggest that the currently applied cut-offs for all FQs in REMA will need revision, while MGIT seems to be more reliable as a rapid liquid system for FQ resistance determination on solid medium. Furthermore, our data revealed a high level of cross-resistance between FQs. Nevertheless, MICs of the newer generations, in particular gatifloxacin, tend to be lower, supporting recent findings that patients with such levels of resistance may still benefit from high-dose FQ-based therapy.3,43
Funding
This study was supported by the Damien Foundation (Belgium). NC was funded by a Dehousse grant from the University of Antwerp (Belgium). BdJ and LR were funded by a European Research Council Starting grant INTERRUPTB (311725).
Transparency declarations
None to declare.
Supplementary data
Tables S1 to S4 are available as Supplementary data at JAC Online (http://jac.oxfordjournals.org/).
Acknowledgements
We gratefully thank Damien Foundation, MSFF, Institute of Tropical Medicine Alexander von Humboldt and the National Reference Laboratories of Central African Republic and Rwanda for providing strains from field projects.
References
- 1.World Health Organization. Global Tuberculosis Report 2014. WHO/HTM/TB/2014.08. http://www.who.int/tb/publications/global_report/gtbr14_main_text.pdf.
- 2.Poissy J, Aubry A, Fernandez C et al. . Should moxifloxacin be used for the treatment of extensively drug-resistant tuberculosis? An answer from a murine model. Antimicrob Agents Chemother 2010; 54: 4765–71. [DOI] [PMC free article] [PubMed] [Google Scholar]
- 3.Aung KJM, Van Deun A, Declercq E et al. . Successful ‘9-month Bangladesh regimen’ for multidrug-resistant tuberculosis among over 500 consecutive patients. Int J Tuberc Lung Dis 2014; 18: 1180–7. [DOI] [PubMed] [Google Scholar]
- 4.Van Deun A, Aung KJM, Halim MA et al. . Short, highly effective, and inexpensive standardized treatment of multidrug-resistant tuberculosis. Am J Respir Crit Care Med 2010; 182: 684–92. [DOI] [PubMed] [Google Scholar]
- 5.Jo KW, Lee SD, Kim WS et al. . Treatment outcomes and moxifloxacin susceptibility in ofloxacin-resistant multidrug-resistant tuberculosis. Int J Tuberc Lung Dis 2014; 18: 39–43. [DOI] [PubMed] [Google Scholar]
- 6.Jacobson KR, Tierney DB, Jeon CY et al. . Treatment outcomes among patients with extensively drug-resistant tuberculosis: systematic review and meta-analysis. Clin Infect Dis 2010; 51: 6–14. [DOI] [PMC free article] [PubMed] [Google Scholar]
- 7.Brossier F, Veziris N, Aubry A et al. . Detection by GenoType MTBDRsl test of complex mechanisms of resistance to second-line drugs and ethambutol in multidrug-resistant Mycobacterium tuberculosis complex isolates. J Clin Microbiol 2010; 48: 1683–9. [DOI] [PMC free article] [PubMed] [Google Scholar]
- 8.Yin X, Yu Z. Mutation characterization of gyrA and gyrB genes in levofloxacin-resistant Mycobacterium tuberculosis clinical isolates from Guangdong Province in China. J Infect 2010; 61: 150–4. [DOI] [PubMed] [Google Scholar]
- 9.Singh P, Jain A, Dixit P et al. . Prevalence of gyrA and B gene mutations in fluoroquinolone-resistant and -sensitive clinical isolates of Mycobacterium tuberculosis and their relationship with MIC of ofloxacin. J Antibiot (Tokyo) 2015; 68: 63–6. [DOI] [PubMed] [Google Scholar]
- 10.Malik S, Willby M, Sikes D et al. . New insights into fluoroquinolone resistance in Mycobacterium tuberculosis: functional genetic analysis of gyrA and gyrB mutations. PLoS One 2012; 7: e39754. [DOI] [PMC free article] [PubMed] [Google Scholar]
- 11.Von Groll A, Martin A, Jureen P et al. . Fluoroquinolone resistance in Mycobacterium tuberculosis and mutations in gyrA and gyrB. Antimicrob Agents Chemother 2009; 53: 4498–500. [DOI] [PMC free article] [PubMed] [Google Scholar]
- 12.da Silva PE, Von Groll A, Martin A et al. . Efflux as a mechanism for drug resistance in Mycobacterium tuberculosis. FEMS Immunol Med Microbiol 2011; 63: 1–9. [DOI] [PubMed] [Google Scholar]
- 13.World Health Organization. Policy Guidance on Drug-Susceptibility Testing (DST) of Second-Line Antituberculosis Drugs. 2008; WHO/HTM/TB/2008.392. http://apps.who.int/iris/bitstream/10665/70500/1/WHO_HTM_TB_2008.392_eng.pdf. [PubMed]
- 14.Palomino JC, Martin A, Camacho M et al. . Resazurin microtiter assay plate: simple and inexpensive method for detection of drug resistance in Mycobacterium tuberculosis. Antimicrob Agents Chemother 2002; 46: 2720–2. [DOI] [PMC free article] [PubMed] [Google Scholar]
- 15.Umubyeyi AN, Martin A, Zissis G et al. . Evaluation of the resazurin microtiter assay for rapid detection of ofloxacin resistance in M. tuberculosis . Int J Tuberc Lung Dis 2006; 10: 808–11. [PubMed] [Google Scholar]
- 16.Martin A, Camacho M, Portaels F et al. . Resazurin microtiter assay plate testing of Mycobacterium tuberculosis susceptibilities to second-line drugs: rapid, simple, and inexpensive method. Antimicrob Agents Chemother 2003; 47: 3616–9. [DOI] [PMC free article] [PubMed] [Google Scholar]
- 17.Martin A, Paasch F, Docx S et al. . Multicentre laboratory validation of the colorimetric redox indicator (CRI) assay for the rapid detection of extensively drug-resistant (XDR) Mycobacterium tuberculosis. J Antimicrob Chemother 2011; 66: 827–33. [DOI] [PubMed] [Google Scholar]
- 18.World Health Organization. Noncommercial Culture and Drug-Susceptibility Testing Methods for Screening Patients at Risk for Multidrug-Resistant Tuberculosis: Policy Statement. 2011; WHO/HTM/TB/2011.9 http://apps.who.int/iris/bitstream/10665/44601/1/9789241501620_eng.pdf. [PubMed] [Google Scholar]
- 19.Canetti G, Fox W, Khomenko A et al. . Advances in techniques of testing mycobacterial drug sensitivity, and the use of sensitivity tests in tuberculosis control programmes. Bull World Health Organ 1969; 41: 21–43. [PMC free article] [PubMed] [Google Scholar]
- 20.Rüsch-Gerdes S, Pfyffer GE, Casal M et al. . Multicenter laboratory evaluation of the BACTEC MGIT 960 technique for testing susceptibilities of Mycobacterium tuberculosis to classical second-line drugs and newer antimicrobials. J Clin Microbiol 2006; 44: 688–92. [DOI] [PMC free article] [PubMed] [Google Scholar]
- 21.Krüüner A, Yates MD, Drobniewski FA. Evaluation of MGIT 960-based antimicrobial testing and determination of critical concentrations of first- and second-line antimicrobial drugs with drug-resistant clinical strains of Mycobacterium tuberculosis. J Clin Microbiol 2006; 44: 811–8. [DOI] [PMC free article] [PubMed] [Google Scholar]
- 22.Somasundaram S, Paramasivan CN. Susceptibility of Mycobacterium tuberculosis strains to gatifloxacin and moxifloxacin by different methods. Microbiology 2006; 52: 190–5. [DOI] [PubMed] [Google Scholar]
- 23.Angeby KA, Jureen P, Giske CG et al. . Wild-type MIC distributions of four fluoroquinolones active against Mycobacterium tuberculosis in relation to current critical concentrations and available pharmacokinetic and pharmacodynamic data. J Antimicrob Chemother 2010; 65: 946–52. [DOI] [PubMed] [Google Scholar]
- 24.World Health Organization. Guidelines for Drug Susceptibility Testing for Second-Line Anti-Tuberculosis Drugs for DOTS-Plus . 2001; WHO/CDS/TB/2001.288 http://apps.who.int/iris/bitstream/10665/83807/1/WHO_CDS_TB_2001.288_eng.pdf. [Google Scholar]
- 25.Aubry A, Sougakoff W, Bodzongo P et al. . First evaluation of drug-resistant Mycobacterium tuberculosis clinical isolates from Congo revealed misdetection of fluoroquinolone resistance by line probe assay due to a double substitution T80A-A90G in GyrA. PLoS One 2014; 9: e95083. [DOI] [PMC free article] [PubMed] [Google Scholar]
- 26.Aubry A, Veziris N, Cambau E et al. . Novel gyrase mutations in quinolone-resistant and -hypersusceptible clinical isolates of Mycobacterium tuberculosis: functional analysis of mutant enzymes. Antimicrob Agents Chemother 2006; 50: 104–12. [DOI] [PMC free article] [PubMed] [Google Scholar]
- 27.Sulochana S, Rahman F, Paramasivan CN. In vitro activity of fluoroquinolones against Mycobacterium tuberculosis. J Chemother 2005; 17: 169–73. [DOI] [PubMed] [Google Scholar]
- 28.Zhao LL, Xia Q, Lin N et al. . Evaluation of BACTEC MGIT 960 system for the second-line drugs susceptibility testing of Mycobacterium tuberculosis in China. J Microbiol Methods 2012; 91: 212–4. [DOI] [PubMed] [Google Scholar]
- 29.Said HM, Kock MM, Ismail NA et al. . Comparison between the BACTEC MGIT 960 system and the agar proportion method for susceptibility testing of multidrug resistant tuberculosis strains in a high burden setting of South Africa. BMC Infect Dis 2012; 12: 369–74. [DOI] [PMC free article] [PubMed] [Google Scholar]
- 30.Horne DJ, Pinto LM, Arentz M et al. . Diagnostic accuracy and reproducibility of WHO-endorsed phenotypic drug susceptibility testing methods for first-line and second-line antituberculosis drugs. J Clin Microbiol 2013; 51: 393–401. [DOI] [PMC free article] [PubMed] [Google Scholar]
- 31.Van Deun A, Barrera L, Bastian I et al. . Mycobacterium tuberculosis strains with highly discordant rifampin susceptibility test results. J Clin Microbiol 2009; 47: 3501–6. [DOI] [PMC free article] [PubMed] [Google Scholar]
- 32.Rigouts L, Gumusboga M, Bram de Rijk W et al. . Rifampin resistance missed in automated liquid culture systems for Mycobacterium tuberculosis isolates with specific rpoB mutations. J Clin Microbiol 2013; 51: 2641–5. [DOI] [PMC free article] [PubMed] [Google Scholar]
- 33.Billington OJ, McHugh TD, Gillespie SH. Physiological cost of rifampin resistance induced in vitro in Mycobacterium tuberculosis. Antimicrob Agents Chemother 1999; 43: 1866–9. [DOI] [PMC free article] [PubMed] [Google Scholar]
- 34.Gagneux S, Davis Long C, Small PM et al. . The competitive cost of antibiotic resistance in Mycobacterium tuberculosis. Science 2006; 312: 1944–6. [DOI] [PubMed] [Google Scholar]
- 35.Mariam DH, Mengistu Y, Hoffner SE et al. . Effect of rpoB mutations conferring rifampin resistance on fitness of Mycobacterium tuberculosis. Antimicrob Agents Chemother 2004; 48: 1289–94. [DOI] [PMC free article] [PubMed] [Google Scholar]
- 36.van Ingen J, Simons S, de Zwaan R et al. . Comparative study on genotypic and phenotypic second-line drug resistance testing of Mycobacterium tuberculosis complex isolates. J Clin Microbiol 2010; 48: 2749–53. [DOI] [PMC free article] [PubMed] [Google Scholar]
- 37.Li J, Gao X, Luo T et al. . Association of gyrA/B mutations and resistance levels to fluoroquinolones in clinical isolates of Mycobacterium tuberculosis. Emerg Microbes Infect 2014; 3: e19. [DOI] [PMC free article] [PubMed] [Google Scholar]
- 38.Nosova EY, Bukatina AA, Isaeva YD et al. . Analysis of mutations in the gyrA and gyrB genes and their association with the resistance of Mycobacterium tuberculosis to levofloxacin, moxifloxacin and gatifloxacin. J Med Microbiol 2013; 62: 108–13. [DOI] [PubMed] [Google Scholar]
- 39.Ji B, Lounis N, Truffot-Pernot C et al. . In vitro and in vivo activities of levofloxacin against Mycobacterium tuberculosis. Antimicrob Agents Chemother 1995; 39: 1341–4. [DOI] [PMC free article] [PubMed] [Google Scholar]
- 40.Park-Wyllie LY, Juurlink DN, Kopp A et al. . Outpatient gatifloxacin therapy and dysglycemia in older adults. N Engl J Med 2006; 354: 1352–61. [DOI] [PubMed] [Google Scholar]
- 41.Merle CS, Fielding K, Sow OB et al. . A four-month gatifloxacin-containing regimen for treating tuberculosis. N Engl J Med 2014; 371: 1588–98. Erratum in: N Engl J Med 2015; 372: 1677. [DOI] [PubMed] [Google Scholar]
- 42.Yew WW, Chan CK, Leung CC et al. . Comparative roles of levofloxacin and ofloxacin in the treatment of multidrug-resistant tuberculosis. Preliminary results of a retrospective study from Hong Kong. Chest 2003; 124: 1476–81. [DOI] [PubMed] [Google Scholar]
- 43.Rigouts L, Coeck N, Gumusboga M et al. . Specific gyrA mutations predict poor treatment outcome in MDR-TB. J Antimicrob Chemother 2016; 71: 314–23. [DOI] [PMC free article] [PubMed] [Google Scholar]
- 44.Escribano I, Rodriguez JC, Llorca B et al. . Importance of the efflux pump systems in the resistance of Mycobacterium tuberculosis to fluoroquinolones and linezolid. Chemotherapy 2007; 53: 397–401. [DOI] [PubMed] [Google Scholar]
- 45.Singh M, Jadaun GP, Ramdas et al. . Effect of efflux pump inhibitors on drug susceptibility of ofloxacin resistant Mycobacterium tuberculosis isolates. Indian J Med Res 2011; 133: 535–40. [PMC free article] [PubMed] [Google Scholar]
- 46.Lu J, Liu M, Wang Y et al. . Mechanisms of fluoroquinolone monoresistance in Mycobacterium tuberculosis. FEMS Microbiol Lett 2014; 353: 40–8. [DOI] [PubMed] [Google Scholar]
- 47.Streicher EM, Bergval I, Dheda K et al. . Mycobacterium tuberculosis population structure determines the outcome of genetics-based second-line drug resistance testing. Antimicrob Agents Chemother 2012; 56: 2420–7. [DOI] [PMC free article] [PubMed] [Google Scholar]
- 48.Mokrousov I, Otten T, Manicheva O et al. . Molecular characterization of ofloxacin-resistant Mycobacterium tuberculosis strains from Russia. Antimicrob Agents Chemother 2008; 52: 2937–9. [DOI] [PMC free article] [PubMed] [Google Scholar]
- 49.Hillemann D, Rüsch-Gerdes S, Richter E. Feasibility of the GenoType MTBDRsl assay for fluoroquinolone, amikacin-capreomycin, and ethambutol resistance testing of Mycobacterium tuberculosis strains and clinical specimens. J Clin Microbiol 2009; 47: 1767–72. [DOI] [PMC free article] [PubMed] [Google Scholar]
- 50.Eilertson B, Maruri F, Blackman A et al. . High proportion of heteroresistance in gyrA and gyrB in fluoroquinolone-resistant Mycobacterium tuberculosis clinical isolates. Antimicrob Agents Chemother 2014; 58: 3270–5. [DOI] [PMC free article] [PubMed] [Google Scholar]
- 51.Pholwat S, Stroup S, Foongladda S et al. . Digital PCR to detect and quantify heteroresistance in drug resistant Mycobacterium tuberculosis. PLoS One 2013; 8: e57238. [DOI] [PMC free article] [PubMed] [Google Scholar]
- 52.Bek Folkvardsen D, Vensson E, Thomsen VØ et al. . Can molecular methods detect 1% isoniazid resistance in Mycobacterium tuberculosis? J Clin Microbiol 2013; 51: 1596–9. [DOI] [PMC free article] [PubMed] [Google Scholar]
- 53.Mayer C, Takiff H. The molecular genetics of fluoroquinolone resistance in Mycobacterium tuberculosis. Microbiol Spectr 2014; 2: 1–9. [DOI] [PubMed] [Google Scholar]
Associated Data
This section collects any data citations, data availability statements, or supplementary materials included in this article.