Abstract
Triarylmethyl radicals (trityls, TAMs) represent a relatively new class of spin labels. The long relaxation of trityls at room temperature in liquid solutions makes them a promising alternative for traditional nitroxides. In this work we have synthesized a series of TAMs including perdeuterated Finland trityl (D36 form) , mono-, di-, and tri-ester derivatives of Finland-D36 trityl, deuterated form of OX63, dodeca-n-butyl homologue of Finland trityl, and triamide derivatives of Finland trityl with primary and secondary amines attached. We have studied room-temperature relaxation properties of these TAMs in liquids using pulsed Electron Paramagnetic Resonance (EPR) at two microwave frequency bands. We have found the clear dependence of phase memory time (Tm~T2) on magnetic field: room-temperature Tm values are ~1.5-2.5 times smaller at Q-band (34 GHz, 1.2 T) compared to X-band (9 GHz, 0.3 T). This trend is ascribed to the contribution from g-anisotropy that is negligible at lower magnetic fields but comes into play at Q-band. In agreement with this, while T1~Tm at X-band, we observe T1>Tm at Q-band due to increased contributions from incomplete motional averaging of g-anisotropy. In addition, the viscosity dependence shows that (1/Tm-1/T1) is proportional to the tumbling correlation time of trityls. Based on the analysis of previous data and results of the present work, we conclude that in general situation where spin label is at least partly mobile, X-band is most suitable for application of trityls for room-temperature pulsed EPR distance measurements.
I. INTRODUCTION
Triarylmethyl (TAM, trityl) radicals appeared recently as a new class of spin labels having long electron spin relaxation on the order of microseconds in liquids at room temperature.1 This profoundly long relaxation makes trityls a promising alternative for nitroxide spin labels in biological applications of EPR. The development of this research field requires further improvement of trityl-based labels in order to achieve even longer T1 and T2 (Tm), as well as identification of the factors affecting relaxation in liquids at 300 K. Apart from low-temperature EPR and general studies of TAMs,2-6 the nanoscale distances were recently measured at 4 °C in protein7 and at 37 °C in DNA duplex8 using TAM labels and pulsed dipolar EPR spectroscopy. Physiological temperatures were reached owing to the long phase memory time (Tm) of TAMs.1 Phase memory time is one of the most critical parameters for dipolar EPR spectroscopy determining the range of available distances.9-10 For example, Tm=0.7 μs at 4 °C in TAM-labeled protein allowed measuring distances up to 2.5 nm.7 An improvement of Tm to 1.4 μs at 37 °C in TAM-labeled DNA duplex allowed extending the available distances up to 4.6 nm.8
Thus, development of strategies for further increase of Tm is a highly topical task. Note, however, that covalent attachment of spin label to biopolymer usually leads to a decrease of room-temperature Tm value compared to that for free radical in solution. This stems from larger rotational correlation times and the presence of anisotropic interactions. Anisotropies of hyperfine interaction (HFI) and g-factor are the two primary sources causing the decrease of Tm when the mobility of spin label becomes restricted. With respect to free TAM radicals, the multifrequency studies of Finland trityl at X-, S-, L-bands and 250 MHz revealed that HFI anisotropy plays dominant role and the contribution of g-anisotropy is negligible.1
The available methods for measurements of long interspin distances at physiological temperatures were recently complemented by saturation-recovery EPR technique.11-12 In this approach the spin lattice Relaxation Enhancement (1/T1) of spin labels caused by the paramagnetic metal (Cu2+) is studied, and the range of available distances crucially depends on the values of T1.11-16 Therefore, due to the extraordinary long T1 values (~10-20 μs) trityl radicals seem to be promising probes for this approach. The frequency dependence of T1 for Finland trityl and its derivative OX63 was studied in the range of 250 MHz to 9.2 GHz at room temperature.1,17 In particular, it was found that at 250 MHz T1 is determined by inter- and intra-molecular electron–proton dipolar couplings modulated by molecular tumbling with the rates comparable to the reciprocal of the resonance frequency. The contribution of this mechanism is reduced at higher frequencies and becomes negligible at X-band, where spin-lattice relaxation of TAMs is contributed mainly by frequency-independent local mode process with energy of 590 cm−1.17
As a rule, performing pulsed dipolar EPR experiments at frequencies higher than X-band allows one to increase the S/N ratio, as was demonstrated using nitroxide-based spin labels at Q-band.18-19 Therefore, one might naturally assume that the same tendency should hold for room-temperature distance measurements on trityl radicals. Up to date, however, there was no clear understanding of the factors affecting electron relaxation times of trityl labels attached to biopolymers. Therefore, the data on electron relaxation times of trityls at X-band and higher frequencies should have a high practical importance for applications of pulsed dipolar EPR.
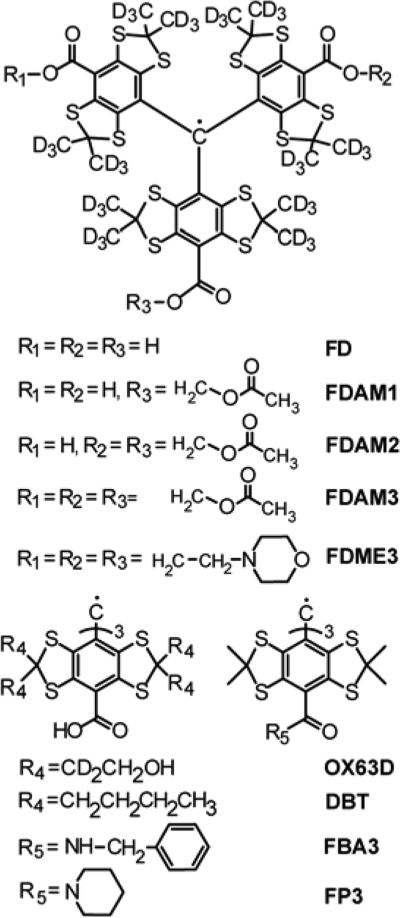
In this work, we synthesized the broad range of triarylmethyl radicals (TAMs) with varying number and structure of substituents (Scheme 1) and measured their relaxation times at room temperature in liquids. In order to find optimal structures of trityl spin labels and experimental conditions for room-temperature distance measurements in biomolecules we focused on comparison of Tm for different trityls, as well as on field dependence of Tm in the range 9-34 GHz. In addition, the T1 values for newly synthesized trityls also represent very useful data for applications other than pulsed dipolar EPR, e.g. for distance measurements at physiological temperature using Relaxation Enhancement. Note that we studied different derivatives of Finland trityl including those that were already used successfully for distance measurements at physiological conditions, namely TAM with piperazine substituent (FP3)8 and TAM with amide substituent (FBA3).7
Scheme 1.
Structures of studied trityl radicals.
II. EXPERIMENTAL
II.1. Synthesis of Triarylmethyls
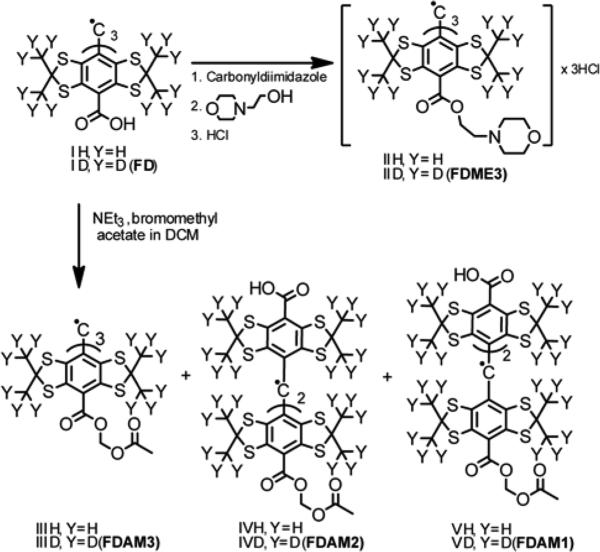
The perdeuterated form of Finland trityl (FD, see Scheme 2 and Supporting Information) was prepared by the two-step one-pot reaction, i.e. by conversion of the corresponding diamagnenic triarylmethanol to trityl cation with the subsequent reduction of this cation with tin(II) chloride.20
Scheme 2.
Synthesis of the Finland trityl derivatives FDME3, FDAM3, FDAM2 and FDAM1.
High reactivity of bromomethyl acetate toward anionic nucleophiles was used in synthesis of esters FDAM3, FDAM2 and FDAM1. The reaction of triethylammonium salt of FD with 1.8 molar equivalents of bromomethyl acetate smoothly afforded a mixture of mono-, di- and triesters. The title products were isolated in acceptable yields (27, 32 and 19 % respectively) using column chromatography technique.
Activation of the triacid FD (Scheme 2) with carbonyldiimidazole readily afforded the triester FDME3 in high yield. It was isolated and characterized in the form of trihydrochloride derivative. Application of alternative methods typical of the acid activation, e.g. with dicyclohexylcarbodiimide or conversion of initial acid to OSU ester or acyl chloride derivatives, were found to be less useful: these reactions resulted in badly contaminated mixtures of products.
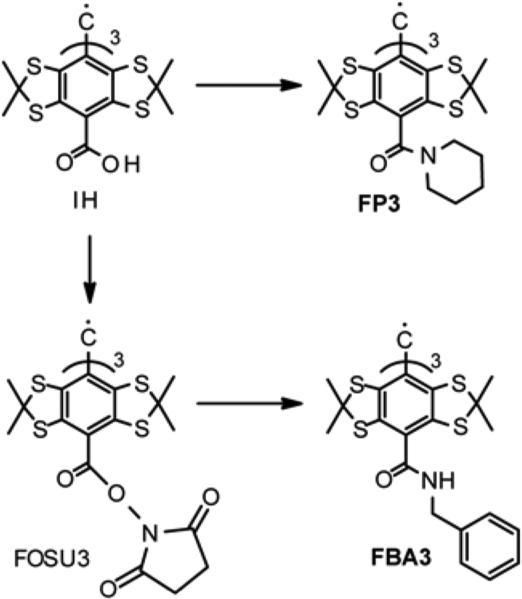
Contrary to ester FDME3, the amides FP3 and FBA3 were readily obtained by reaction of piperidine with tris-chloroanhydride form of triacid IH, and by coupling of benzyl amine with tris-OSU ester FOSU3, respectively (Scheme 3).
Scheme 3.
Synthesis of trityls FP3 and FBA3.
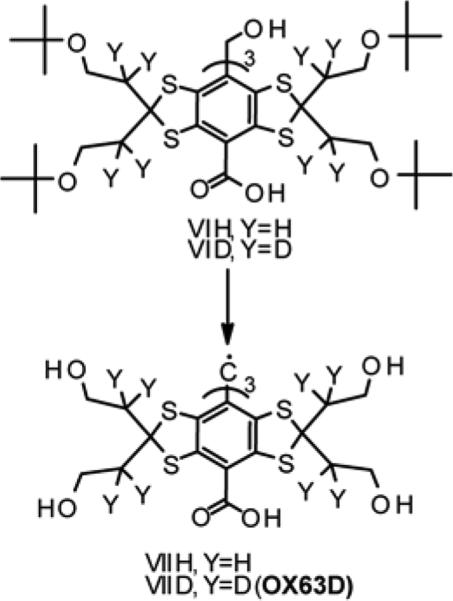
The synthesis of deuterated analogue of OX63 is shown in Scheme 4. The initial triarylmethanol VID21 was treated with formic acid to remove all the protecting tert-butyl groups by substitution them with formate groups. The solid material obtained after removal of volatile components was converted to trityl cation in reaction with trifluoromethanesulfonic acid, the cation was then reduced to intermediate TAM.
Scheme 4.
Synthesis of OX63D.
To remove formate groups, the latter was hydrolyzed with excess of aqueous NaOH to give a solution of sodium salt of trityl OX63D. The resulting solution was acidified by its slow addition to diluted aqueous hydrochloric acid to afford a fine crystalline precipitate of the title TAM.
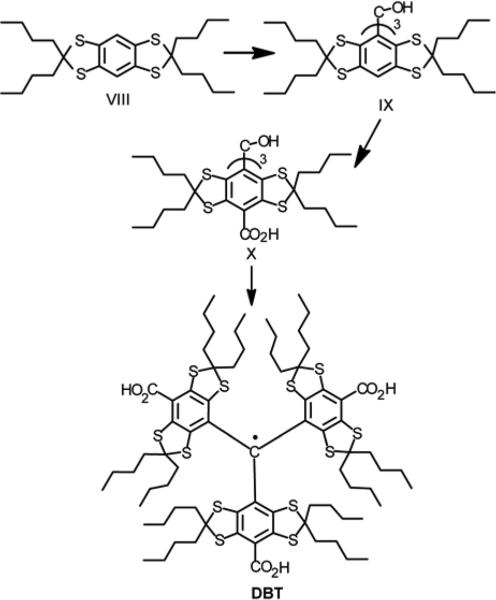
The trityl DBT (Scheme 5) was obtained by analogy with the protocol focused on Finland trityl.20 A reaction of nonanone-5 with 1,2,4,5-tetra-tert-butylthiobenzene in the presence of boron trifluoride readily afforded 2,2,6,6-tetra-n-butyl-benzo[1,2-d;4,5-d’]bis[1,3]dithiole VIII. Triarylmethyl alcohol IX was then prepared by treatment of arene VII with n-BuLi and the subsequent addition of 0.32 equiv of diethylcarbonate. Purification of the crude product did not require a lengthy and tedious column chromatography, instead it was completed by refluxing the crude product with 1:1 mixture of hexane and carbon tetrachloride.
Scheme 5.
Synthesis of TAM substituted with n-butyl groups at side positions (DBT).
The arene IX was converted to a slurry of tris-lithium derivative by treatment with n-BuLi in TMEDA/hexane solution. This organolithium intermediate readily reacted with solid carbon dioxide to afford the triacid X in good isolated yield (57 %). The title TAM DBT was prepared in quantitative yield by the known literature method.20 The identity of TAMs obtained in this study was confirmed by element analyses and combination of instrumental methods: high-resolution ESI/MS, EPR and FTIR spectroscopies.
II.2. EPR procedures
All used solvents were preliminary distilled. Concentrations of dissolved trityls were ~10 μM to avoid any effects of the radical-radical collisions on electron spin relaxation. The concentration for each sample / each solvent was adjusted experimentally, starting at 0.2 mM solution and diluting it until the spectrum shape and relaxation times (in evacuated samples) became completely concentration-independent. The samples were sealed off in the glass capillary tubes (OD 1.5 mm, ID 0.9 mm, max. volume 50 μl). In order to prevent the line broadening and relaxation enhancement caused by oxygen, deoxygenation was performed by repeated “freeze-pump-thaw” cycles for at least ten times. For each sample we ensured that the further evacuation does not increase the observed relaxation times T1 and T2. The obtained T1 and T2 values for FD and FH in H2O perfectly agree with those reported previously, [1,17] thus confirming the efficiency of deoxygenation.
Low temperature pulsed and CW EPR experiments were carried out at X-band (9 GHz) and Q-band (34 GHz) using commercial Bruker ELEXSYS E580 spectrometer equipped with an Oxford flow helium cryostat and temperature control system.
Measurements of electron spin relaxation (Tm~T2, T1) were performed at X- and Q-bands at T=300 K. Tm was measured using two-pulse Electron Spin Echo (ESE) sequence, T1 was measured using inversion-recovery technique with inversion π-pulse and detecting two-pulse ESE sequence. These experiments were made using 2-step phase cycling to eliminate a signal of FID. The pulse lengths were 100/200 ns at X-band and 120/240 ns at Q-band for π/2 and π pulses, respectively. ESE was measured at field position corresponding to the maximum of the EPR spectrum. Obtained relaxation curves were fitted well using monoexponential function. All measured relaxation times were reproduced for at least 3 times for independently prepared new sample each time. All pulse EPR experiments were performed with repetition time of 300 μs and 3000 μs at 300 K and 80 K, respectively. FID-detected EPR spectra were recorded at Q-band at 80 K. The pulse length was 1200 ns.
Experimental CW EPR settings at 140 K were as follows: sweep width 2.5 mT; microwave power 6.142·10−7 W; modulation frequency 100 kHz; modulation amplitude 0.1 mT; time constant 81.92 ms; sweep time 83.89 s; number of points 1024; number of scans 4.
CW EPR experiments at room temperature were performed at X-band using commercial spectrometer Bruker EMX. Experimental CW EPR settings at room temperature were as follows: sweep width 0.1 – 0.5 mT; microwave power 1-6 μW; modulation frequency 100 kHz; modulation amplitude 2 – 5 μT; time constant 327.68 – 1310.72 ms; sweep time 167.78-671.12 s; number of points 512; number of scans 1.
In order to determine isotropic g-factor of TAM (giso) at 300 K, we simultaneously recorded X-band CW EPR spectra of two degassed samples placed in separate sample tubes (FD as a reference and the investigated TAM), and thus obtained target giso value relative to the known giso of FD (2.0026 22).
III. RESULTS
III.1. CW EPR study
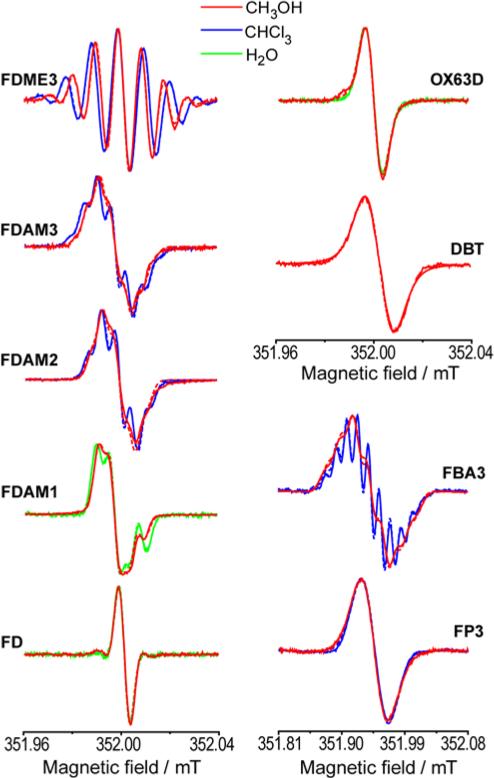
Before studying electron spin relaxation of series of TAMs, we investigated all these radicals using continuous wave (CW) EPR in order to identify their purity and HFI couplings. Figure 1 shows X-band CW EPR spectra of studied trityl radicals obtained at 300 K in different solvents. The experimental spectra were simulated using Easyspin software (see SI).23 The obtained spectroscopic parameters are summarized in Table 1. The radicals FDME3, FDAM2-3, FBA3 (that can be dissolved in MeOH and CHCl3) show the dependence of hyperfine constant aH (arising from methylene protons) on solvent polarity: the aH value decreases as solvent polarity grows, indicating a decrease of spin density on methylene protons.
Fig. 1.
X-band CW EPR spectra of studied trityl radicals at 300 K in different solvents.
Table 1.
Spectroscopic properties of deoxygenated trityl radicals at 300 K. The values of isotropic hyperfine constants and peak-to-peak line widths are given in μT.
| Trityl | Solvent | Aisoa |
LWa (G; L)c | gisoa | |
|---|---|---|---|---|---|
| 1H (nb) | 14N (nb) | ||||
| FDAM3 | MeOH | 5.0 (3), 4.5 (3) | - | 5.1; 0 | 2.00277 |
| CHCl3 | 6.1 (3), 4.9 (3) | - | 5.1; 0 | 2.00282 | |
| FDAM2 | MeOH | 5.1 (2), 4.5 (2) | - | 5.2; 0 | 2.00271 |
| CHCl3 | 6.1 (2), 4.8 (2) | - | 5.0; 0 | 2.00281 | |
| FDAM1 | MeOH | 4.7 (1), 4.3 (1) | - | 4.4; 1.0 | 2.00266 |
| H2O | 4.6 (1), 5.5 (1) | - | 5.1; 0 | 2.00266 | |
| FDME3 | MeOH | 9.4 (3), 9.1 (3) | - | 5.2; 0 | 2.00274 |
| CHCl3 | 10.6 (3), 10.6 (3) | - | 5.6; 0 | 2.00278 | |
| FD | MeOH | - | - | 4.5; 0d | 2.00260 |
| H2O | - | - | 4.6; 0d | 2.00260 | |
| OX63D | MeOH | - | - | 6.0; 2.3 | 2.00267 |
| H2O | - | - | 7.5; 0 | 2.00268 | |
| DBT | MeOH | - | - | 10.0; 3.9 | 2.00266 |
| FBA3 | MeOH | <6.0(6) | 18.2 (3) | 20.0; 0 | 2.00255 |
| CHCl3 | 15.0 (3), 13.3 (3) | 15.3 (3) | 13.5; 0 | 2.00261 | |
| FP3 | MeOH | - | <10.7(3) | 39.5; 0 | 2.00252 |
| CHCl3 | - | <10.7(3) | 38.3; 0 | 2.00253 | |
The simulated spectra were calculated in MATLAB using the EasySpin software package. Isotropic g-factors are close to the literature values of FD (giso=2.0026)
n - number of equivalent nuclei
G and L correspond to the Gaussian and Lorentzian contributions into the linewidth
See Supporting Information for comparison with literature data.
CW EPR spectrum of FD radical consists of single narrow EPR line of Gaussian shape due to the unresolved hyperfine constants on methyl deuterons of the aryl rings. Similarly, CW EPR spectra of OX63D and DBT are also simulated by single line, but taking into account both Gaussian and Lorentzian broadenings. The spectra of other radicals FDME3 and FDAM1-3 demonstrate additional splitting due to the hyperfine interaction with methylene protons –O-CH2- of side ester functions. EPR spectra of FDME3 and FDAM3 show 7 well or partially resolved lines that were simulated using two groups of three equivalent protons with slightly different hyperfine constants aH. The observed difference between hyperfine constants should be assigned to the effect of chirality.21, 24-25 Due to steric hindrance caused by bulky tetrathioaryl groups attached to central carbon atom, trityl radicals adopt a propeller-like conformation in which all rings have the same direction of twist. This geometrical arrangement allows two conformations to occur, i.e. the right-handed propeller (P-conformation) and left-handed propeller (M-conformation). The propeller-shape conformation of TAM associated with a slow interconversion of conformers is responsible for the diastereotopic character of geminal hydrogen atoms of methylene groups bonded to carboxyl moieties. In addition, the steric hindrance caused by adjacent sulfur atoms creates severe obstacles for free rotation of carboxyl-derived groups.6 The combination of hindered rotation of para-substituents and general chirality of TAM core make the two protons of each methylene group inequivalent. Thus, the total of 6 protons is subdivided into two diastereotopic groups with three protons in each. The aH values of methylene proton of FDAM3 are two times smaller compared to FDME3. EPR spectra of FDAM2 and FDAM1 consist of 5 and 3 partially resolved lines indicating hyperfine interaction with 4 and 2 methylene protons, respectively, with hyperfine constants close to those in FDAM3. In addition to the main EPR signal of FDAM1, a weak singlet line was observed at g-value corresponding to the signal of FD radical. It was assigned to the product of ester solvolysis, whose amount does not exceed 13% in freshly prepared samples in water (see SI).
The EPR spectrum of triamide derivative of Finland trityl FBA3 in chloroform consists of 11 partially resolved lines. This spectrum was simulated using 3 equivalent 14N HFI constants and two groups of three equivalent protons with slightly different hyperfine constants aH related to protons of methylene groups bonded to amine. The hyperfine splitting on proton of amine group was not observed; presumably, the hyperfine constant for this group is smaller than the linewidth. In methanol only poorly resolved lines of three 14N HFI splittings were observed, with all other hyperfine constants being hidden within a linewidth.
The EPR spectra of triamide FP3, which represents the derivative of secondary amines, do not show any resolved splitting in both methanol and chloroform indicating that nitrogen constant is smaller compared to FBA3; according to performed estimation, it does not exceed 0.01 mT.
III.2. Measurements of electron spin relaxation times T1 and Tm
III.2.1. Dependence on magnetic field (X/Q-bands)
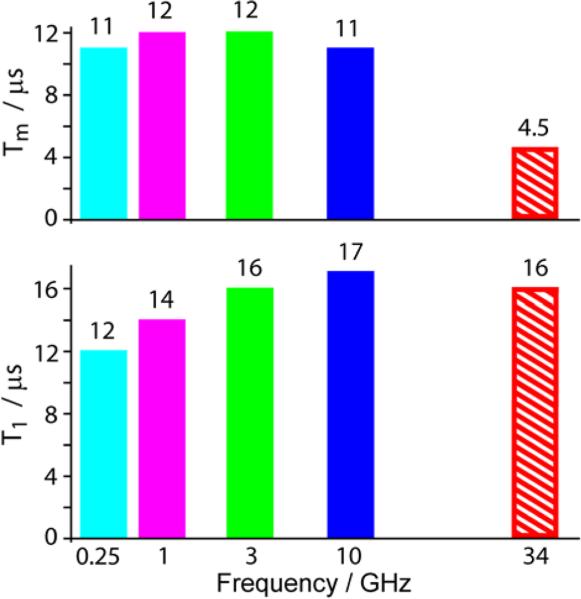
We have studied relaxation properties of several perspective trityls including FD and its derivatives. In all cases we have observed clear dependence of Tm on magnetic field by passing from X- to Q-band (9 to 34 GHz). Figure 2 exemplifies the observed trend using Finland trityl. The phase memory time Tm remains closely constant below 9 GHz, but it decreases by a factor of ~2.5 at 34 GHz; at the same time, T1 remains roughly field-independent between 3 and 34 GHz.
Fig. 2.
The dependence of relaxation times Tm and T1 on mw frequency for deuterated Finland trityl (FD) in H2O at 300 K. The data at 0.25-3 GHz were taken from Ref.1.
In order to understand the underlying mechanisms of Tm and its magnetic field dependence, we have performed a lot of additional measurements of T1 and Tm relaxations for the series of trityls depending on solvent viscosity, depending on deuteration of radical and/or solvent, depending on polarity of the solvent and, finally, on radical structure (see summary in Table 2). Despite variation of Tm values on radical structure, the decrease of Tm by a factor of 1.5-2.5 at Q-band compared to X-band was observed for all studied radicals.
Table 2.
Electron spin dephasing time, Tm, and electron spin-lattice relaxation time, T1, in H2O for investigated radicals at 300 K at X- and Q-bands. The values of Tm and T1 are given in μs. Accuracy of measurements is about 10%.
| Trityl | Solvent | X-band | Q-band | ||
|---|---|---|---|---|---|
| Tm | T1 | Tm | T1 | ||
| FDAM3 | MeOH | 8.3 | 11.1 | 5.6 | 9.7 |
| CHCl3 | 8.4 | 9.9 | 6.0 | 9.6 | |
| FDAM2 | MeOH | 8.1 | 11.6 | 4.9 | 11.6 |
| CH2Cl2 | 9.6 | 12.3 | 6.7 | 11.3 | |
| CHCl3 | 8.6 | 11.0 | 5.6 | 10.0 | |
| CH2ClCH2Cl | 6.0 | 10.5 | 4.3 | 10.3 | |
| CH3CH2OH | 6.0 | 10.1 | 3.1 | 10.0 | |
| Tert-buthanol | 4.0 | 11.7 | 1.4 | 12.2 | |
| FDAM1 | MeOH | 7.6 | 14.3 | 2.8 | 12.6 |
| H2O | 10.1 | 14.5 | 4.7 | ||
| FDME3 | MeOH | 8.5 | 12.2 | 5.4 | 11.2 |
| CHCl3 | 9.1 | 11.4 | 5.4 | 11.2 | |
| FD | MeOH | 9.2 | 15.6 | 3.8 | 15.6 |
| H2O | 10.8 | 17.1 | 4.5 | 16.2 | |
| D2O | 13.6 | 17.7 | 4.5 | 17.0 | |
| FH | MeOH | 6.3 | 16.0 | 2.0 | 15.3 |
| H2O | 9.2 | 15.0 | 4.6 | 14.4 | |
| D2O | 10.4 | 18.0 | 4.0 | 16.8 | |
| OX63D | MeOH | 5.8 | 16.5 | 1.8 | 15.6 |
| H2O | 7.3 | 16.0 | 2.2 | 15.3 | |
| D2O | 7.6 | 16.1 | 2.0 | 16.1 | |
| DBT | MeOH | 5.0 | 14.9 | 2.1 | 14.3 |
| FBA3 | MeOH | 6.5 | 19.5 | 3.6 | 19.2 |
| CHCl3 | 7.2 | 18.0 | 4.5 | 17.6 | |
| FP3 | MeOH | 5.0 | 23.0 | 2.8 | 23.0 |
| CHCl3 | 4.5 | 26.4 | 2.3 | 25.7 | |
III.2.2. Dependence on solvent viscosity
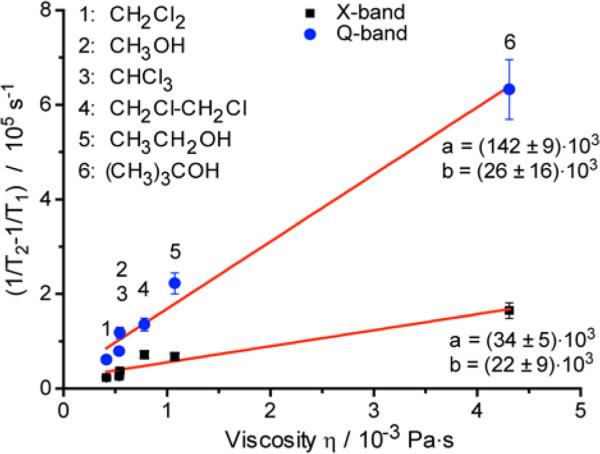
One of the first factors to be established is what motion does induce the observed relaxational (Tm) behavior. Tm values for studied samples are smaller than T1 at 9 and especially 34 GHz indicating the presence of additional contributions to spin-spin relaxation apart from spin-lattice relaxation. In order to extract these contributions, the values (1/Tm-1/T1)≈(1/T2-1/T1) were obtained that depend both on magnetic field and on solvent viscosity (Fig.3).
Fig. 3.
The dependence of (1/Tm-1/T1) values on solvent viscosity for FDAM2 at 300 K at X- (black squares) and Q-bands (blue circles). The solid red lines represent the fits obtained using function (1/Tm-1/T1)=a·η+b. Viscosity values26 for used solvents are given in SI.
FDAM2 is soluble in broad range of solvents, therefore we obtained the (1/Tm-1/T1) values as a function of solvent viscosity η and found linear dependence (Fig. 3). Since rotational correlation time of radical τc ∝ η, the data of Fig.3 also implies linear dependence of (1/Tm-1/T1) on τc. This observation agrees well with the Redfield theory's result for relaxation due to anisotropic interaction (V) modulated by rotational diffusion: (1/Tm-1/T1)∝〈V2〉τc. The proportionality factor depends on magnetic field and increases ~4-5 fold at Q-band compared to X-band, i.e. <V2> turns out to be approximately proportional to magnetic field. Previous studies on FD at X-, S-, L-bands and 250 MHz demonstrated that dominant contribution stems from HFI anisotropy rather than from g-anisotropy.1 The results obtained in our work, however, clearly show that in the range 9-34 GHz the field-dependent contributions play a significant role. As will be discussed below, the field-dependent contributions stem from pure g-anisotropy ([g:g] contribution) as well as from inner product of g- and HFI anisotropies [g:A], and these anisotropies are modulated by radical tumbling, as follows from viscosity dependence in Fig. 3.
III.2.3. Role of protons
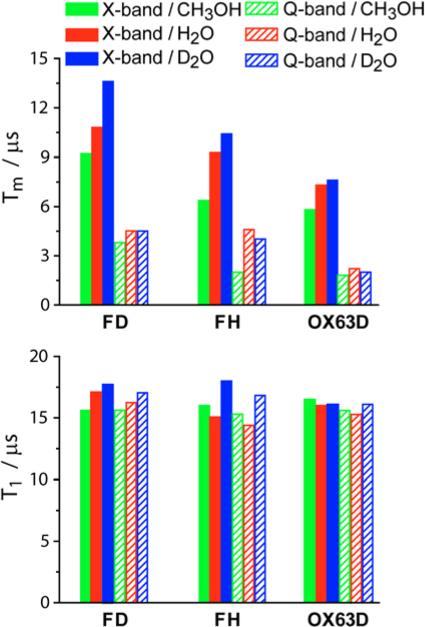
Protons (of both radical and the solvent) are known to largely contribute to the phase memory time of nitroxides as well as trityls.1,[Eatons Magn.Reson.Chem.2015] We have studied T1 and Tm at X/Q-bands for Finland trityl depending on (i) deuteration of the radical (compare deuterated FD and its protonated analogue FH) and (ii) deuteration of the solvent (H2O vs. D2O); in addition, we have studied T1 and Tm of OX63D depending on deuteration of the solvent (Table 2 and Fig.4). In all cases T1 remains nearly the same at X- and Q-bands (variations <10%). Contrary to that, Tm noticeably changes depending on deuteration. For Finland trityl deuteration of radical and solvent increases Tm by 10-25% at X-band, but at the same time the effect at Q-band is negligible. Deuteration of the solvent does not affect Tm noticeably at both X- and Q-bands.
Fig. 4.
The dependence of relaxation times Tm and T1 for FD, FH and OX63D at X- and Q-bands in different solvents (indicated on the plot) at 300 K. Accuracy of measurements is about 10%.
III.2.4. Influence of solvent polarity and hydrogen bonding
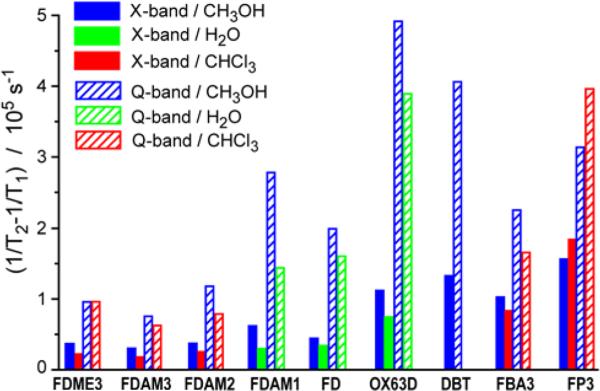
Methanol and chloroform differ in polarity, but they have almost the same viscosity and thus the same rotational correlation time for the same radical. Therefore, comparison of the relaxation times in methanol and chloroform allows one to study the influence of solvent polarity on electron relaxation. For all trityls that are soluble in both methanol and chloroform (FDME3, FDAM3, FDAM2, FBA3, FP3), the obtained (1/Tm-1/T1) values were found nearly the same within the accuracy (Table 2 and Fig.5), thus excluding the significant dependence of relaxation time on solvent polarity.
Fig. 5.
(1/Tm-1/T1) values (contributions to 1/T2 from incomplete motional averaging of anisotropic interactions) for studied trityls in different solvents at 300 K at X- and Q-bands. Accuracy of (1/Tm-1/T1) values is about 20%.
The hydrogen bonding is known to be more effective for atoms with large electronegativity. Therefore, one anticipates two trends to be found: (i) hydrogen bonding between methanol and ester derivatives of TAM (FDAM1-3, FDME3) should be stronger in comparison with triamide derivatives (FBA3, FP3); (ii) hydrogen bonding between TAM and methanol should be stronger than that between TAM and chloroform. Comparison of the (1/T2-1/T1) values in methanol and chloroform obtained for all these radicals (mentioned in (i)) did not reveal any noticeable influence of hydrogen bonding within experimental accuracy of 20%, both at X- and Q-bands (Fig.5). Further detailed studies in series of suitable solvents are required to find out the effects of hydrogen bonding on relaxation rates of TAMs (if any).
III.2.5. Influence of radical structure
All studied trityls are soluble in methanol that allows obtaining the field dependence of (1/Tm-1/T1) as a function of trityl structure. OX63D and DBT (the derivatives of Finland trityl with methyl groups substituted by heavier groups) demonstrate the larger (1/Tm-1/T1) values compared to FD.
FDAM1-3 radicals include ester substituents attached to carboxyl moieties of FD; therefore they have additional hydrogen hyperfine constants ~5 μT resolved in CW EPR (Fig.1). FDAM1-3 show X-band (1/Tm-1/T1) values close to those of FD in methanol. At Q-band the (1/Tm-1/T1) value for FDAM3 (that has 3 ester substituents) is about 2 times lower than that for FD. At the same time, trityls FDAM3 and FDME3 (differing by HFI constants of CH2 groups of the ester moiety) have nearly the same (1/Tm-1/T1) values at X- and Q-bands, respectively.
The amide derivatives of Finland trityl FBA3 and FP3 have the additional nitrogen hyperfine constants ~0.01-0.02 mT. They demonstrate 2 and 3 times higher (1/Tm-1/T1) values compared to FD, respectively. At the same time, the difference between (1/Tm-1/T1) values of amide derivatives (FBA3, FP3) and FD at Q-band is reduced, resulting in practically the same (1/Tm-1/T1) values for FBA3 and FD.
We have found that T1 is sensitive to the substituent introduced into carboxyl moiety of trityl FD. There are two trends which were found: the decrease of T1 upon introduction of the “ester groups”, and increase of T1 upon introduction of “amide groups” (resulting ratio of T1 for FDAM3 and FBA3 is about 2). Replacement of the methyl groups of FD by more bulky groups (OX63D and DBT) does not affect the observed T1 values.
III.3. EPR spectra in frozen solution
The lineshapes of EPR spectra of radicals in frozen solution yield information on anisotropic interactions that are partly (or fully) averaged by motion in liquids. In order to separate field-dependent and field-independent anisotropies (g- and HFI, respectively), we performed low-temperature EPR measurements at X- and Q-bands in glass-forming methanol. We measured CW EPR spectra at X-band at 140 K and FID-detected EPR spectra at Q-band at 80 K. It was technically difficult to employ the same approach at both mw bands due to insufficient sensitivity of FID detection at 80 K at X-band and, at the same time, easy saturation of CW EPR spectra at Q-band for all temperatures below melting point of methanol. For one of the samples (FD) we verified that FID-detected and integrated CW EPR spectra coincide at X-band at 80 K (see SI).
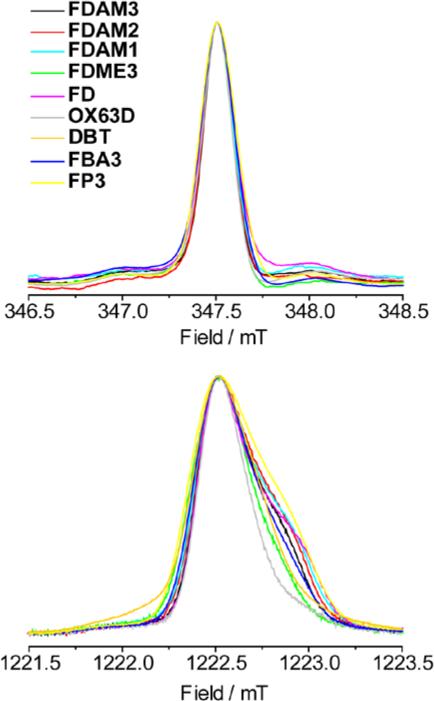
The obtained EPR spectra at X-band are similar for all trityls (Fig. 6). The Q-band spectra of trityls exhibit partially resolved g-anisotropy that slightly depends on radical structure. For semi-quantitative comparison of spectra at X- and Q-bands we introduced the value of γ1/3, defined as the width of the spectrum at the 1/3 height of the maximum. The more common value, FWHM, does not account for the shoulders in Q-band spectra. We obtained nearly the same values γ1/3≈0.25 mT at X-band and ~2.5 times higher values at Q-band, indicating field-dependent contribution of g-anisotropy to the lineshape of EPR spectra in frozen solution. Note that the obtained increase of γ1/3 by a factor of 2.5 at Q-band is smaller than the corresponding increase of the microwave frequency (~3.5). This indicates that anisotropy of hyperfine interaction might also contribute to the line width, especially at X-band.
Fig. 6.
EPR spectra of studied trityls in frozen methanol: (top) 1st integral of CW EPR spectra at X-band at 140 K and (bottom) FID-detected EPR spectra at Q-band at 80 K.
The obtained spectra were simulated using rhombic g-tensor (see SI). Similar values of gtensor were found for all trityls (except for OX63D) that agree well with the previously published data on FD.22 The rhombic g-tensor of FD was previously explained by distortion from 3-fold symmetry occurring in frozen solution.22
IV. DISCUSSION
The rotational correlation time of FD in water at 300 K is about 0.8 ns,1 thus the motion regime corresponds to ω0τc ≥1 at both X- and Q-bands, where T1>Tm was experimentally found. Therefore, the values of (1/Tm-1/T1) describe all contributions to spin-spin relaxation apart from spin-lattice relaxation. The obtained linear dependence of (1/Tm-1/T1) on solvent viscosity at X- and Q-bands indicates incomplete motional averaging of anisotropic interactions, and different slopes in these two mw bands imply significant contribution of field-dependent anisotropies. In agreement with this, for frozen solutions we have found that the EPR linewidth at Q-band is 2-3 times larger compared to that at X-band.
The only field-dependent anisotropic interaction present in studied systems is Zeeman interaction with anisotropic g-tensor. At the same time, field-independent anisotropic HFI interactions are also unavoidable. Not aiming at comprehensiveness, below we would like to demonstrate that our experimentally obtained trends can be rationalized using these two plausible relaxation mechanisms and reasonable sets of parameters. One should consider the following contributions to the phase memory time, taken in a model of radical with one magnetic nucleus I=1/2 of effective anisotropy and neglecting all terms proportional to (because, as was ω0τc ≥):27
| (1) |
Here [g:g], [g:A] and [A:A] are the inner products of corresponding g- and A-tensors, generally defined as . The first term of Eq.(1) is proportional to the square magnetic field (H), the second one to the first power of magnetic field, and the third one is field-independent. We do not observe the quadratic dependence of (1/Tm-1/T1) on magnetic field; in average over all studied radicals, the experimental dependence of (1/Tm-1/T1) is between being proportional to H and to H2 (Fig.5). Thus, it is most reasonable to assume that the observed field dependence stems from an interplay of [g:g] term and cross-anisotropy term [g:A]. Given that previous observations indicate negligible contribution of g-anisotropy and dominant role of HFI anisotropy at νmw<10 GHz,1 one anticipates that going to higher and higher magnetic field will first reveal the contribution of [g:A] term, and only then the term [g:g] might become apparent. Thus, the observed tendency is qualitatively coherent with previous observations.
Based on the available data, we can only estimate the contribution of the first [g:g] term in eq.(1) and its dependence on magnetic field. The values for FD g=[2.0028 2.0020 2.0030] obtained from simulation agree well with literature data22 and give [g:g]≈6·10−7 (details in SI). Introducing these values, τc=0.8 ns, and H=1.2 T (Q-band) into the first term of eq.(1), we obtain (1/Tm-1/T1) ~7·105 s−1 in water, that is even higher than the values measured for FD (see Fig.5), despite the second and the third terms of eq.(1) were not taken into account. For H=0.3 T (X-band) the same estimation yields (1/Tm-1/T1)~0.45·105 s−1, i.e. close value compared to experimental one (Fig.5). Thus, already simplest account of [g:g] term provides qualitative agreement with experimentally observed field dependence. Estimation of [g:A] and [A:A] terms is much more difficult, since there are many small HFI constants whose anisotropies are not known, as well as relative directions of the corresponding tensors. In addition, our experiments show that interactions of electron spin with nuclei of the solvent are not completely negligible. Therefore, we cannot provide meaningful estimation for these two terms, but, as was reasoned above, contribution of [g:A] term is expected to be higher than that of [g:g] term. Overall, the combination of the first and the second terms of eq.(1) can readily provide necessary mechanism to drive noticeable shortening of Tm when passing from X- to Q-band.
The following observations summarize the “Pros” for the proposed above mechanism of Tm in studied trityls:
-
(i)
Clear field dependence of Tm at 0.3-1.2 T (X/Q-band) is found for all studied radicals;
-
(ii)
Viscosity dependence of (1/Tm-1/T1) shows that anisotropy is modulated by radical tumbling (not by any kind of local modes or internal motions of radical fragments);
-
(iii)
The 1/Tm and (1/Tm-1/T1) values at 9 and 34 GHz are greater for OX63D and DBT than for FD, as one would expect because of the slower tumbling of OX63D and DBT that have more bulky substituents than the methyl groups;
-
(iv)
Effect of deuteration of radical and/or solvent on Tm is noticeable at X-band, but an increase of the relaxation time Tm is very moderate (<50%), even when all protons are substituted by deuterons. This clearly means that other interactions add to HFI already at X-band. At Q-band the effect of deuteration becomes nearly indistinguishable, meaning that at this frequency contributions from HFIs become negligible, and thus g-anisotropy dominates the relaxation process.
-
(v)
Introduction of amide substituents (FBA3 and FP3) leads to increase of (1/Tm-1/T1) values compared to FD by a factor of 2-3, most likely due to the two effects: (i) the slower tumbling rate and (ii) additional hyperfine constants, which may well be anisotropic. At Q-band the (1/Tm-1/T1) for FBA3 and FD become nearly the same, meaning again that at this frequency contributions from HFIs become negligible, and thus g-anisotropy dominates the relaxation process.
Although the central observation of this work, namely the pronounced decrease of Tm at Q-band compared to X-band, is valid for all studied trityls and therefore is general, several smaller details remain unanswered and need to be addressed in the future. The open questions are:
- Introduction of ester into carboxyl moiety of FD increased τc, yet the decrease of Tm for FDAM3-1 compared to FD was not observed. Furthermore, the (1/Tm-1/T1) value for FDAM3 at Q-band is 2 times smaller than that for FD. Why does the increase of the number of ester substituents decrease (1/Tm-1/T1) value and the magnitude of its change with magnetic field is currently unclear.
- The viscosity of water (~1 cP) is two times higher than the viscosity of methanol (~0.5 cP).26 However, the 1/Tm and (1/Tm-1/T1) values for FD, OX63D, FDAM1 are greater in methanol than in water at both X- and Q-bands.
- OX63D has lower g-anisotropy compared to FD (as follows from EPR spectra at Q-band in frozen methanol). However, the increase of Tm at Q-band is nearly the same for both radicals.
Note, that the above peculiarities arise, first of all, from the very long relaxation times of trityls, that makes them sensitive to the subtle influences of structure and environment. These specifics of trityls, which at the same time is their most important advantage for EPR, certainly need to be studied in the future; at the same time, the conclusions concerning field dependence of relaxation and optimum conditions for EPR measurements, e.g. distance measurements, are already in hand. We stress that one of the radicals (monoamide analogue of FP3) has already been used by us as spin label for room-temperature distance measurements at X-band.8 An attractive progress would seem to be using higher magnetic fields (e.g. mw frequencies 17-94 GHz), smaller sample volumes, better sensitivity. However, the present work clearly shows that this will be done at the expense of shortened phase memory time. Possibly, shorter Tm values at 17 GHz 7 compared to those at 9 GHz 8 found previously have the same origin as the observations of the present work.
V. CONCLUSIONS
In this work, we describe convenient methods for synthesis of broad variety of triarylmethyl radicals (TAMs) with varying polarity, with varying number and nature of substituents attached to carboxyl moieties located in para-positions of TAM aryl rings, and finally with varying structure of the TAM core. The primary aim of these developments is the future application of trityls with optimum relaxation properties as spin labels for room-temperature distances measurements in biomolecules. As the first step, in this work we investigated relaxation of this new series of prospective TAMs in solutions at room temperature. Certainly, the next step is the attachment of most promising TAMs to biomolecules, that might shorten their relaxation times. Because of this, an understanding of mechanisms governing Tm is vital. This work shows that Tm shortens at Q-band compared to X-band, most probably due to the contribution of [g:g] and [g:A] anisotropy terms. Although different SDSL strategies, different linkers and immobilization procedures might affect ultimate Tm times of spin-labeled biomolecules, we anticipate that the dependence on magnetic field similar to the present work will be manifested for partly mobile TAM labels. At the current state of research, we believe that X-band is most suitable for room-temperature distance measurements using trityl spin labels.
Supplementary Material
ACKNOWLEDGMENT
All pulse EPR studies performed in this work were supported by Russian Science Foundation (No. 14-14-00922). Synthesis and preliminary characterization of studied TAMs were supported by RFBR (Nos. 13-04-00680, 14-03-93180, 14-03-31839) and The National Institute of Biomedical Imaging and Bioengineering (grant No. 5P41EB002034). We thank the personnel of the Collective Service Center of SB RAS for recording of IR and NMR spectra and performing element and HPLC analyses.
Footnotes
ASSOCIATED CONTENT
Supporting Information available: Synthesis of TAMs; Simulation of X -band CW EPR spectra at room temperature; Solvolysis of FDAM1; Comparison FID-detected and CW EPR spectra; Simulation of Q-band FID-detected EPR spectra at 80 K; Estimation of g-anisotropy contribution. This material is available free of charge via the Internet at http://pubs.acs.org.
The authors declare no competing financial interests.
REFERENCES
- 1.Owenius R, Eaton GR, Eaton SS. Frequency (250 MHz to 9.2 GHz) and viscosity dependence of electron spin relaxation of triarylmethyl radicals at room temperature. J. Magn. Reson. 2005;172(1):168–175. doi: 10.1016/j.jmr.2004.10.007. [DOI] [PubMed] [Google Scholar]
- 2.Bobko AA, Dhimitruka I, Zweier JL, et al. Trityl Radicals as Persistent Dual Function pH and Oxygen Probes for in Vivo Electron Paramagnetic Resonance Spectroscopy and Imaging: Concept and Experiment. J. Am. Chem. Soc. 2007;129(23):7240–7241. doi: 10.1021/ja071515u. [DOI] [PubMed] [Google Scholar]
- 3.Kunjir NC, Reginsson GW, Schiemann O, et al. Measurements of short distances between trityl spin labels with CW EPR, DQC and PELDOR. Phys. Chem. Chem. Phys. 2013;15(45):19673–19685. doi: 10.1039/c3cp52789a. [DOI] [PubMed] [Google Scholar]
- 4.Reginsson GW, Kunjir NC, Sigurdsson ST, et al. Trityl Radicals: Spin Labels for Nanometer-Distance Measurements. Chem-Eur. J. 2012;18(43):13580–13584. doi: 10.1002/chem.201203014. [DOI] [PubMed] [Google Scholar]
- 5.Trukhan SN, Yudanov VF, Tormyshev VM, et al. Hyperfine interactions of narrow-line trityl radical with solvent molecules. J. Magn. Reson. 2013;233(0):29–36. doi: 10.1016/j.jmr.2013.04.017. [DOI] [PMC free article] [PubMed] [Google Scholar]
- 6.Bowman MK, Mailer C, Halpern HJ. The solution conformation of triarylmethyl radicals. J. Magn. Reson. 2005;172(2):254–267. doi: 10.1016/j.jmr.2004.10.010. [DOI] [PubMed] [Google Scholar]
- 7.Yang ZY, Liu YP, Borbat P, et al. Pulsed ESR Dipolar Spectroscopy for Distance Measurements in Immobilized Spin Labeled Proteins in Liquid Solution. J. Am. Chem. Soc. 2012;134(24):9950–9952. doi: 10.1021/ja303791p. [DOI] [PMC free article] [PubMed] [Google Scholar]
- 8.Shevelev GY, Krumkacheva OA, Lomzov AA, et al. Physiological-Temperature Distance Measurement in Nucleic Acid using Triarylmethyl-Based Spin Labels and Pulsed Dipolar EPR Spectroscopy. J. Am. Chem. Soc. 2014;136(28):9874–9877. doi: 10.1021/ja505122n. [DOI] [PubMed] [Google Scholar]
- 9.Jeschke G, Polyhach Y. Distance measurements on spin-labelled biomacromolecules by pulsed electron paramagnetic resonance. Phys. Chem. Chem. Phys. 2007;9(16):1895–1910. doi: 10.1039/b614920k. [DOI] [PubMed] [Google Scholar]
- 10.Saxena S, Freed JH. Theory of double quantum two-dimensional electron spin resonance with application to distance measurements. J. Chem. Phys. 1997;107(5):1317–1340. [Google Scholar]
- 11.Yang ZY, Jimenez-Oses G, Lopez CJ, et al. Long-Range Distance Measurements in Proteins at Physiological Temperatures Using Saturation Recovery EPR Spectroscopy. J. Am. Chem. Soc. 2014;136(43):15356–15365. doi: 10.1021/ja5083206. [DOI] [PMC free article] [PubMed] [Google Scholar]
- 12.Jun S, Becker JS, Yonkunas M, et al. Unfolding of alanine-based peptides using electron spin resonance distance measurements. Biochemistry. 2006;45(38):11666–11673. doi: 10.1021/bi061195b. [DOI] [PubMed] [Google Scholar]
- 13.Razzaghi S, Brooks EK, Bordignon E, et al. EPR Relaxation-Enhancement-Based Distance Measurements on Orthogonally Spin-Labeled T4-Lysozyme. ChemBioChem. 2013;14(14):1883–1890. doi: 10.1002/cbic.201300165. [DOI] [PMC free article] [PubMed] [Google Scholar]
- 14.Jager H, Koch A, Maus V, et al. Relaxation-based distance measurements between a nitroxide and a lanthanide spin label. J. Magn. Reson. 2008;194(2):254–263. doi: 10.1016/j.jmr.2008.07.012. [DOI] [PubMed] [Google Scholar]
- 15.Kulikov A, Likhtenstein G. The use of spin relaxation phenomena in the investigation of the structure of model and biological systems by the method of spin labels. Advances in molecular relaxation and interaction processes. 1977;10(1):47–79. [Google Scholar]
- 16.Lueders P, Jager H, Hemminga MA, et al. Distance Measurements on Orthogonally Spin-Labeled Membrane Spanning WALP23 Polypeptides. J. Phys. Chem. B. 2013;117(7):2061–2068. doi: 10.1021/jp311287t. [DOI] [PubMed] [Google Scholar]
- 17.Yong L, Harbridge J, Quine RW, et al. Electron spin relaxation of triarylmethyl radicals in fluid solution. J. Magn. Reson. 2001;152(1):156–161. doi: 10.1006/jmre.2001.2379. [DOI] [PubMed] [Google Scholar]
- 18.Ghimire H, McCarrick RM, Budil DE, et al. Significantly Improved Sensitivity of Q-Band PELDOR/DEER Experiments Relative to X-Band Is Observed in Measuring the Intercoil Distance of a Leucine Zipper Motif Peptide (GCN4-LZ). Biochemistry. 2009;48(25):5782–5784. doi: 10.1021/bi900781u. [DOI] [PMC free article] [PubMed] [Google Scholar]
- 19.Polyhach Y, Bordignon E, Tschaggelar R, et al. High sensitivity and versatility of the DEER experiment on nitroxide radical pairs at Q-band frequencies. Phys. Chem. Chem. Phys. 2012;14(30):10762–10773. doi: 10.1039/c2cp41520h. [DOI] [PubMed] [Google Scholar]
- 20.Rogozhnikova OY, Vasiliev VG, Troitskaya TI, et al. Generation of Trityl Radicals by Nucleophilic Quenching of Tris(2,3,5,6-tetrathiaaryl)methyl Cations and Practical and Convenient Large-Scale Synthesis of Persistent Tris(4-carboxy-2,3,5,6-tetrathiaaryl)methyl Radical. Eur. J. Org. Chem. 2013;2013(16):3347–3355. doi: 10.1002/ejoc.201300176. [DOI] [PMC free article] [PubMed] [Google Scholar]
- 21.Tormyshev VM, Genaev AM, Sal'nikov GE, et al. Triarylmethanols with Bulky Aryl Groups and the NOESY/EXSY Experimental Observation of a Two-Ring-Flip Mechanism for the Helicity Reversal of Molecular Propellers. Eur. J. Org. Chem. 2012;(3):623–629. doi: 10.1002/ejoc.201101243. [DOI] [PMC free article] [PubMed] [Google Scholar]
- 22.Fielding AJ, Carl PJ, Eaton GR, et al. Multifrequency EPR of four triarylmethyl radicals. Appl. Magn. Reson. 2005;28(3-4):231–238. [Google Scholar]
- 23.Stoll S, Schweiger A. EasySpin, a comprehensive software package for spectral simulation and analysis in EPR. J. Magn. Reson. 2006;178(1):42–55. doi: 10.1016/j.jmr.2005.08.013. [DOI] [PubMed] [Google Scholar]
- 24.Driesschaert B, Robiette R, Le Duff CS, et al. Configurationally Stable Tris(tetrathioaryl)methyl Molecular Propellers. Eur. J. Org. Chem. 2012;(33):6517–6525. [Google Scholar]
- 25.Driesschaert B, Robiette R, Lucaccioni F, et al. Chiral properties of tetrathiatriarylmethyl spin probes. Chem. Commun. (Cambridge, U. K.) 2011;47(16):4793–4795. doi: 10.1039/c1cc10988j. [DOI] [PubMed] [Google Scholar]
- 26.Lide D, Haynes W. CRC handbook of chemistry and physics. CRC Press; Boca Raton: 2009. [Google Scholar]
- 27.Carrington A, McLachlan AD. In Introduction to magnetic resonance. Harper and Row; New York: 1967. [Google Scholar]
Associated Data
This section collects any data citations, data availability statements, or supplementary materials included in this article.


