

Abstract
Background & Aims
Previous cross-sectional studies have shown that serum keratin 18 (K18) fragment levels predict liver histology in individuals with nonalcoholic fatty liver disease (NAFLD). We conducted a study to examine the relationship between changes in serum K18 levels and changes in liver histology in both adults and children with NAFLD.
Methods
Serum K18 levels were measured at baseline and at various time points in 231 adults and 152 children with NAFLD who participated in two randomized controlled trials. Liver biopsies from baseline and week 96 were reviewed centrally.
Results
There was greater decrease in serum K18 levels in adults with histological improvement at week 96 than those without histological improvement at week 16 (-193 ± 293 vs -139 ± 467 U/L, p<0.001), week 48 (-232 ± 360 vs -113 ± 425 U/L, p<0.001), and week 96 (-269 ± 368 vs -97 ± 400 U/L, p<0.001). There was greater decrease in serum K18 levels in children with histological improvement than those without histological improvement at week 48 (-197 ± 467 vs.-47 ± 350 U/L, p=0.005) and week 96 (-206 ± 432 vs. -2 ± 474 U/L, p<0.001). However, decrease in serum K18 was not better than decrease in ALT in identifying histological improvement in adults (AUROC, 0.71 [0.63, 0.80] vs 0.68 [0.61, 0.79], p=0.34) or children (0.72 [0.63-0.81] vs. 0.79 [0.70-0.87], p=0.42).
Conclusion
Decrease in serum K18 levels is strongly associated with improvement in liver histology in adults or children with NAFLD. However, K18 decrease did not perform better than ALT improvement in identifying histological changes in NAFLD.
Keywords: Serum K18, noninvasive biomarker, non-alcoholic steatohepatitis, PIVENS, TONIC
Introduction
Nonalcoholic fatty liver disease (NAFLD) is highly prevalent in the Western world and is rapidly evolving into a global problem due to the ongoing epidemic of obesity.1-6 Histologically, it is characterized by a spectrum ranging from fatty liver (NAFL), a relatively benign condition, to nonalcoholic steatohepatitis (NASH). The latter condition may progress to cirrhosis, liver failure or hepatocellular cancer.7-9 Currently, NASH is a histological diagnosis and requires a liver biopsy for the initial characterization and subsequent disease monitoring.10, 11 Currently, liver histologic evaluation is the primary end point for therapeutic trials, and in fact, the American Association for the Study of Liver Disease (AASLD) recommends liver histology as the primary end point for phase 2b and phase 3 clinical trials.11 Although liver biopsy is a routinely performed procedure, it is invasive, expensive, and associated with rare complications. Therefore, there is intense interest to identify noninvasive methods to predict liver histology in individuals with NAFLD.
Several previous studies have shown that NASH is associated with increased apoptosis.12-14 The cytoskeletal system of the hepatocytes contains intermediate filament proteins primarily made up of the keratins, K8 (previously called CK8) and K18 (previously called CK18) which are important for the integrity and mechanical stability of the hepatocytes.15 Induction of apoptosis in liver disease results in early cleavage of K18 by caspases. These fragments are stable to proteolysis and are released into the circulation after the hepatocyte plasma membrane disrupts during the later stages of the apoptotic process. Several studies have reported that caspase-cleaved K18 fragment levels are significantly higher in serum or plasma of individuals with NASH, and correlate with steatosis, lobular inflammation and ballooning.16-19 Therefore, serum or plasma K18 fragment levels offer great potential as a noninvasive indicator of liver histology in individuals with NAFLD. An earlier cross-sectional study by the NASH Clinical Research Network (NASH CRN) showed that plasma K18 fragment levels independently predicted NASH in adults with well-characterized NAFLD (area under the receiver operator curve, AUROC, 0.83; 95% CI: 0.75-0.91).20 A recent meta-analysis of several published cross-sectional studies revealed a pooled AUROC of 0.82 (0.78-0.88), median sensitivity of 78% and median specificity of 87% for K18 fragment levels to predict NASH in adults with NAFLD.21 However, a recent study consisting of 424 overweight/obese middle aged individuals with (n=300) and without NAFLD (n=124) showed plasma K18 has a high specificity for NAFLD (83%) and fibrosis (85%) but not for NASH (68%), and more importantly, its sensitivity was modest for NAFLD (63%), NASH (58%) and fibrosis (54%).22 In a multicenter study of 201 children and adults with biopsy-proven NAFLD, plasma K18 levels were an excellent predictor of NASH with an AUROC of 0.93 (95% CI: 0.90 – 0.97).16
While many studies were conducted to examine the cross-sectional relationship between serum or plasma K18 levels and liver histology in individuals with NAFLD, there is limited data in terms of their value in monitoring changes in liver histology. Therefore, we conducted a study to examine the relationship between longitudinal changes in serum K18 levels and changes in liver histology in adults and children with well-characterized NAFLD who participated in recently published PIVENS and TONIC clinical trials.
Patients and Methods
The PIVENS and the TONIC clinical trials were conducted by the NASH CRN and their study design and results have been published previously.23-26 Briefly, the PIVENS evaluated the efficacy of daily pioglitazone (30mg) or vitamin E (800 IU), vs. placebo in 247 non-diabetic, adult patients with histologically defined NASH.25 Its primary end point was overall improvement in liver histology at week 96 compared to baseline.25 The TONIC trial evaluated vitamin E (800 IU/day), metformin (1000 mg/day) or placebo for 96 weeks in a total of 173 patients (aged 8-17 years) with biopsy-confirmed NAFLD.26 While sustained reduction in serum alanine aminotransferase (ALT) was the primary end point, overall improvement in liver histology at week 96 as compared to baseline was an important secondary end point that demonstrated improvement with vitamin E.26 All participants provided an informed consent prior to their participation in these clinical trials which allowed for subsequent ancillary studies on archived biosamples.
For both studies, baseline and 96-week liver biopsy specimens were formalin-fixed, paraffin-embedded, and unstained slides were cut from tissue blocks and sent to the NASH CRN repository for preparation by a central laboratory and review by the NASH CRN Pathology Committee (10 hepatopathologists blinded to all clinical and group assignment data). Liver histology was scored according to the previously published NASH CRN histological scoring system.27 In these studies, the overall improvement in liver histology was defined as a ≥ 1 point improvement in the hepatocellular ballooning score; no increase in the fibrosis score; and either a decrease in the NAFLD activity score (NAS) to a score ≤ 3 or a decrease in the NAS of ≤ 2 points, with at least a 1-point decrease in either the lobular inflammation or steatosis score.25
Serum samples used in the current study were aliquots (0.5mL) from the original samples where blood from fasting subjects was collected into serum-separator tubes, allowed to clot for at least 30 minutes at room temperature, and centrifuged at 1,800×g for 15 minutes at 4°C. Aliquots of serum were immediately frozen at -70°C. Processing was completed within 2 hours, and samples were free of hemolysis. The serum caspase-cleaved K18 fragment levels were determined using the M30-Apoptosense ELISA, per the manufacturer's instructions (Peviva AB, Bromma, Sweden). The absorbance was determined at 450nm with the Vmax Kinetic Microplate reader by Molecular Devices M2 (Sunnyvale, CA). The standard curve and K18 values were determined using the Soft-max Pro software accompanying the microplate reader. For the remainder of the manuscript, serum K18 fragment levels are referred to as serum K18 levels.
Statistical Analysis
In separate analyses for adults with NASH (PIVENS trial) and children with NAFLD (TONIC trial), we compared trends in K18 from baseline through the period of treatment subdivided in three classifications: 1.) treatment group (placebo, vitamin E, and pioglitazone in the adult patients and placebo, vitamin E, and metformin in the children); 2.) patients with and without histological improvement; and 3.) patients whose NASH did or did not improve after 96 weeks of treatment. We calculated means, standard deviations, and 95% confidence limits for K18 levels and changes from baseline K18 levels at baseline and at 16 (for adults) or 24 (for children), 48, 72, and 96 weeks of treatment. P values (2 sided) for the differences in the K18 time trends by treatment group, histological improvement, and NASH resolution were derived from three separate multiple linear regression models for K18 change during treatment in relation to independent variables as follows: baseline K18 level, indicator variables for the classification group of interest, spline-type indicator variables for each time period, and interaction terms to allow the between group differences to vary with time; these regression models also included the use of generalized estimating equations (GEE) with robust variance estimation to account for within-patient correlations in repeated K18 measures. The resulting P values were derived from an F-test of the hypothesis that the time trends were equal across groups and time, i.e; the classification group term and all of the interaction terms were zero. The primary aim of the paper was to evaluate K18, separately for adults and children, as a biomarker for histological improvement and resolution of NASH over a 96 week period of treatment. We did this in three ways: 1.) multiple logistic regression models to derive the probability of overall histological improvement (and separately for specific components of improvement) and the probability of NASH resolution after 96 weeks as a function of changes in K18 after 96 weeks of treatment, controlling for baseline K18 levels and treatment group (specific to either the PIVENS or TONIC trials); 2.) comparison of the classification performance of K18 alone against ALT alone, and with the combination of the K18 and ALT with respect to discriminating power between histological improvement vs. not improved and NASH resolution vs. not resolved in both adults and children using cross-validated (jackknifed) areas-under the receiver-operating characteristic (AUROC) and P-values for differences in AUROC for K18 vs. ALT and for K18+ALT vs. ALT alone models28; 3.) Secondary comparisons of the sensitivity, specificity, negative predictive value (NPV), and positive predictive value (PPV) were also made. The Stata 12 software (StatCorp) and SAS version 9.3 (SAS Institute Inc) were used for the statistical analyses. P values of 0.05 or less were pre-specified as statistically significant; since these analyses involve both primary and secondary comparisons of many models, it was not feasible to use methods for correcting P values for multiplicity of comparison due to loss of statistical power. Where applicable, Spearman's rank correlation coefficient was used to estimate the correlations between serum K18 or ALT. K18 means (SD) were compared for baseline and end of trial histology features, separately for adults and children, and P values were derived from linear regression of the rank of the K18 value on the histological feature.
Results
Study Population
Out of 243 adult patients with NASH who participated in the PIVENS trial, 231 serum samples from baseline, 186 samples from week 16, 189 samples from week 48 and 184 samples from week 96 were available for the current study. Out of 173 children and adolescents who participated in the TONIC trial, 152 serum samples from baseline, 125 samples from week 24, 128 samples from week 48 and 136 samples from week 96 were available for the current study.
Longitudinal Changes in serum K18 levels
PIVENS Trial
At baseline, serum K18 levels among the 3 treatment groups were similar (placebo: 440 ± 350 U/L, vitamin E: 510 ± 350 U/L, and pioglitazone: 490 ± 410 U/L, p=0.50). Compared to placebo, serum K18 levels among individuals treated with vitamin E were reduced at week 16 (mean change from baseline -160 ± 300 vs. -50 ± 380 U/L, p=0.10), week 48 (-220 ± 390 vs. -10 ± 370 U/L, p=0.049), and week 96 (-200 ± 400 vs. 30 ± 400 U/L, p< 0.001) (Fig 1A). Similarly, compared to placebo, serum K18 levels among individuals treated with pioglitazone were reduced at week 16 (mean change from baseline -240 ± 390 vs. -50 ± 380 U/L, p=0.006), week 48 (-180 ± 370 vs. -10 ± 370 U/L, p = 0.003, and week 96 (-260 ± 400 vs. 30 ± 400 U/L, p<0.001) (Fig 1A).
Figure 1. Changes in serum K18 levels in the PIVENS trial.
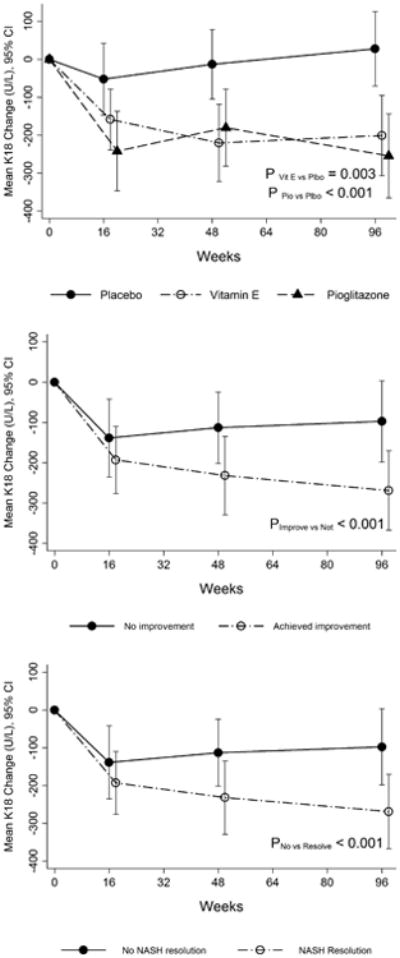
Panel A: Changes in serum K18 levels in three treatment groups (placebo, pioglitazone and vitamin E) during the PIVENS trial.
Panel B: Changes in serum K18 levels in adults who achieved histological improvement as compared to those who did not achieve histological improvement in the PIVENS trial. Histological improvement was defined based on specified change in NAS and no progression of fibrosis as described in the text.
Panel C: Changes in serum K18 levels in adults with and without resolution of NASH in the PIVENS trial.
In a separate analysis, serum K18 levels were compared between adults with overall histological improvement (n=71) and without such histological improvement (n=113), irrespective of the treatment group. At baseline, mean serum K18 levels in the responder and non-responder groups were similar (478 ± 342 vs. 553 ± 342 U/L, p= 0.20). During the treatment period, compared to non-responders, individuals with overall histological improvement had a significantly greater decrease at week 16 (mean change from baseline -193 ± 293 vs. -139 ± 467 U/L, p<0.001), week 48 (-232 ± 360 vs. -113 ± 425 U/L, P<0.001), and week 96 (-269 ± 368 vs. -97 ± 400 U/L, P<0.001) (Fig 1B).
TONIC Trial
Serum K18 levels were similar among three groups at baseline (placebo: 456 ± 365 U/L, vitamin E: 474 ± 358 U/L and metformin: 495 ± 482 U/L, p=0.88). They decreased from baseline at weeks 48 and 96 with both vitamin E and metformin treatment; however, change in K18 at all visits was not statistically significantly associated with either treatment (Fig 2A). Compared to children without an overall histological improvement, those with overall histological improvement had a greater mean decrease in serum K18 levels at week 24 (-140 ± 376 vs. -19 ± 387 U/L, p= 0.02), week 48 (-197 ± 467 vs. -47 ± 350 U/L, p=0.005) and week 96 (-206 ± 432 vs. -2 ± 474 U/L, p<0.001) (Fig 2B).
Figure 2. Changes serum K18 fragment levels during the TONIC trial.
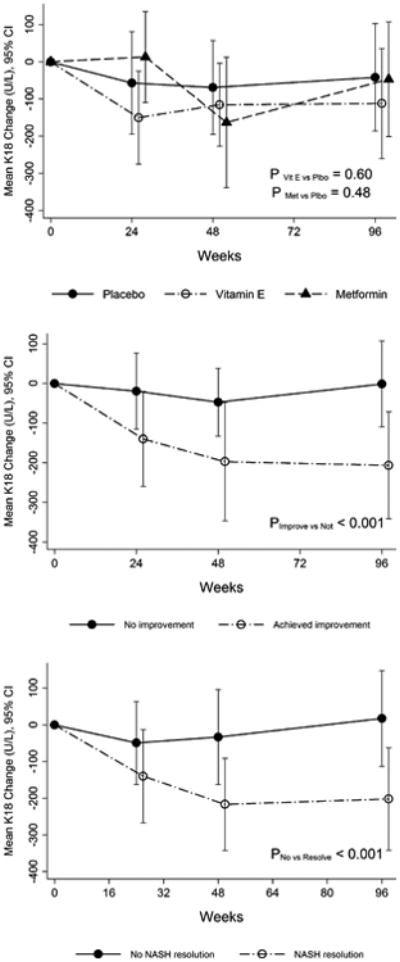
Panel A: Changes in serum K18 levels in three treatment groups (placebo, metformin and vitamin E) during the TONIC trial.
Panel B: Changes in serum K18 levels in adults who achieved histological improvement as compared to those who did not achieve histological improvement in the TONIC trial. Histological improvement was defined based on change in NAS and no progression of fibrosis as described in the text.
Panel C: Changes in serum K18 levels in adults with and without resolution of NASH in the TONIC trial.
Relationship between change in serum K18 and changes in other histological features
In adult participants of the PIVENS trial, there was a significant relationship between decrease in serum K18 levels and resolution of NASH and improvement in steatosis, inflammation, ballooning and NAS. Table 1 shows the relative odds of overall histological improvement, resolution of NASH and ≥ 1 point improvement in other histological parameters for every 50 U/L, 150 U/L, and 250 U/L decrease in serum K18 levels over 96 weeks. In general, there was a step-wise increase in the strength of relationship between improvement in all histological parameters (except for lobular inflammation or fibrosis) and the extent of decrease in serum K18 level (Table 1). For example, odds ratios for the relationship between overall improvement in histology and 50U/L, 150 U/L, and 250 U/L decrease in serum K18 levels were 1.18, 1.63, and 2.67 respectively. There was a statistically significant association between decrease in serum K18 levels and changes in fibrosis stage at p=0.05 (Table 1).
Table 1. Association between change in serum K18 and change in liver histology in adults who participated in the PIVENS trial.
| Histological Change over 96 weeks | Relative Odds (95% CI) of improved histology per decrease in K18 over 96 weeks (N=174)* | ||||
|---|---|---|---|---|---|
| 50 U/L decrease | 150 U/L decrease | 250 U/L decrease | P‡ | AUROC§ (95% CI) | |
| Overall histological improvement† | 1.18 (1.08, 1.29) | 1.63 (1.24, 2.14) | 2.67 (1.44, 3.57) | <0.001 | 0.71 (0.63, 0.80) |
| Resolution of NASH | 1.14 (1.05, 1.25) | 1.50 (1.16, 1.94) | 1.97 (1.280, 3.02) | 0.002 | 0.64 (0.56, 0.73) |
| ≥ 1 point improvement: | |||||
| Steatosis grade | 1.20 (1.11, 1.30) | 1.73 (1.35, 2.21) | 2.49 (1.65, 3.76) | <0.001 | 0.74 (0.67, 0.81) |
| Lobular inflammation | 1.04 (0.98, 1.11) | 1.13 (0.95, 1.36) | 1.23 (0.92, 1.67) | 0.17 | 0.62 (0.53, 0.70) |
| Hepatocellular ballooning | 1.16 (1.08, 1.26) | 1.57 (1.32, 2.10) | 2.13 (1.44, 3.16) | <0.001 | 0.67 (0.58, 0.75) |
| NAFLD activity score | 1.18 (1.10, 1.28) | 1.66 (1.20, 1.64) | 2.33 (1.58, 3.44) | <0.001 | 0.76 (0.69, 0.83) |
| Fibrosis stage | 1.07 (1.00, 1.15) | 1.22 (1.00, 1.50) | 1.41 (1.00, 1.97) | 0.05 | 0.53 (0.45, 0.62) |
Patients with paired K18 scores (baseline and 96 weeks) and paired histology were included in analyses. Number in analyses=174 participants; for histological improvement model, number=141.
Overall histological improvement response defined as 1 or more points in the ballooning score; no increase in the fibrosis score; and either a decrease in the NAS to a score of 3 points or less, or a decrease in the NAS of at least 2 points, with a 1 point decrease in either the lobular inflammation or the steatosis score.
P determined from logistic regression of change in histological feature on change in K18 as a continuous variable after controlling for baseline K18 level and the treatment group.
Cross-validated area under the receiver operating characteristic (AUROC) curves using a jackknife procedure were used.
In children and adolescents who participated in the TONIC trial, there was a significant relationship between decrease in serum K18 levels and resolution of NASH and improvement in steatosis, inflammation, ballooning, fibrosis stage and NAS (Table 2). Table 2 shows the relative odds of overall histological improvement, resolution of NASH and ≥ 1 point improvement in other histological parameters for every 50 U/L, 150 U/L, and 250 U/L decrease in serum K18 levels over 96 weeks. In general, there was a step-wise increase in the strength of relationship between improvement in all histological parameters and the level of decrease in serum K18 level (Table 2). For example, odds ratios for the relationship between overall improvement in histology and 50U/L, 150 U/L, and 250 U/L decrease in serum K18 levels were 1.27, 2.07, and 3.35 respectively. Decreases in serum K18 levels were significantly associated with improvement in fibrosis stage as well (p=0.02) (Table 2).
Table 2. Association between change in serum K18 and change in liver histology in children who participated in the TONIC trial.
| Histological Change over 96 weeks | Relative Odds (95% CI) of improved histology per decrease in K18 over 96 weeks (N=120)* | ||||
|---|---|---|---|---|---|
| 50 U/L decrease | 150 U/L decrease | 250 U/L decrease | P‡ | AUROC§ (95% CI) | |
| Overall histological improvement† | 1.27 (1.12, 1.45) | 2.07 (1.41, 3.03) | 3.35 (1.78, 6.33) | <0.001 | 0.72 (0.63, 0.81) |
| Resolution of NASH | 1.17 (1.06, 1.29) | 1.59 (1.18, 2.14) | 2.16 (1.31, 3.56) | 0.003 | 0.69 (0.58, 0.79) |
| ≥ 1 point improvement: | |||||
| Steatosis grade | 1.13 (1.05, 1.22) | 1.44 (1.16, 1.80) | 1.85 (1.285, 2.66) | 0.001 | 0.64 (0.54, 0.74) |
| Lobular inflammation | 1.09 (1.02, 1.16) | 1.28 (1.06, 1.56) | 1.52 (1.10, 2.10) | 0.01 | 0.57 (0.46, 0.67) |
| Hepatocellular ballooning | 1.09 (1.01, 1.17) | 1.29 (1.04, 1.60) | 1.53 (1.07, 2.19) | 0.02 | 0.64 (0.54, 0.74) |
| NAFLD activity score | 1.24 (1.13, 1.36) | 1.89 (1.43, 2.49) | 2.89 (1.82, 4.59) | <0.001 | 0.742 (0.64, 0.84) |
| Fibrosis stage | 1.09 (1.02, 1.17) | 1.30 (1.05, 1.61) | 1.55 (1.09, 2.21) | 0.02 | 0.52 (0.42, 0.63) |
Patients with paired K-18 scores (baseline and 96 weeks) and paired histology were included in analyses. Number in analyses=120 participants; for NASH resolution models, number=99.
Overall histological improvement response defined as a decrease in the NAS of at least 2 points and no increase in the fibrosis score
P-value was determined from logistic regression of change in histological feature on change in K18 as a continuous variable after controlling for baseline K18 level and the treatment group.
Cross-validated area under the receiver operating characteristic (AUROC) curves using a jackknife procedure were used.
Supplemental Tables 1 and 2 show sensitivity, specificity, positive predictive value and negative predictive values for various arbitrary thresholds for both overall histological improvement and resolution of NASH in PIVENS and TONIC clinical trials, respectively. For example, in the PIVENS trial, 50 U/L decrease in serum K18 levels had 71% sensitivity and 49% specificity in predicting overall histological improvement whereas 250 U/L decrease had 55% specificity and 57% specificity. A decrease in serum K18 level by 250 U/L had 44% sensitivity and 71% specificity for children in the TONIC trial.
Relationship between change in ALT levels with serum K18 fragment levels and histological outcomes
Serum K18 and ALT levels correlated strongly at baseline (r=0.51, p<0.001) and at week 96 (r=0.54, p<0.001) in adult participants of the PIVENS trial, and similarly, change from baseline at 96 weeks in serum K18 also strongly correlated with changes in ALT (r=0.63, p<0.001). The relative odds of overall histological improvement and resolution of NASH with every 10 U/L decrease in ALT levels over 96 weeks were 1.31 (95% CI: 1.11, 1.53, p=0.001) and 1.26 (95% CI: 1.08, 1.47, p=0.003), respectively.
Both cross-sectional and longitudinal correlations between serum K18 and ALT level were statistically significant in pediatric participants of the TONIC trial. The correlation between serum K18 and ALT level at baseline was r=0.70 (p<0.001) and at 96 weeks was r= 0.72 (p<0.001). Similarly in the TONIC trial, there was a strong correlation between change in ALT and change in serum K18 levels between baseline and week 96 (r=0.75, p<0.001). The relative odds of overall histological improvement and resolution of NASH with every 10 U/L decrease in ALT levels over 96 weeks were 1.28 (95% CI: 1.14, 1.42, p<0.001) and 1.37 (95% CI: 1.19, 1.58, p<0.001), respectively.
Comparison of associations of change in K18 and change in ALT with change in liver histology
Table 3 shows comparisons among change in K18, change in ALT and their combination as discriminators of changes in liver histology in the PIVENS trial. Compared to change in ALT, either change in serum K18 or their combination did not have significantly higher AUROCs for discriminating overall histological improvement, resolution of NASH, or ≥ 1 point decrease in steatosis, lobular inflammation, hepatocyte ballooning, or fibrosis stage (Table 3). Table 4 shows comparisons among change in K18, change in ALT and their combination as predictors of changes in liver histology in the TONIC trial. While the AUROCs for change in K18, change in ALT, or their combination to discriminate the overall histological improvement were not significantly different, change in ALT was significantly better than change in K18 to discriminate resolution of NASH (AUROC 0.84 (95% CI: 0.76-0.93) vs. 0.69 (95% CI: 0.58-0.79), p=0.005) (Table 4). However, compared to change in ALT, either change in serum K18 or their combination did not have significantly higher AUROCs for discriminating ≥ 1 point decrease in steatosis, lobular inflammation, hepatocyte ballooning, or fibrosis stage in the TONIC trial (Table 4).
Table 3. Comparison between changes in serum K18 and serum ALT in identifying changes in liver histology in adult participants of the PIVENS trial.
| AUROC (95% C.I.) | P-value‡ | ||||
|---|---|---|---|---|---|
| Histological Change over 96 weeks | Change in K18 | Change in ALT | Changes in K18 + ALT | K18 vs ALT | K18+ ALT vs ALT |
| Overall histological improvement† | 0.71 (0.63, 0.80) | 0.68 (0.59, 0.76) | 0.70 (0.61, 0.79) | 0.34 | 0.18 |
| Resolution of NASH | 0.64 (0.56, 0.73) | 0.67 (0.59, 0.75) | 0.68 (0.59, 0.76) | 0.66 | 0.39 |
| ≥ 1 point improvement: | |||||
| Steatosis grade | 0.74 (0.67, 0.81) | 0.76 (0.69, 0.84) | 0.77 (0.70, 0.84) | 0.55 | 0.38 |
| Lobular inflammation | 0.62 (0.53, 0.70) | 0.65 (0.56, 0.73) | 0.64 (0.56, 0.73) | 0.39 | 0.33 |
| Hepatocellular ballooning | 0.67 (0.58, 0.75) | 0.60 (0.51, 0.69) | 0.65 (0.57, 0.73) | 0.13 | 0.12 |
| NAFLD activity score | 0.76 (0.69, 0.83) | 0.76 (0.69, 0.86) | 0.77 (0.70, 0.84) | 0.65 | 0.50 |
| Fibrosis stage | 0.53 (0.45, 0.62) | 0.61 (0.52, 0.70) | 0.57 (0.49, 0.66) | 0.25 | 0.58 |
Participants with paired K18 scores (baseline and 96 weeks), paired ALT measures and paired histology were included in analyses (N=174).
Overall histological improvement response defined as 1 or more points in the ballooning score; no increase in the fibrosis score; and either a decrease in the NAS to a score of 3 points or less, or a decrease in the NAS of at least 2 points, with a 1 point decrease in either the lobular inflammation or the steatosis score.
Cross-validated (jackknifed) areas-under the receiver-operating characteristic (AUROC) and P-values for differences in AUROC for K18 vs. ALT and for K18+ALT vs. ALT alone models are presented.
Table 4. Comparison between changes in serum K18 and serum ALT in identifying changes in liver histology in pediatric participants of the TONIC trial.
| AUROC (95% C.I.) | P-value‡ | ||||
|---|---|---|---|---|---|
| Histological Change over 96 weeks | Change in K18 | Change in ALT | Changes in K18 + ALT | K18 vs ALT | K18+ ALT vs ALT |
| Overall histological improvement† | 0.72 (0.63, 0.81) | 0.79 (0.70, 0.87) | 0.79 (0.71, 0.87) | 0.42 | 0.08 |
| Resolution of NASH | 0.69 (0.58, 0.79) | 0.84 (0.76, 0.93) | 0.83 (0.75, 0.92) | 0.005 | 0.92 |
| Improvement of at least 1 point: | |||||
| Steatosis grade | 0.64 (0.54, 0.74) | 0.72 (0.63, 0.81) | 0.71 (0.61, 0.80) | 0.18 | 0.71 |
| Lobular inflammation | 0.57 (0.46, 0.67) | 0.58 (0.48, 0.69) | 0.55 (0.44, 0.66) | 0.98 | 0.57 |
| Hepatocellular ballooning | 0.64 (0.54, 0.74) | 0.68 (0.59, 0.78) | 0.66 (0.56, 0.76) | 0.50 | 0.68 |
| NAFLD activity score | 0.74 (0.64, 0.84) | 0.81 (0.73, 0.89) | 0.80 (0.72, 0.89) | 0.28 | 0.20 |
| Fibrosis stage | 0.52 (0.42, 0.62) | 0.54 (0.43, 0.64) | 0.50 (0.39, 0.60) | 0.60 | 0.84 |
Participants with paired K-18 scores (baseline and 96 weeks), paired ALT measures and paired histology were included in analyses (N=117).
Overall histological improvement response defined as no increase in the fibrosis score; and a decrease in the NAS of at least 2 points.
Cross-validated (jackknifed) areas-under the receiver-operating characteristic (AUROC) and P-values for differences in AUROC for K18 vs. ALT and for K18+ALT vs. ALT alone models are presented.
Relationship between early decrease in serum K18 and histological change at week 96
Using multiple linear regression, log change in serum K18 levels at week 16 (ΔK18 is change in log(K18 (U/L) at week 16) from log(baseline K18 (U/L)) was significantly associated with overall histological improvement (coefficient –0.33 (95% CI -0.59, -0.06), p=0.02) and resolution of NASH at week 96 (coefficient –0.25 (95% CI -0.48, -0.02), p=0.04) among the PIVENS participants,. However, there were no significant associations between ΔK18 at week 16 and change in steatosis, lobular inflammation, ballooning, or NAS. In the TONIC trial, log change in serum K18 levels at week 24 (ΔK18 is change in log(K18 U/L at week 24) from log(baseline)) was significantly associated with resolution of NASH at week 96 (coefficient –0.32 (95% CI -0.60, -0.05), p=0.02), but not with overall histological improvement or change in NAS or its individual components (data not shown).
Cross-sectional relationship between serum K18 levels and liver histology
Table 5 shows the cross-sectional relationship between serum K18 levels and various histological features at baseline and at 96 weeks for both adults and children (Tables 5). In general, there was a stronger relationship between serum K18 levels and various histological variables at 96 weeks, possibly because serum samples for K18 measurement were obtained on the same day or very close to the biopsy date. In the PIVENS trial, the median (IQR) duration between liver biopsy and serum K18 measurement was 49 (23, 95) days at baseline whereas it was only 2 (1, 9) days at week 96. Similarly, in the TONIC trial, the median (IQR) duration between liver biopsy and serum K18 fragment measurement was 29 (14, 58) days at baseline whereas 2 (1, 2) days at week 96.
Table 5. Cross-sectional relationship between serum K18 level and histological features of NAFLD at baseline and end of trial.
| K18 levels at baseline (U/L, mean±SD) | P* | K18 levels at end of trial (U/L, mean±SD) | P* | |
|---|---|---|---|---|
|
| ||||
| PIVENS | ||||
|
| ||||
| Steatosis | ||||
| <33% | 497 ± 403 | 0.86 | 303 ± 270 | <0.001 |
| ≥33% | 467 ± 351 | 464 ± 319 | ||
|
| ||||
| Lobular Inflammation | ||||
| < 2 foci | 395 ± 337 | <0.001 | 310 ± 253 | <0.001 |
| ≥ 2 foci | 529 ± 379 | 533 ± 365 | ||
|
| ||||
| Ballooning | ||||
| None to few | 344 ± 208 | <0.001 | 257 ± 205 | <0.001 |
| Many | 628 ± 447 | 575 ± 342 | ||
|
| ||||
| Fibrosis | ||||
| None | 261 ± 157 | 240 ± 190 | <0.001 | |
| Mild | 461 ± 352 | <0.001 | 383 ± 262 | |
| Moderate | 545 ± 434 | 365 ± 313 | ||
| Bridging/Cirrhosis | 575 ± 367 | 529 ± 389 | ||
|
| ||||
| Steatohepatitis† | ||||
| None | 238 ± 160 | <0.001 | 235 ±173 | <0.001 |
| Borderline | 362 ± 221 | 209 ± 141 | ||
| Definite | 539 ± 397 | 528 ± 340 | ||
|
| ||||
| TONIC | ||||
|
| ||||
| Steatosis | ||||
| <33% | 519 ± 422 | 0.44 | 279± 249 | <0.001 |
| ≥33% | 458 ± 397 | 515 ± 366 | ||
|
| ||||
| Lobular Inflammation | ||||
| < 2 foci | 361 ± 247 | 0.01 | 278± 212 | <0.001 |
| ≥ 2 foci | 570 ± 479 | 649± 397 | ||
|
| ||||
| Ballooning | ||||
| None to few | 452 ± 389 | 0.14 | 317 ± 245 | <0.001 |
| Many | 550 ± 446 | 860± 393 | ||
|
| ||||
| Fibrosis | ||||
| None | 489 ± 391 | 0.14 | 271± 223 | <0.001 |
| Mild | 373 ± 246 | 388± 347 | ||
| Moderate | 458 ± 353 | 595± 400 | ||
| Bridging | 800 ± 668 | 552± 335 | ||
|
| ||||
| Steatohepatitis‡ | <0.001 | |||
| None | 384± 300 | 0.04 | 243± 219 | |
| Borderline | 433± 362 | 341± 241 | ||
| Definite | 557± 472 | 740± 356 | ||
No. of participants: PIVENS (N=231 at baseline, N=182 at 96 weeks); TONIC (N=152 at baseline, N=134 at 96 weeks); P (2-sided) determined from linear regression of the rank of the K18 value on the histological feature
Although all PIVENS participants had steatohepatitis at entry based on local pathologist's assessment, 25 individuals were deemed not to have sufficient evidence of steatohepatitis upon central review.
4 PIVENS and no TONIC participants were diagnosed with cirrhosis at baseline; and 9 PIVENS and no TONIC participants diagnosed with cirrhosis at end of trial (96 weeks).
In adults, at baseline, serum K18 levels were significantly associated with lobular inflammation (p<0.001), hepatocellular ballooning (p<0.001) and fibrosis stage (P<0.001), but not steatosis (p=0.86). At week 96, serum K18 levels were significantly associated with steatosis (p<0.001), lobular inflammation (p<0.001), hepatocellular ballooning (p<0.001), fibrosis stage (P<0.001) and presence of steatohepatitis (p<0.001). Serum K18 levels had significant correlation with NAS with a much stronger relationship at week 96 (r=0.52, p<0.001) than at baseline (r=0.32, p<0.001). In children, serum K18 levels at baseline were significantly associated with lobular inflammation (p<0.001) and steatohepatitis (p=0.04) but not with steatosis (p=0.75). There was a trend towards significance for hepatocellular ballooning (p=0.05) and fibrosis stage (p=0.1). At week 96, serum K18 levels were significantly associated with steatosis (p<0.001), inflammation (p<0.001), hepatocellular ballooning (p<0.001), fibrosis stage (p<0.001) and steatohepatitis (p<0.001). Serum K18 levels had a significant correlation with NAS at week 96 (r=0.62, p<0.001), but not at baseline (r=0.14, p=0.08).
Discussion
The main observations of this study are (a) decreases in serum K18 levels are significantly associated with improvement in liver histology in both adults and children with histologically confirmed NAFLD; (b) changes in serum K18 did not discriminate change in liver histology better than changes in ALT; also, a combination of change in serum K18 and change in ALT did not discriminate change in liver histology better than change in ALT alone; (c) serum K18 levels correlated significantly with serum ALT levels at baseline and at 96 weeks and importantly changes in serum K18 levels correlated significantly with changes in ALT; and (d) serum K18 levels exhibited the strongest cross-sectional relationship with liver histology in both adults and children with NAFLD when the duration between liver biopsy and serum K18 measurement was shorter suggesting that some features of NASH may fluctuate over time periods of months.
There is great need to develop noninvasive tests to predict changes in liver histology in individuals with NAFLD, both for clinical practice and for clinical trials. Serum ALT is commonly used as a surrogate for assessing liver histology in a variety of liver diseases, but its utility in grading and staging liver histology in NAFLD is limited.25, 26 Similarly, improvement in ALT is not a highly accurate predictor of improvement in liver histology either. This unmet need prompted us to investigate the utility of calculating changes in serum K18 levels as a surrogate marker for monitoring liver histology in individuals participating in clinical trials. However, this analysis of sample obtained in two large clinical trials indicates that measuring serum K18 offers no advantage over ALT, either alone or in combination with ALT, and appears to have limited clinical utility as a standalone noninvasive test.
Although there has been much enthusiasm for investigating plasma/serum K18 as a noninvasive biomarker in NAFLD (3 meta-analyses already published),21, 29, 30 there are many important knowledge gaps regarding our understanding of serum/plasma K18 behavior in various physiological and pathological states. For example, scant data exists regarding serum/plasma K18 levels in the control population and thus it is currently not possible to establish a normal range for this analyte. Our review of the literature produced 5 datasets consisting of ∼ 600 person reference population where K18 fragment (M30 antigen) levels were measured by Peviva's M30 Apoptosense ELISA; the median serum/plasma K18 levels ranged between 132-153 U/L with 75th percentile values ranging between 176-190 U/L (Supplemental Table 1).9-11, 22, 31 However, most subjects in these studies are largely Caucasian and their anthropometric and clinical characteristics were not described in detail. Furthermore, other characteristics of circulating K18 (e.g. day-to-day variability, effect of exercise, fasting, meals, inter-current illness, co-morbidities and medications such as statins) have not been investigated.
Some aspects of our study deserve further discussion. By using samples and data from 400 children and adults with well characterized NAFLD whose liver histology at baseline and at 96 weeks was centrally reviewed in a blinded fashion by a group of expert hepatopathologists, this study represents a substantive investigation of longitudinal changes in K18 levels as a surrogate marker for monitoring liver histology in NAFLD. A potential limitation is that our study was conducted on stored biosamples from previously completed clinical trials. The effect of sample storage on K18 levels has not been examined and for this study, the sample collection and storage were conducted in a rigorous fashion according to a pre-established standard operating procedure. In this study, we only measured K18 fragments (M30 antigen) but not total K18 (uncleaved K18, M65 antigen) and thus our study cannot shed light on the utility of changes in total K18 as a surrogate for liver histology monitoring. However, in five cross-sectional studies reported to date with M65 antigen in individuals with NAFLD there is no indication that it is more useful than M30 antigen in predicting NASH.30
In summary, we comprehensively investigated the relationship between changes in serum K18 levels and changes in liver histology in adults and children with well characterized NAFLD who underwent paired liver biopsies at least 96 weeks apart. There was a strong relationship between change in serum K18 levels and important histological outcomes, but their AUROCs were mostly under 0.85 indicating limited clinical utility. Moreover, changes in serum K18 levels did not perform better than changes in ALT in predicting changes in liver histology in NAFLD.
Supplementary Material
Supplemental Table 1: Performance of serum K18 decrease in predicting histological outcomes in adults participating in the PIVENS trial
Supplemental Table 2: Performance of serum K18 decrease in predicting histological outcomes in children participating in the TONIC trial
Supplemental Table 3: Serum/plasma M30 antigen (K18 fragment) levels in reference populations: Literature review
Acknowledgments
Grant Support: Administrative supplements awarded under the American Recovery and Reinvestment Act of 2009 (ARRA) for 3K24DK069290-05S1 to Dr. Chalasani.
Abbreviations
- ALT
Alanine aminotransferase
- AUROC
Area Under the Receiver Operator Characteristic
- K18
Keratin 18
- NAS
NAFLD Activity Score
- NAFLD
Nonalcoholic fatty liver disease
- NASH
Nonalcoholic steatohepatitis
- NASH CRN
Nonalcoholic Steatohepatitis Clinical Research Network
- PIVENS
Pioglitazone versus vitamin E versus placebo for the treatment of non-diabetic patients with non-alcoholic steatohepatitis
- TONIC
Treatment of NAFLD in Children
Footnotes
Disclosures: None relevant for this manuscript.
Writing Assistance: None
Author Contributions: Study concept and design: RV, BN, RL, NC
Acquisition of data: RD, MC, EMB, JS, DEK
Analysis and interpretation of data: KY, RV, NC
Drafting of the manuscript: RV, AJ, NC
Critical revision of the manuscript for important intellectual content: HM, BN, RL, JT, EMB, JS, JM, JL, NCDEK, NC
Statistical analysis: KY, JT
Obtained funding: NC
Administrative, technical, or material support: NC
Study supervision: NC
References
- 1.Vernon G, Baranova A, Younossi ZM. Systematic review: the epidemiology and natural history of non-alcoholic fatty liver disease and non-alcoholic steatohepatitis in adults. Aliment Pharmacol Ther. 2011;34:274–85. doi: 10.1111/j.1365-2036.2011.04724.x. [DOI] [PubMed] [Google Scholar]
- 2.Bellentani S, Scaglioni F, Marino M, et al. Epidemiology of non-alcoholic fatty liver disease. Dig Dis. 2010;28:155–61. doi: 10.1159/000282080. [DOI] [PubMed] [Google Scholar]
- 3.Browning JD, Szczepaniak LS, Dobbins R, et al. Prevalence of hepatic steatosis in an urban population in the United States: impact of ethnicity. Hepatology. 2004;40:1387–95. doi: 10.1002/hep.20466. [DOI] [PubMed] [Google Scholar]
- 4.Gupta R, Bhangoo A, Matthews NA, et al. The prevalence of non-alcoholic fatty liver disease and metabolic syndrome in obese children. J Pediatr Endocrinol Metab. 2011;24:907–11. doi: 10.1515/jpem.2011.282. [DOI] [PubMed] [Google Scholar]
- 5.Szczepaniak LS, Nurenberg P, Leonard D, et al. Magnetic resonance spectroscopy to measure hepatic triglyceride content: prevalence of hepatic steatosis in the general population. Am J Physiol Endocrinol Metab. 2005;288:E462–8. doi: 10.1152/ajpendo.00064.2004. [DOI] [PubMed] [Google Scholar]
- 6.Farrell GC, Wong VW, Chitturi S. NAFLD in Asia--as common and important as in the West. Nat Rev Gastroenterol Hepatol. 2013;10:307–18. doi: 10.1038/nrgastro.2013.34. [DOI] [PubMed] [Google Scholar]
- 7.Chalasani N, Younossi Z, Lavine JE, et al. The diagnosis and management of non-alcoholic fatty liver disease: Practice guideline by the American Association for the Study of Liver Diseases, American College of Gastroenterology, and the American Gastroenterological Association. Am J Gastroenterol. 2012;107:811–26. doi: 10.1038/ajg.2012.128. [DOI] [PubMed] [Google Scholar]
- 8.Matteoni CA, Younossi ZM, Gramlich T, et al. Nonalcoholic fatty liver disease: a spectrum of clinical and pathological severity. Gastroenterology. 1999;116:1413–9. doi: 10.1016/s0016-5085(99)70506-8. [DOI] [PubMed] [Google Scholar]
- 9.Ascha MS, Hanouneh IA, Lopez R, et al. The incidence and risk factors of hepatocellular carcinoma in patients with nonalcoholic steatohepatitis. Hepatology. 2010;51:1972–8. doi: 10.1002/hep.23527. [DOI] [PubMed] [Google Scholar]
- 10.Neuschwander-Tetri BA, Clark JM, Bass NM, et al. Clinical, laboratory and histological associations in adults with nonalcoholic fatty liver disease. Hepatology. 2010;52:913–24. doi: 10.1002/hep.23784. [DOI] [PMC free article] [PubMed] [Google Scholar]
- 11.Sanyal AJ, Brunt EM, Kleiner DE, et al. Endpoints and clinical trial design for nonalcoholic steatohepatitis. Hepatology. 2011;54:344–53. doi: 10.1002/hep.24376. [DOI] [PMC free article] [PubMed] [Google Scholar]
- 12.Canbay A, Friedman S, Gores GJ. Apoptosis: the nexus of liver injury and fibrosis. Hepatology. 2004;39:273–8. doi: 10.1002/hep.20051. [DOI] [PubMed] [Google Scholar]
- 13.Feldstein AE, Canbay A, Angulo P, et al. Hepatocyte apoptosis and fas expression are prominent features of human nonalcoholic steatohepatitis. Gastroenterology. 2003;125:437–43. doi: 10.1016/s0016-5085(03)00907-7. [DOI] [PubMed] [Google Scholar]
- 14.Canbay A, Feldstein AE, Higuchi H, et al. Kupffer cell engulfment of apoptotic bodies stimulates death ligand and cytokine expression. Hepatology. 2003;38:1188–98. doi: 10.1053/jhep.2003.50472. [DOI] [PubMed] [Google Scholar]
- 15.Moll R, Divo M, Langbein L. The human keratins: biology and pathology. Histochem Cell Biol. 2008;129:705–33. doi: 10.1007/s00418-008-0435-6. [DOI] [PMC free article] [PubMed] [Google Scholar]
- 16.Feldstein AE, Alkhouri N, De Vito R, et al. Serum cytokeratin-18 fragment levels are useful biomarkers for nonalcoholic steatohepatitis in children. Am J Gastroenterol. 2013;108:1526–31. doi: 10.1038/ajg.2013.168. [DOI] [PubMed] [Google Scholar]
- 17.Yilmaz Y, Dolar E, Ulukaya E, et al. Elevated serum levels of caspase-cleaved cytokeratin 18 (CK18-Asp396) in patients with nonalcoholic steatohepatitis and chronic hepatitis. C Med Sci Monit. 2009;15:CR189–93. [PubMed] [Google Scholar]
- 18.Tsutsui M, Tanaka N, Kawakubo M, et al. Serum fragmented cytokeratin 18 levels reflect the histologic activity score of nonalcoholic fatty liver disease more accurately than serum alanine aminotransferase levels. J Clin Gastroenterol. 2010;44:440–7. doi: 10.1097/MCG.0b013e3181bdefe2. [DOI] [PubMed] [Google Scholar]
- 19.Shen J, Chan HL, Wong GL, et al. Non-invasive diagnosis of non-alcoholic steatohepatitis by combined serum biomarkers. J Hepatol. 2012;56:1363–70. doi: 10.1016/j.jhep.2011.12.025. [DOI] [PubMed] [Google Scholar]
- 20.Feldstein AE, Wieckowska A, Lopez AR, et al. Cytokeratin-18 fragment levels as noninvasive biomarkers for nonalcoholic steatohepatitis: a multicenter validation study. Hepatology. 2009;50:1072–8. doi: 10.1002/hep.23050. [DOI] [PMC free article] [PubMed] [Google Scholar]
- 21.Musso G, Gambino R, Cassader M, et al. Meta-analysis: natural history of non-alcoholic fatty liver disease (NAFLD) and diagnostic accuracy of non-invasive tests for liver disease severity. Ann Med. 2011;43:617–49. doi: 10.3109/07853890.2010.518623. [DOI] [PubMed] [Google Scholar]
- 22.Cusi K, Chang Z, Harrison S, et al. Limited value of plasma cytokeratin-18 as a biomarker for NASH and fibrosis in patients with non-alcoholic fatty liver disease. J Hepatol. 2014;60:167–74. doi: 10.1016/j.jhep.2013.07.042. [DOI] [PubMed] [Google Scholar]
- 23.Chalasani NP, Sanyal AJ, Kowdley KV, et al. Pioglitazone versus vitamin E versus placebo for the treatment of non-diabetic patients with non-alcoholic steatohepatitis: PIVENS trial design. Contemp Clin Trials. 2009;30:88–96. doi: 10.1016/j.cct.2008.09.003. [DOI] [PMC free article] [PubMed] [Google Scholar]
- 24.Lavine JE, Schwimmer JB, Molleston JP, et al. Treatment of nonalcoholic fatty liver disease in children: TONIC trial design. Contemp Clin Trials. 2010;31:62–70. doi: 10.1016/j.cct.2009.09.001. [DOI] [PMC free article] [PubMed] [Google Scholar]
- 25.Sanyal AJ, Chalasani N, Kowdley KV, et al. Pioglitazone, vitamin E, or placebo for nonalcoholic steatohepatitis. N Engl J Med. 2010;362:1675–85. doi: 10.1056/NEJMoa0907929. [DOI] [PMC free article] [PubMed] [Google Scholar]
- 26.Lavine JE, Schwimmer JB, Van Natta ML, et al. Effect of vitamin E or metformin for treatment of nonalcoholic fatty liver disease in children and adolescents: the TONIC randomized controlled trial. JAMA. 2011;305:1659–68. doi: 10.1001/jama.2011.520. [DOI] [PMC free article] [PubMed] [Google Scholar]
- 27.Kleiner DE, Brunt EM, Van Natta M, et al. Design and validation of a histological scoring system for nonalcoholic fatty liver disease. Hepatology. 2005;41:1313–21. doi: 10.1002/hep.20701. [DOI] [PubMed] [Google Scholar]
- 28.Cui J. Estimating AIDS incidence and jack-knife variance from a continuous delay distribution and incomplete data. Stat Med. 1999;18:527–37. doi: 10.1002/(sici)1097-0258(19990315)18:5<527::aid-sim54>3.0.co;2-l. [DOI] [PubMed] [Google Scholar]
- 29.Chen J, Zhu Y, Zheng Q, et al. Serum cytokeratin-18 in the diagnosis of non-alcoholic steatohepatitis: A meta-analysis. Hepatol Res. 2013 doi: 10.1111/hepr.12197. [DOI] [PubMed] [Google Scholar]
- 30.Kwok R, Tse YK, Wong GL, et al. Systematic review with meta-analysis: non-invasive assessment of non-alcoholic fatty liver disease - the role of transient elastography and plasma cytokeratin-18 fragments. Aliment Pharmacol Ther. 2014;39:254–69. doi: 10.1111/apt.12569. [DOI] [PubMed] [Google Scholar]
- 31.Peviva. M30 Apoptosense ELISA, REF 10010, Instructions for Use Page 12. 2010 [Google Scholar]
- 32.Yagmur E, Trautwein C, Leers MP, et al. Elevated apoptosis-associated cytokeratin 18 fragments (CK18Asp386) in serum of patients with chronic liver diseases indicate hepatic and biliary inflammation. Clin Biochem. 2007;40:651–5. doi: 10.1016/j.clinbiochem.2006.12.010. [DOI] [PubMed] [Google Scholar]
- 33.Deppe RB, Comerford M, Masuoka HC, et al. Serum CK18 but Not HMGB1 Levels Are Elevated in Adults With Primary Sclerosing Cholangitis. Gastroenterology. 2013;144:S967–S967. [Google Scholar]
- 34.Cortez-Pinto Hea. Plasma cytokeratin 18 in a healthy population: How does it correlate with metabolic factors and presence of steatosis. Submitted to EASL 2014. 2014 [Google Scholar]
Associated Data
This section collects any data citations, data availability statements, or supplementary materials included in this article.
Supplementary Materials
Supplemental Table 1: Performance of serum K18 decrease in predicting histological outcomes in adults participating in the PIVENS trial
Supplemental Table 2: Performance of serum K18 decrease in predicting histological outcomes in children participating in the TONIC trial
Supplemental Table 3: Serum/plasma M30 antigen (K18 fragment) levels in reference populations: Literature review