Abstract
The liver is a major organ that controls hepatic and systemic homeostasis. Dysregulation of liver metabolism may cause liver injury. Previous studies have demonstrated that carboxylesterase 1 (CES1) regulates hepatic triglyceride metabolism and protects against liver steatosis. In the present study, we investigated whether CES1 played a role in the development of alcoholic liver disease (ALD) and methionine and choline-deficient (MCD) diet-induced liver injury. Both hepatocyte nuclear factor 4α (HNF4α) and CES1 were markedly reduced in patients with alcoholic steatohepatitis. Alcohol repressed both HNF4α and CES1 expression in primary hepatocytes. HNF4α regulated CES1 expression by directly binding to the proximal promoter of CES1. Global inactivation of CES1 aggravated alcohol- or MCD diet-induced liver inflammation and liver injury, likely as a result of increased production of acetaldehyde and reactive oxygen species and mitochondrial dysfunctions. Knockdown of hepatic CES1 exacerbated ethanol-induced steatohepatitis. These data indicate that CES1 plays a crucial role in protection against alcohol- or MCD diet-induced liver injury.
Alcohol overconsumption may cause alcoholic liver disease (ALD), which encompasses alcoholic fatty liver disease (AFLD), alcoholic hepatitis (AH) and alcoholic cirrhosis. ALD is the major cause of liver disease in Western countries. Liver cirrhosis is the 12th leading cause of death in the US, with a total of 36,427 deaths in 2013, 49.8% of which are related to alcohol1. Abstinence is a common and effective strategy for the treatment of ALD, but sustainable lifestyle changes are difficult for many patients to achieve. Pharmacological treatments, such as the use of alcohol dehydrogenase inhibitors and anti-craving drugs, do not achieve satisfactory results in patients with ALD2.
Significant advances have been made toward understanding the pathogenesis of ALD. Alcohol-induced increases in reactive oxygen species (ROS), lipid peroxidation (LPO), acetaldehyde, fatty acid ethyl ester (FAEE), lipopolysaccharide (LPS) and protein carbonyl, etc. are directly responsible for the development of ALD3,4,5,6,7. In addition, alcohol metabolism causes increased ratio of NADH/NAD+, which in turn suppresses the sirtuin 1 (SIRT1)-AMP-activated protein kinase (AMPK) axis, leading to induction of sterol regulatory element-binding protein 1 (SREBP-1) and lipogenesis and inhibition of fatty acid oxidation (FAO)8,9,10. As a result, alcohol overconsumption results in AFLD and AH.
Hepatic steatosis is an early hallmark of ALD and is a target for managing this disease. Carboxylesterase 1 (CES1) is a drug-metabolizing enzyme that is also capable of hydrolyzing triglycerides (TG) and cholesterol esters (CE)11,12,13. Over-expression of hepatic CES1 reduces TG accumulation through promoting lipolysis and FAO. In contrast, knockdown of hepatic CES1 increases lipid accumulation by inducing lipogenesis11,14,15. So far, the role of CES1 in the development of ALD or liver injury is completely unknown.
Hepatocyte nuclear factor 4α (HNF4α) is a nuclear hormone receptor that is constitutively active and regulates lipid, glucose, bile acid and drug metabolism. Loss of hepatic HNF4α causes fatty liver by inhibiting very low-density lipoprotein (VLDL) secretion16,17. HNF4α expression is markedly reduced in diabetes, obesity, non-alcoholic fatty liver disease (NAFLD) and high fat diet (HFD) feeding, likely resulting from increased free fatty acids (FFA), cholesterol and miR-34a expression. HNF4α controls the basal expression of many genes in the liver, but it is unclear whether HNF4α also regulates CES1 expression.
In the present study, we first investigated hepatic CES1 expression in patients with alcoholic steatohepatitis. We then investigated how alcohol downregulated hepatic CES1 expression and whether CES1 played a role in the development of ALD and non-alcoholic liver injury. Our data show that ethanol reduces hepatic CES1 expression likely through inhibition of HNF4α and that CES1 plays a crucial role in preventing ethanol- or methionine and choline-deficient (MCD) diet-induced liver injury.
Results
Alcohol reduces CES1 and HNF4α expression in patients with alcoholic steatohepatitis and in mice treated with alcohol
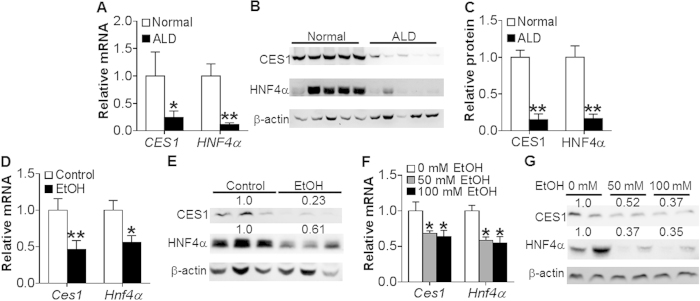
To investigate whether CES1 is associated with the development of ALD, we investigated the expression of CES1 in patients with alcoholic steatohepatitis. Hepatic CES1 mRNA level was reduced by 75% (Fig. 1A) and protein level decreased by ~85% (Fig. 1B,C). Interestingly, the nuclear receptor HNF4α was also markedly repressed by >84% in both mRNA (Fig. 1A) and protein (Fig. 1B,C) levels.
Figure 1. Alcohol inhibits CES1 and HNF4α expression in patients with alcoholic steatohepatitis and in mice.
(A–C) Livers were collected from normal individuals or patients with alcoholic steatohepatitis (n = 7). mRNA levels were determined by qRT-PCR (A). Protein levels were determined by Western blotting (B) and then quantified (C). (D,E) C57BL/6 mice were fed a Lieber-DeCarli diet for 5 days, followed by fed a Lieber-DeCarli diet containing 5% ethanol or pair-fed a control diet for 10 days. On the 16th day, mice were gavaged with a single dose of ethanol (5 g/kg) (n = 8). mRNA levels were then determined by qRT-PCR (D) and protein levels determined by Western blots (E). (F,G) Mouse primary hepatocytes were treated with 0, 50 or 100 mM ethanol for 24 h (n = 3). mRNA (F) and protein (G) levels were determined. *p < 0.05, **p < 0.01. Unpaired Student t-test was used for statistical analysis.
In mice chronically fed a Liber-DeCarli ethanol diet for 10 days plus binge ethanol (5 g/kg)18, hepatic Ces1 and Hnf4α mRNA (Fig. 1D) and protein (Fig. 1E) levels were decreased. Consistent with the in vivo data, ethanol treatment repressed Ces1 and Hnf4α mRNA (Fig. 1F) and protein (Fig. 1G) levels in primary hepatocytes. Thus, the data of Fig. 1 indicate that ethanol inhibits hepatic CES1 and HNF4α expression in both mice and humans.
HNF4α regulates CES1 expression via binding to a DR-1 binding
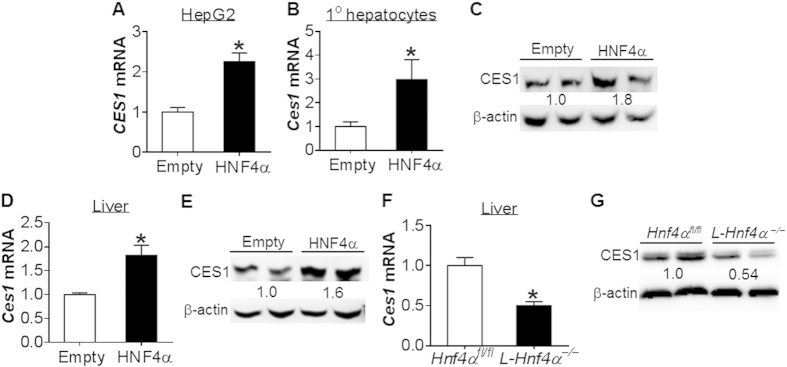
The finding that alcohol inhibits both HNF4α and CES1 expression suggests that HNF4α may regulate CES1 expression. Over-expression of HNF4α induced CES1 mRNA level by 2.3 fold in HepG2 cells (Fig. 2A). HNF4α over-expression also induced Ces1 mRNA (Fig. 2B) and protein (Fig. 2C) levels in mouse primary hepatocytes. In line with the in vitro data, hepatic expression of HNF4α induced Ces1 mRNA (Fig. 2D) and protein (Fig. 2E) levels in mice. In contrast, Ces1 mRNA (Fig. 2F) and protein (Fig. 2G) levels were reduced by ~50% in liver-specific Hnf4α−/− (L-Hnf4α−/−) mice. These data indicate that HNF4α regulates CES1 expression both in vitro and in vivo.
Figure 2. HNF4α regulates CES1 expression.
(A–C) HepG2 cells (A) or mouse primary hepatocytes (B,C) were infected with adenoviruses expressing HNF4α (Ad-HNF4α; HNF4α) or control adenoviruses (Ad-empty; empty) (n = 3). After 48 h, Ces1 mRNA (A,B) and protein (C) levels were determined. (D,E) C57BL/6 mice were injected with Ad-empty or Ad-HNF4α (n = 6). After 7 days, hepatic Ces1 mRNA (D) and protein (E) levels were determined. (F,G) Hepatic Ces1 mRNA (F) and protein (G) levels were determined in Hnf4αfl/fl mice and L-Hnf4α−/−mice (n = 5). *p < 0.05. Unpaired Student t-test was used for statistical analysis.
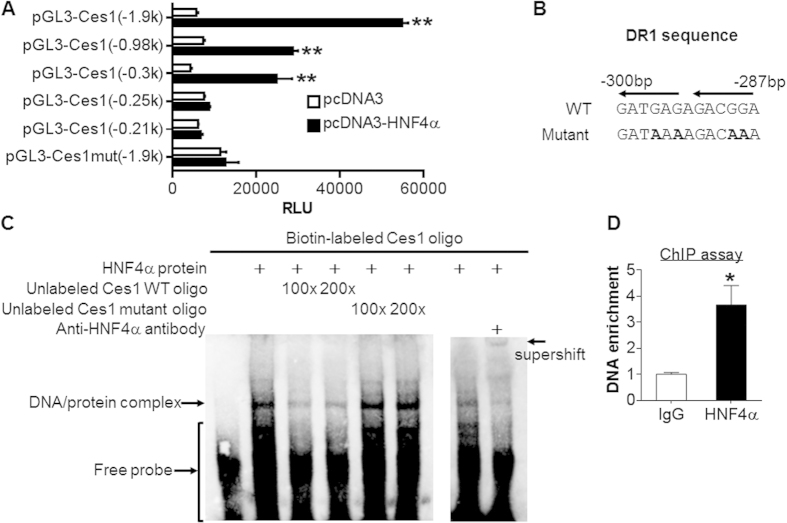
Next, we examined how HNF4α regulates CES1 expression. Promoter-luciferase assays showed that HNF4α induced the luciferase activity by 10 fold, 4 fold and 6 fold in the −1.9 kb, −0.98 kb and −0.3 kb Ces1 promoters, respectively, but not in the −0.25 kb Ces1 promoter (Fig. 3A), suggesting that HNF4α may bind to the response element(s) located between −0.3 kb and −0.25 kb of the Ces1 promoter. Indeed, there was a potential DR-1 element (direct repeat separated by one base pair) between 300 bp and 287 bp upstream of the transcription start site (Fig. 3B). Mutation of the DR-1 element abolished the induction of Ces1 promoter activity by HNF4α (Fig. 3A). Electrophoretic mobility shift assays showed that HNF4α protein bound to the DR-1 element and this binding was inhibited by wild-type but not mutant DR-1 oligonucleotides (Fig. 3C, left panel). In addition, an HNF4α antibody was able to supershift the DNA/protein complex (Fig. 3C, right panel), indicating that HNF4α binds to the DR-1 element in vitro. Finally, chromatin immunoprecipitation assays showed that HNF4α protein bound to the Ces1 promoter containing the DR-1 element in the liver (Fig. 3D). Collectively, the data of Figs 2 and 3 demonstrate that HNF4α regulates Ces1 expression by binding to a DR-1 element located between 300 bp and 287 bp upstream of the transcription start site.
Figure 3. CES1 is a direct target of HNF4α.
(A) Luciferase reporter assays were performed by co-transfecting HepG2 cells with pGL3-Ces1 luciferase-reporter constructs together with pcDNA3 or pcDNA3-HNF4α plasmids (n = 6). After 36 h, luciferase activities were determined and normalized to β-galactosidase activity. (B) Wild-type (WT) or mutant HNF4α response element in the Ces1 gene promoter is shown in the top or bottom, respectively. (C) EMSA assays were performed using in vitro transcribed/translated HNF4α protein. Wild-type and mutant oligonucleotides were used in the competition assays (left panel). Supershift assays were performed in the presence of an HNF4α antibody (right panel). (D) Chromatin immunoprecipitation assays were performed using liver lysates and an HNF4α antibody. *p < 0.05, **p < 0.01. Unpaired Student t-test was used for statistical analysis.
Global inactivation of CES1 aggravates MCD diet-induced liver inflammation
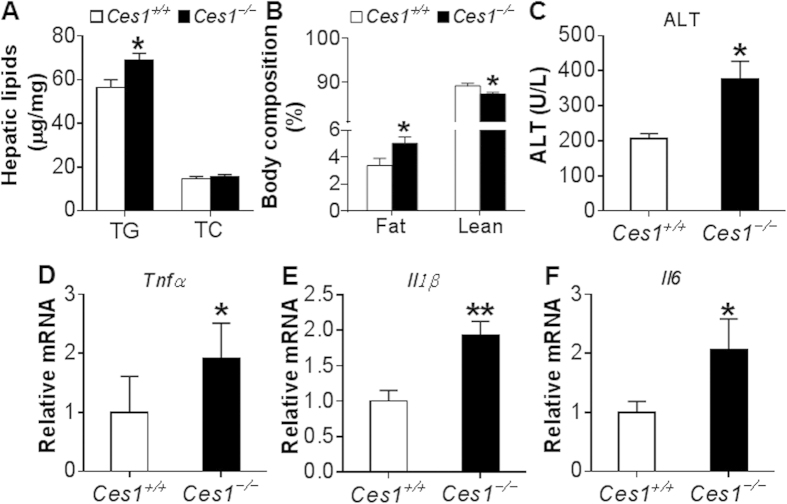
Hepatic CES1 is known to regulate lipid and glucose metabolism11,12,14. However, the role of CES1 in liver inflammation or injury is unknown. We have therefore generated global Ces1−/− mice, which did not express any Ces1 mRNA or protein in the liver or other tissues (see Supplementary Fig. S1). When Ces1+/+ mice and Ces1−/− mice were fed an MCD diet for 4 weeks, there was a 21% increase in hepatic TG level but hepatic cholesterol level was unchanged (Fig. 4A). Ces1−/− mice had more fat accumulation than Ces1+/+ mice (5.03% vs. 3.37%) but reduced lean mass (Fig. 4B). Ces1−/− mice also had increased plasma alanine aminotransferase (ALT) level (Fig. 4C) as well as hepatic mRNA levels of tumor necrosis factor α (Tnfα) (Fig. 4D), interleukin 1β (Il1β) (Fig. 4E), and interleukin 6 (Il6) (Fig. 4F). These data demonstrate that loss of CES1 aggravates MCD diet-induced liver inflammation and liver injury.
Figure 4. Ces1−/− mice are susceptible to MCD diet-induced liver injury.
(A–F) Ces1+/+ mice and Ces1−/− mice were fed an MCD diet for 4 weeks. Hepatic triglycerides (TG) and total cholesterol (TC) (A), body fat composition (B), plasma ALT level (C), as well as hepatic mRNA levels of Tnfα (D), Il1β (E), and Il6 (F) were determined. *p < 0.05, **p < 0.01. Unpaired Student t-test was used for statistical analysis.
Global inactivation of CES1 exacerbates alcohol-induced hepatitis
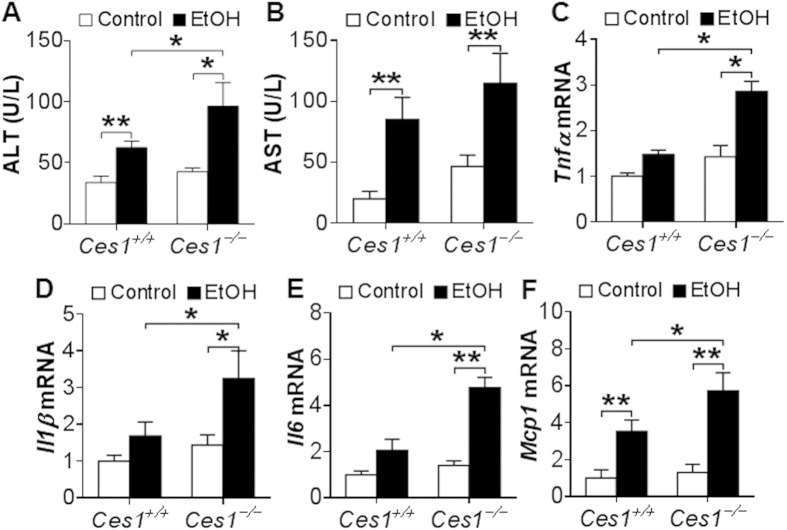
To test whether global inactivation of CES1 affects the development of ALD, Ces1+/+ mice and Ces1−/− mice were fed a Lieber-DeCarbli diet containing 5% ethanol or pair-fed a control diet for 10 days followed by a single gavage of ethanol (3 g/kg) as described18. The chronic binge drinking did not affect their body weight (see Supplementary Fig. S2). Ethanol feeding significantly increased plasma levels of ALT (Fig. 5A), AST (Fig. 5B) and TG (see Supplementary Fig. S2) in both Ces1+/+ mice and Ces1−/− mice, and such increases were further enhanced by Ces1 inactivation (Fig. 5A,B and see Supplementary Fig. S2). In contrast, ethanol-induced increase in hepatic TG levels were comparable between Ces1+/+ mice and Ces1−/− mice (see Supplementary Fig. S2). In addition, ethanol significantly induced hepatic mRNA levels of Tnfα (Fig. 5C), Il1β (Fig. 5D), Il6 (Fig. 5E) and Mcp1 (Fig. 5F) in Ces1−/− mice, and the induction of Tnfα, Il1β and Il6 was not significant in Ces1+/+ mice (Fig. 5C–E). Importantly, Ces1 inactivation significantly potentiated ethanol-induced increase in Tnfα, Il1β, Il6 and Mcp1 mRNA levels in the liver (Fig. 5C–F). Thus, global loss of CES1 aggravates ethanol-induced liver injury.
Figure 5. Ces1−/− mice are susceptible to alcohol-induced liver inflammation.
Ces1+/+ and Ces1−/− mice were fed a Lieber-DeCarli control liquid diet for 5 days, followed by fed a Lieber-DeCarli ethanol diet or pair-fed a control diet for 10 days. On the 16th day, a single dose of ethanol (3 g/kg) or isocaloric maltose dextrin was administered. Plasma levels of ALT (A) and AST (B) as well as hepatic mRNA levels of Tnfα (C), Il1β (D), Il6 (E) and Mcp-1 (F) were determined. *p < 0.05, **p < 0.01. Unpaired Student t-test was used for statistical analysis.
Global inactivation of CES1 aggravates ethanol-induced acetaldehyde and oxidative stress production and mitochondrial dysfunction
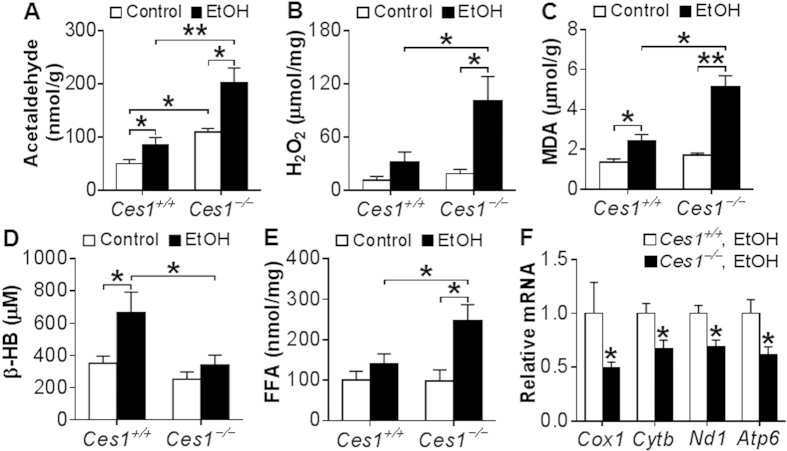
To understand how CES1 inactivation aggravates ethanol-induced liver injury, we first measured acetaldehyde level in the liver. Acetaldehyde is a reactive compound that is highly toxic to hepatocytes because it can sensitize cells to oxidative stress or other damaging signals, ultimately leading to mitochondrial damage and cell death2,19. At the basal level, hepatic acetaldehyde level was increased by 2.2 fold in Ces1−/− mice in comparison to Ces1+/+ mice (Fig. 6A). Upon ethanol feeding, hepatic acetaldehyde level was increased by 1.7 fold in Ces1+/+ mice and 2 fold in Ces1−/− mice (Fig. 6A). Hepatic acetaldehyde level in ethanol-fed Ces1−/− mice was 2.4 fold higher than in ethanol-fed Ces1+/+ mice (Fig. 6A). Consistent with these observations, the mRNA level of acetaldehyde dehydrogenase 2 (Aldh2) was reduced by 50% in Ces1−/− mice (p < 0.05; data not shown).
Figure 6. Ces1−/− mice have increased hepatic acetaldehyde level, oxidative stress and mitochondrial dysfunction upon alcohol feeding.
Ces1+/+ and Ces1−/− mice were subjected to alcohol feeding as described in the legend of Fig. 5. Hepatic acetaldehyde levels were analyzed using HPLC (A). Mitochondrial hydrogen peroxide (H2O2) levels were analyzed using Amplex Red reagent/horseradish peroxidase, and fluorescent activities were determined (B). Hepatic level of MDA (C) and plasma levels of β-HB (D) and FFA (E) were determined. Hepatic mRNA levels of mitochondrial genes were quantified (F). *p < 0.05, **p < 0.01. Unpaired Student t-test was used for statistical analysis.
Oxidative stress is an important contributor to the pathogenesis of ALD. Mitochondrial reactive oxygen species (ROS) triggers pro-inflammatory cytokine production, damages mitochondrial DNA and promotes lipid peroxidation20,21,22. We therefore examined whether the aggravated liver inflammation in Ces1−/− mice was associated with increased ROS. Indeed, upon alcohol feeding hepatic levels of hydrogen peroxide (H2O2) (Fig. 6B) and malondialdehyde (MDA) (Fig. 6C) in Ces1−/− mice were increased by 5.5 fold and 3 fold, respectively, whereas these increases were less pronounced in Ces1+/+ mice (Fig. 6B,C). In addition, hepatic H2O2 and MDA levels were increased by 3 fold and 2 fold, respectively, in ethanol-fed Ces1−/− mice than in ethanol-fed Ces1+/+ mice (Fig. 6B,C), indicating that CES1 is critical for preventing ethanol-induced oxidative stress.
Ethanol feeding significantly increases acetate level and therefore enhances the synthesis of acetyl-CoA and β-hydroxybutyrate (β-HB). On the other hand, elevated mitochondrial FAO is also accompanied by increased β-HB synthesis. As such, plasma β-HB level may reflect mitochondrial functions under normal conditions. As shown in Fig. 6D, ethanol significantly increased plasma β-HB level in Ces1+/+ mice but not in Ces1−/− mice. In contrast, ethanol induced a 2.5-fold increase in hepatic FFA level in Ces1−/− mice but not in Ces1+/+ mice (Fig. 6E). The increase in hepatic FFA level was not accompanied by any change in genes involved in fatty acid synthesis (Srebp1c, Fas, Acc1, Acc2), transport (CD36, Fabp1) or oxidation (Pparα, Cpt1α, Mcad, Acox1, and Acox2) (see Supplementary Fig. S2). These data suggest that Ces1−/− mice may have an impaired mitochondrial function.
Increased acetaldehyde and ROS production is a crucial promoter of mitochondrial DNA mutation, degradation and mitochondrial dysfunction20,21,22,23. We then tested mRNA levels of genes encoding mitochondrial enzymes. Ces1−/− mice had a significant reduction in mRNA levels of cytochrome oxidase subunit I (Cox1), cytochrome b (Cytb), NADH dehydrogenase subunit 1 (Nd1) and ATP synthase F0 subunit 6 (Atp6) (Fig. 6F). Together, the data of Fig. 6 demonstrate that global deletion of CES1 aggravates alcohol-induced acetaldehyde and ROS production and mitochondrial dysfunction.
Hepatic CES1 deficiency exacerbates alcohol-induced liver steatosis
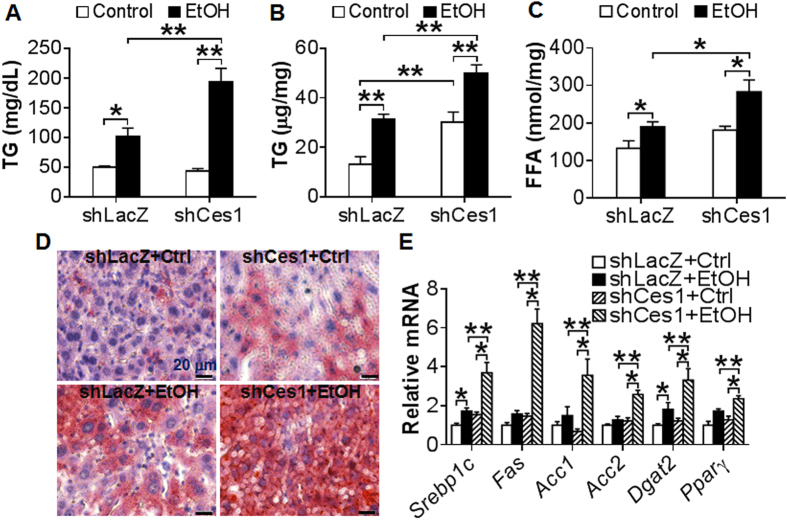
In addition to the liver, CES1 is also expressed in other tissues, such as intestine, adipose tissue and macrophages. We therefore investigated whether the aggravated liver injury observed in global Ces1−/− mice was due to inactivation of hepatic Ces1. Consistent with a role in TG hydrolysis, over-expression of Ces1 prevented alcohol-induced TG accumulation in AML12 cells (see Supplementary Fig. S3), a murine hepatocyte cell line. We then fed C57BL/6 mice a Lieber-DeCarli control diet for 5 days. On day 6, the mice were fed either a Lieber-DeCarli control diet or 5% ethanol diet and also injected i.v. with adenoviruses expressing Ces1 shRNA (Ad-shCes1) or LacZ shRNA (Ad-shLacZ; control) as described12. On day 16, the mice were gavaged with a single dosage of ethanol (5 g/kg). Mice infected with Ad-shCes1 had a ~97% reduction in hepatic Ces1 mRNA level (See Supplementary Fig. S4A). Body weight and food intake were comparable between the two genotypes (see Supplementary Fig. S4B and S4C). Alcohol treatment led to increased plasma and hepatic levels of TG in both the Ces1-deficient mice and control mice (Fig. 7A,B). In addition, alcohol-fed Ces1-deficient mice had ~2 fold increase in plasma or hepatic TG levels than alcohol-fed control mice (Fig. 7A,B). Similar results were observed for hepatic FFAs (Fig. 7C). In contrast, there was no change in hepatic cholesterol levels among the different groups (see Supplementary Fig. S4D). Oil red O staining of liver sections also confirmed hepatic TG accumulation (Fig. 7D). Consistent with the change in hepatic TG levels, knockdown of Ces1 in ethanol-fed mice markedly increased mRNA levels of lipogenic genes, including Srebp-1, Fas, Acc1, Acc2, diacylglycerol O-acyltransferase 2 (Dgat2) and peroxisome proliferator-activated receptor γ (Pparγ) (Fig. 7E). Thus, the data of Fig. 7 indicate that hepatic CES1 deficiency aggravates ethanol-induced liver steatosis via inducing lipogenic genes.
Figure 7. Hepatic CES1 deficiency exacerbates alcohol-induced liver steatosis.
(A–E) C57BL/6J mice were fed a Lieber-DeCarli control liquid diet for 5 days. On the 6th day, mice were injected i.v. with Ad-shLacZ or Ad-shCes1 and then fed either a Lieber-DeCarli ethanol diet or pair-fed a Lieber-DeCarli control diet for 10 days. On the 16th day, mice were gavaged with a single dose of ethanol (5 g/kg) or isocaloric maltose dextrin. Plasma TG (A), hepatic TG (B) and hepatic FFA (C) levels were determined. Representative oil red O stainings were shown (D). Hepatic mRNA levels of lipogenic genes were quantified (E). *p < 0.05, **p < 0.01. Unpaired Student t-test was used for statistical analysis.
Hepatic CES1 deficiency exacerbates alcohol-induced hepatitis
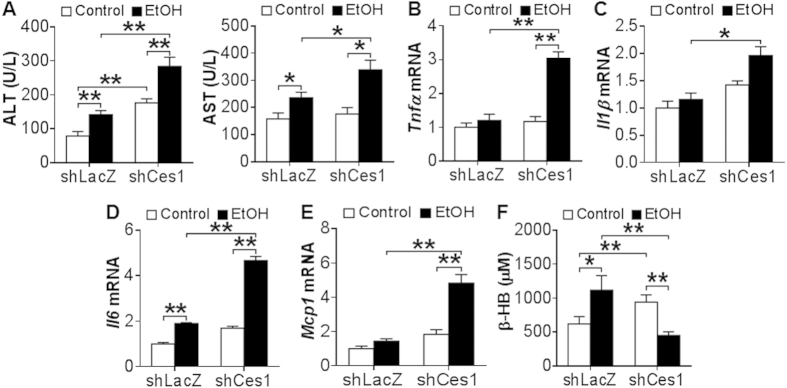
Next, we determined whether hepatic CES1 deficiency affected liver injury. Ethanol induced plasma ALT (Fig. 8A) and AST (Fig. 8B) levels in both the control mice and Ces1-deficient mice. Hepatic Ces1 deficiency further increased plasma ALT and AST levels (Fig. 8A,B). In addition, ethanol significantly induced hepatic mRNA levels of Tnfα (Fig. 8C), Il1β (Fig. 8D), Il6 (Fig. 8E) and Mcp1 (Fig. 8F) in Ces1-deficient mice but not in the control mice except for Il6. Furthermore, hepatic Tnfα, Il1β, Il6 and Mcp1 mRNA levels were increased by >2 fold in ethanol-fed Ces1-deficient mice than in ethanol-fed control mice (Fig. 8C–F). Finally, ethanol increased plasma β-HB levels in the control mice but reduced plasma β-HB levels in the Ces1-deficient mice (Fig. 8G), suggesting that hepatic CES1 deficiency may cause mitochondrial dysfunction. Collectively, the data of Figs 7 and 8 demonstrate that hepatic CES1 deficiency is sufficient to aggravate alcohol-induced steatohepatitis.
Figure 8. Hepatic CES1 deficiency exacerbates alcohol-induced liver inflammation.
(A–F) Mice were subjected to alcohol feeding as described in the legend of Fig. 7. Plasma levels of ALT (A) and AST (B) as well as hepatic mRNA levels of Tnfα (C), Il1β (D), Il6 (E) and Mcp-1 (F) were determined. Plasma β-HB level was quantified (G). *p < 0.05, **p < 0.01. Unpaired Student t-test was used for statistical analysis.
Discussion
CES1 is a drug-metabolizing enzyme. Its role in liver inflammation or liver injury has not been investigated previously. In the current study, we demonstrate that CES1 protects liver from alcohol- or MCD diet-induced liver inflammation or liver injury. Importantly, we also show that hepatic CES1 is markedly reduced in patients with alcoholic steatohepatitis. Mechanistically, our data suggest that ethanol inhibits CES1 expression likely through reducing HNF4α expression. Thus, the present study suggests that the HNF4α-CES1 pathway may play an important role in the protection against the development of ALD.
CES1 has the ability to hydrolyze amide or ester bonds24. Our previous studies show that TG is a substrate for CES112. Defective TG hydrolase activity is responsible for elevated TG accumulation in the liver of Ces1-deficient mice. Ethanol is unlikely to be a direct substrate of CES1. However, the metabolites of CES1 may affect alcohol metabolism and mitochondrial functions. When CES1 is deficient, the change in the levels of metabolite(s) and/or substrate(s) of CES1 may cause accumulation of toxic substances, such as acetaldehyde and ROS. These toxic substances are sufficient to cause damages on mitochondria and cell membranes, eventually resulting in liver inflammation and damage. One of our future directions will be to determine which metabolite(s) and substrate(s) cause an increase in these toxic substances. In agreement with our hypothesis, ALDH2 is inhibited in Ces1−/−mice. A previous report shows that HNF4α also controls ALDH2 transcription25, supporting our current finding that the HNF4α-CES1 pathway regulates the development of ALD.
HNF4α is known to control the basal expression of a variety of genes associated with lipid, glucose, bile acid and drug metabolism, differentiation and morphogenesis26. The current study identifies CES1, a TG hydrolase in the liver12, as a direct target gene of HNF4α, suggesting that HNF4α may also regulate lipolysis. Under the conditions of common metabolic stress (diabetes, obesity and NAFLD, HFD feeding), elevated FFAs, cholesterol, p53 and miR-34a orchestrate to inhibit HNF4α expression27. In addition, alcoholism leads to hypozincemia28 and zinc deprivation suppresses the DNA-binding activity of HNF4α in HepG2 cells29. Thus, ethanol treatment inhibits HNF4α expression and DNA binding activity, likely through inducing lipogenesis and FFA levels and reduced zinc level. It is also possible that other unknown mechanism(s) are involved in inhibiting HNF4α expression.
An unexpected finding in this study is that liver-specific knockdown, but not global inactivation, of CES1 aggravates ethanol-induced liver steatosis. Loss of hepatic CES1 is known to induce lipogenesis and liver steatosis12. In addition to the liver, CES1 is also expressed in the intestine, in which CES1 is reported to regulate chylomicron production30. We speculate that loss of intestinal CES1 may affect alcohol metabolism and fat absorption, thus resulting in unchanged hepatic TG levels in Ces1−/− mice.
Global or liver-specific loss of CES1 causes liver inflammation in the presence or absence of alcohol feeding, underscoring the importance of CES1 in controlling inflammatory response. CES1 deficiency causes elevated levels of acetaldehyde, H2O2, MDA and FFAs as well as mitochondrial dysfunctions, which are known to contribute to liver inflammation and liver damage. Hepatic FAEE, which is known to cause cytotoxicity, is increased upon alcohol feeding31. CES1 is shown to play a role in FAEE metabolism32,33. Thus, we cannot rule out that FAEE also plays a role in liver damage in Ces1−/− mice.
Our recent data show that CES2 is also regulated by HNF4α34. CES2 prevents liver steatosis by regulating lipolysis, ER stress and lipogenesis34. Similarly, CES1 prevents lipolysis by modulating lipolysis and lipogenesis12. These functional similarities between CES1 and CES2 likely result from their triglyceride hydrolase activity. In addition to HNF4α, CES1 is also induced by glucose14 and farnesoid X receptor12, but repressed during fasting14 and alcohol. In contrast, CES2 is repressed in db/db mice, high fat diet-fed mice and patients with non-alcoholic steatohepatitis. Therefore, the regulation of CES1 and CES2 is largely different. It is unclear whether CES2 also plays a role in ALD.
In summary, the current study demonstrates that CES1 protects liver from ethanol- or MCD diet-induced liver inflammation and damage. The impaired HNF4α-CES1 pathway may contribute to the pathogenesis of ALD. Targeting hepatic CES1 may represent a novel strategy for prevention and treatment of ALD and non-alcoholic liver injury.
Methods
Mice, diets and human ALD samples
Liver-specific Hnf4α−/− mice were generated by crossing Hnf4αfl/fl mice with albumin-Cre mice (all from the Jackson Laboratory. Bar Harbor, ME). Ces1−/− mice were generated by replacing exon 1 with an ACN-LacZ cassette as described33. Detailed characterization of the Ces1−/− mice will be reported elsewhere. Ces1−/− mice were backcrossed with C57BL/6 mice for at least 6 generations prior to experimentation. MCD diets were purchased from Harlan Laboratories (Cat # TD.90262; Madison, WI). Lieber-DeCarli diets were purchased from Bio-Serv (Flemington, NJ). Human liver samples with alcoholic steatohepatitis (with fibrosis) were obtained from the Liver Tissue Cell Distribution System at University of Minnesota. All the animal experiments were approved by the Institutional Animal Care and Use Committee at Northeast Ohio Medical University (NEOMED). The use of human tissue samples was approved by the Institutional Review Board at NEOMED. All the experiments were performed in accordance with the relevant guidelines and regulations.
Chronic plus binge alcohol drinking
C57BL/6J mice (12 weeks old) were administered a Lieber-DeCarli control liquid diet (Cat # F1259SP, BioServ) for 5 days. On the 6th day, mice were fed a Lieber-DeCarli liquid diet (Cat # F1258SP, BioServ) containing 5% (vol/vol) ethanol or pair-fed a Lieber-DeCarli control liquid diet for 10 days18. On the 16th day, mice were gavaged with a single dose of ethanol (3 or 5 g/kg body weight) or isocaloric maltose dextrin. For some studies, on the 6th day mice were also injected i.v. with either Ad-shLacZ or Ad-shCes1. These adenoviruses have been described previously12.
RNA isolation and quantitative real-time PCR
Total RNA was isolated using TRIzol Reagent (Life Technologies, NY). mRNA levels were determined by quantitative reverse-transcription polymerase chain reaction (qRT-PCR) on a 7500 real-time PCR machine from Applied Biosystems (Foster City, CA). Relative mRNA levels were calculated using the comparative cycle threshold (Ct) method and were normalized to the values of 36B4 mRNA levels.
Western blotting
Tissues were homogenized in ice-cold modified RIPA buffer and protein concentrations were determined using a Pierce BCA Protein Assay Kit (Thermo Scientific, IL). Antibodies against mouse CES1, HNF4α and β-actin were purchased from Abcam (ab45957, Cambridge, MA), Santa Cruz Biotechnology (sc6556, Santa Cruz, CA) and Novus Biologicals (NB600-501, Littleton, CO), respectively.
Transient transfection and mutagenesis assays
Ces1 promoter regions (−1.9 kb, −0.98 kb, −0.3 kb, −0.25 kb or −0.21 kb to +87 bp) were cloned to the pGL3-basic plasmid (Promega, Madison, WI). The mutant pGL3 promoter-luciferase construct [pGL3-Ces1mut(−1.9 k)] was generated using a QuickChange Site-directed Mutagenesis kit from Agilent (Santa Clara, CA). Transient transfection assay was performed as described35. pGL3-Ces1 luciferase-reporter constructs were transfected into HepG2 cells using Lipofetamine 3000 (Invitrogen, CA) along with either pcDNA3 or pcDNA3-HNF4α plasmids. After 36 h, luciferase activities were determined and normalized to β-galactosidase activity.
Chromatin immunoprecipitation (ChIP) assay
ChIP assay was performed using HNF4α antibody following the manufacturer’s instructions (Cat # 17-295, Millipore, MA) as described17. qRT-PCR was performed to determine the DNA enrichment. The primer sequences were CAGAACACTGAGGTTTGAATTCC (forward) and TCACACCGACCTAGAGTTTAAAC (reverse), which amplified a fragment between −250 bp and −300 bp in the Ces1 gene promoter.
Electrophoretic mobility shift assay (EMSA)
HNF4α protein was generated using a TNT T7 Quick Coupled Transcription/Translation Reactions kit (Cat # L1170, Promega) and pcDNA3-HNF4α plasmid. Oligonucleotides were labeled by biotin on the 3′ end following the manufacturer’s instruction (Cat # 89818, Thermo Fisher Scientific). EMSA was performed using a kit according to the manufacturer’s instructions (Cat # 20148, Thermo Fisher Scientific). The wild-type oligonucleotide sequences used for EMSA were CCCTGTCTGAAGGCCTG CTGTGCTACTCTCTGCCTTTGGGAGGCCGACAG-3′ (top strand) and 5′-CTGTCGGCCTCCCAAAGGCAGAGAGTAGCACAGCAGGCCTTCAGACAGGG-3′ (bottom strand). The mutant oligonucleotide sequences were 5′-CCCTGTCTGAAGGCCTGCTGTGTTACTTTTTGTTTTTGGGAGGCCGACAG-3′ (top strand) and 5′-CTGTCGGCCTCCCAAAAACAAAAAGTAACACAGCAGGCC TCCAGACAGGG-3′ (bottom strand).
Primary hepatocyte isolation
Mouse primary hepatocytes were isolated as described36,37. Mice were anaesthetized by intraperitoneal injection of 50 mg/kg pentobarbital. The portal vein was cannulated with a 23-gauge plastic cannula. Mouse livers were perfused with Hank’s Balanced Salt Solution (HBSS, Cat # 14170-112, Thermo Fisher Scientific) containing 0.19 g/L EDTA. Simultaneously, the inferior vena cava was cut open. Subsequently, livers were perfused with HBSS, calcium, magnesium buffer (Cat # 14025092, Thermo Fisher Scientific) with 0.8 mg/mL Collagenase from Clostridium histolyticum type IV (Sigma, St. Louis, MO). Primary hepatocytes were released and collected in a 50 mL centrifuge tube. After centrifugation at 50 × g for 5 minutes and washing with DMEM, cells were cultured in DMEM/10%FBS (Atlanta Biologicals, Georgia, USA) in 6-well plates pre-coated with 0.1% gelatin (Sigma-Aldrich).
Measurement of hepatic acetaldehyde level using high performance liquid chromatography (HPLC)
Hepatic acetaldehyde level was determined using derivatization with DNPH, followed by HPLC separation as described previously38. 100 mg liver tissue was homogenized in 3 M perchloric acid (Fisher Scientific). The pH of the solution was adjusted immediately to 4.0 using 2 volumes 3 M sodium acetate buffer (pH 9.0) (Fisher Scientific). After centrifugation at 12000 rpm at 4 oC for 20 minutes, the supernatant was transferred into an ice-cold tube, followed by addition of 80-fold molar excess 2,4-dinitrophenylhydrazine (DNPH, Cat # 119266, Sigma-Aldrich) in 6 N HCl. The mixture was then placed on a shaker for 1 h at room temperature. Derivatization was stopped with 3 volumes of 3M sodium acetate buffer (pH 9.0). Two volumes of acetonitrile (Sigma-Aldrich) were added to extract AcH-DNP. After centrifugation at 10000 × g for 5 minutes at 4 oC, the organic phase was condensed to 50 μL. The ultra high performance liquid chromatograph (UHPLC) machine was purchased from Shimadzu Corp. (Columbia, MD). A Restek C18 HPLC column (25 cm × 4.6 mm i.d. 5 μm) coupled with an Ultra C18 guard column (10 mm × 4 mm i.d.) were purchased from Fisher Scientific (Pittsburgh, PA). The elution program was described previously38. An AcH-DNP standard (Sigma-Aldrich, St.Louis. MO) was used to create a standard curve. The values of the area under the curve of the AcH-DNP peaks were determined to calculate the concentration of acetaldehyde in each sample.
Malondialdehyde (MDA) assay
MDA assay was performed as described35. Buffer I was made by dissolving 2-Thiobarbituric acid (Sigma-Aldrich) in 10% perchloric acid to a final concentration 0.67%. Assay buffer was made by adding 20% trichloroacetic acid to buffer I (2:3,v/v). 1,1,3,3,-tetraethoxypropane (Sigma-Aldrich) was used as a standard. 30 mg liver tissue was homogenized in 500 μL saline. After centrifugation, 100 μL supernatant was collected and added to 1 ml assay buffer. The reaction mixture was incubated at 95 °C for 30 min, cooled down and centrifuged at 3000 rpm for 10 min. The absorbance was measured at OD532 nm.
Mitochondrial H2O2 assay
Approximately 50 mg of liver tissue was homogenized in 1 ml of homogenization buffer containing 25 mM Hepes pH7.4, 1 mM EDTA, 0.25 M sucrose, 2 mM MgCl2, 1 μM butylated hydroxytoluene (BHT), 1:200 dilution of Sigma P8340 and 1 μM diethylenetriaminepentaacetic acid (Sigma-Aldrich). The homogenates were centrifuged at 500 × g for 5 min to pellet nuclei and debri. The resultant supernatant was centrifuged at 10,000 × g for 10 min at 4 °C to obtain mitochondria. The pellets were resuspended in 150 μl homogenization buffer. About 20 μL solution was saved for measuring protein concentration.
Mitochondrial H2O2 was detected using Amplex Red assay as described39. The working solution was prepared using 100 μL of 10 mM Amplex Red reagent (Thermo Fisher Scientific), 2 μL of 1000 U/ml horseradish peroxidase (HRP) and 10 ml of 50 mM potassium phosphate (pH7.7) with 0.5 mM diethylenetriaminepentaacetic acid (Sigma-Aldrich). 50 μL of sample or standard was pipetted into 96 plates, followed by addition of 50 μl of the Amplex Red reagent/HPR working solution. The reaction mixture was protected from light and incubated at room temperature for 30 min. The fluorescence was measured with excitation in the range of 530–560 nm and emission at 590 nm. Mitochondrial H2O2 levels were normalized to protein levels.
Lipid and body fat analysis
Plasma triglycerides and cholesterol were measured using Infinity reagents from Thermo Scientific (Waltham, MA). Plasma and hepatic free fatty acids were measured using a kit from Wako Diagnostics (Richmond, VA). To measure lipids in liver, approximately 100 mg liver tissue was homogenized in methanol and extracted in chloroform/methanol (2:1 v/v). Hepatic triglyceride and cholesterol levels were then quantified. Body fat content was determined by EchoMRI (Houston, TX).
Plasma alanine aminotransferase (ALT) and aspartate aminotransferase (AST) analysis
Plasma ALT and AST levels were determined using Infinity reagents (Middletown, VA) following the manufacture’s instructions.
Statistical Analysis
The data were analyzed using unpaired Student t test and ANOVA (GraphPad Prisim, CA). All values were expressed as mean ± SEM. Differences were considered statistically significant at P < 0.05.
Additional Information
How to cite this article: Xu, J. et al. Carboxylesterase 1 Is Regulated by Hepatocyte Nuclear Factor 4a and Protects Against Alcohol- and MCD diet-induced Liver Injury. Sci. Rep. 6, 24277; doi: 10.1038/srep24277 (2016).
Supplementary Material
Acknowledgments
This work was supported by NIH grants R01HL103227, R01DK095895 and R01DK102619 to Y. Zhang, R01AA013623 and R01AA015951 to M. You. Normal or pathologic human liver tissues were obtained through the Liver Tissue Cell Distribution System, Minneapolis, Minnesota, which was funded by NIH Contract # HHSN276201200017C.
Footnotes
Author Contributions J.X., Y.X., Y.L., K.J., M.Y., L.Y. and Y.Z. performed the study. J.X. and Y.Z. analyzed the data. J.X., L.Y. and Y.Z. designed the study and wrote the manuscript.
References
- Starr S. P. & Raines D. Cirrhosis: diagnosis, management, and prevention. Am Fam Physician 84, 1353–1359 (2011). [PubMed] [Google Scholar]
- Gao B. & Bataller R. Alcoholic Liver Disease: Pathogenesis and New Therapeutic Targets. Gastroenterology 141, 1572–1585, 10.1053/j.gastro.2011.09.002 (2011). [DOI] [PMC free article] [PubMed] [Google Scholar]
- Shen Z. et al. Role of SIRT1 in regulation of LPS- or two ethanol metabolites-induced TNF-alpha production in cultured macrophage cell lines. Am J Physiol-Gastr L 296, G1047–G1053, 10.1152/ajpgi.00016.2009 (2009). [DOI] [PMC free article] [PubMed] [Google Scholar]
- Wang H. J., Gao B., Zakhari S. & Nagy L. E. Inflammation in Alcoholic Liver Disease. Annu Rev Nutr, Vol 32 32, 343–368, 10.1146/annurev-nutr-072610-145138 (2012). [DOI] [PMC free article] [PubMed] [Google Scholar]
- Lee J. Y., Sohn K. H., Rhee S. H. & Hwang D. Saturated fatty acids, but not unsaturated fatty acids, induce the expression of cyclooxygenase-2 mediated through Toll-like receptor 4. J Biol Chem 276, 16683–16689, 10.1074/jbc.M011695200 (2001). [DOI] [PubMed] [Google Scholar]
- Lakshminarayanan V., Beno D. W. & Costa R. H. & Roebuck, K. A. Differential regulation of interleukin-8 and intercellular adhesion molecule-1 by H2O2 and tumor necrosis factor-alpha in endothelial and epithelial cells. J Biol Chem 272, 32910–32918, 10.1074/jbc.272.52.32910 (1997). [DOI] [PubMed] [Google Scholar]
- Hritz I. et al. The critical role of Toll-like receptor (TLR) 4 in alcoholic liver disease is independent of the common TLR adapter MyD88. Hepatology 48, 1224–1231, 10.1002/Hep.22470 (2008). [DOI] [PMC free article] [PubMed] [Google Scholar]
- Shen Z., Liang X., Rogers C. Q., Rideout D. & You M. Involvement of adiponectin-SIRT1-AMPK signaling in the protective action of rosiglitazone against alcoholic fatty liver in mice. Am J Physiol Gastrointest Liver Physiol 298, G364–374, 10.1152/ajpgi.00456.2009 (2010). [DOI] [PMC free article] [PubMed] [Google Scholar]
- Canto C. et al. AMPK regulates energy expenditure by modulating NAD(+) metabolism and SIRT1 activity. Nature 458, 1056–1060, 10.1038/Nature07813 (2009). [DOI] [PMC free article] [PubMed] [Google Scholar]
- Canto C. & Auwerx J. PGC-1 alpha, SIRT1 and AMPK, an energy sensing network that controls energy expenditure. Curr Opin Lipidol 20, 98–105, 10.1097/Mol.0b013e328328d0a4 (2009). [DOI] [PMC free article] [PubMed] [Google Scholar]
- Quiroga A. D. et al. Deficiency of carboxylesterase 1/esterase-x results in obesity, hepatic steatosis, and hyperlipidemia. Hepatology 56, 2188–2198, 10.1002/hep.25961 (2012). [DOI] [PubMed] [Google Scholar]
- Xu J. et al. Hepatic carboxylesterase 1 is essential for both normal and farnesoid X-receptor-controlled lipid homeostasis. Hepatology 59, 1761–1771, 10.1002/hep.26714 (2014). [DOI] [PMC free article] [PubMed] [Google Scholar]
- Ghosh S. St Clair R. W. & Rudel L. L. Mobilization of cytoplasmic CE droplets by overexpression of human macrophage cholesteryl ester hydrolase. J Lipid Res 44, 1833–1840, 10.1194/jlr.M300162-JLR200 (2003). [DOI] [PubMed] [Google Scholar]
- Xu J. et al. Hepatic carboxylesterase 1 is induced by glucose and regulates postprandial glucose levels. PloS One 9, e109663, 10.1371/journal.pone.0109663 (2014). [DOI] [PMC free article] [PubMed] [Google Scholar]
- Zhao B., Song J. St Clair R. W. & Ghosh S. Stable overexpression of human macrophage cholesteryl ester hydrolase results in enhanced free cholesterol efflux from human THP1 macrophages. Am J Physiol Cell Physiol 292, C405–412, 10.1152/ajpcell.00306.2006 (2007). [DOI] [PubMed] [Google Scholar]
- Hayhurst G. P., Lee Y. H., Lambert G., Ward J. M. & Gonzalez F. J. Hepatocyte nuclear factor 4alpha (nuclear receptor 2A1) is essential for maintenance of hepatic gene expression and lipid homeostasis. Mol Cell Biol 21, 1393–1403, 10.1128/MCB.21.4.1393-1403.2001 (2001). [DOI] [PMC free article] [PubMed] [Google Scholar]
- Yin L., Ma H., Ge X., Edwards P. A. & Zhang Y. Hepatic hepatocyte nuclear factor 4alpha is essential for maintaining triglyceride and cholesterol homeostasis. Arterioscler Thromb Vasc Biol 31, 328–336, 10.1161/ATVBAHA.110.217828 (2011). [DOI] [PMC free article] [PubMed] [Google Scholar]
- Bertola A., Mathews S., Ki S. H., Wang H. & Gao B. Mouse model of chronic and binge ethanol feeding (the NIAAA model). Nat Protoc 8, 627–637, 10.1038/nprot.2013.032 (2013). [DOI] [PMC free article] [PubMed] [Google Scholar]
- Labonne B. E. F. et al. Acetaldehyde-induced mitochondrial dysfunction sensitizes hepatocytes to oxidative damage. Cell Biol Toxicol 25, 599–609, 10.1007/s10565-008-9115-5 (2009). [DOI] [PubMed] [Google Scholar]
- Bulua A. C. et al. Mitochondrial reactive oxygen species promote production of proinflammatory cytokines and are elevated in TNFR1-associated periodic syndrome (TRAPS). J Exp Med 208, 519–533, 10.1084/jem.20102049 (2011). [DOI] [PMC free article] [PubMed] [Google Scholar]
- Nakahira K. et al. Autophagy proteins regulate innate immune responses by inhibiting the release of mitochondrial DNA mediated by the NALP3 inflammasome. Nat Immunol 12, 222–230, 10.1038/ni.1980 (2011). [DOI] [PMC free article] [PubMed] [Google Scholar]
- Naik E. & Dixit V. M. Mitochondrial reactive oxygen species drive proinflammatory cytokine production. J Exp Med 208, 417–420, 10.1084/jem.20110367 (2011). [DOI] [PMC free article] [PubMed] [Google Scholar]
- Shokolenko I., Venediktova N., Bochkareva A., Wilson G. L. & Alexeyev M. F. Oxidative stress induces degradation of mitochondrial DNA. Nucleic Acids Res 37, 2539–2548, 10.1093/nar/gkp100 (2009). [DOI] [PMC free article] [PubMed] [Google Scholar]
- Merali Z., Ross S. & Pare G. The pharmacogenetics of carboxylesterases: CES1 and CES2 genetic variants and their clinical effect. Drug Metabol Drug Interact 29, 143–151, 10.1515/dmdi-2014-0009 (2014). [DOI] [PubMed] [Google Scholar]
- You M., Fischer M., Cho W. K. & Crabb D. Transcriptional control of the human aldehyde dehydrogenase 2 promoter by hepatocyte nuclear factor 4: inhibition by cyclic AMP and COUP transcription factors. Arch Biochem Biophys 398, 79–86, 10.1006/abbi.2001.2713 (2002). [DOI] [PubMed] [Google Scholar]
- Babeu J. P. & Boudreau F. Hepatocyte nuclear factor 4-alpha involvement in liver and intestinal inflammatory networks. World J Gastroenterol 20, 22–30, 10.3748/wjg.v20.i1.22 (2014). [DOI] [PMC free article] [PubMed] [Google Scholar]
- Xu Y. et al. A metabolic stress-inducible miR-34a-HNF4alpha pathway regulates lipid and lipoprotein metabolism. Nat. Commun. 6, 7466, 10.1038/ncomms8466 (2015). [DOI] [PMC free article] [PubMed] [Google Scholar]
- McClain C. J. & Su L. C. Zinc deficiency in the alcoholic: a review. Alcohol Clin Exp Res 7, 5–10, 10.1111/j.1530-0277 (1983). [DOI] [PubMed] [Google Scholar]
- Kang X. et al. Zinc supplementation reverses alcohol-induced steatosis in mice through reactivating hepatocyte nuclear factor-4alpha and peroxisome proliferator-activated receptor-alpha. Hepatology 50, 1241–1250, 10.1002/hep.23090 (2009). [DOI] [PMC free article] [PubMed] [Google Scholar]
- Quiroga A. D., Lian J. H. & Lehner R. Carboxylesterase1/Esterase-x Regulates Chylomicron Production in Mice. PloS One 7, 10.1371/journal.pone.0049515 (2012). [DOI] [PMC free article] [PubMed] [Google Scholar]
- Clugston R. D. et al. Altered hepatic lipid metabolism in C57BL/6 mice fed alcohol: a targeted lipidomic and gene expression study. J Lipid Res 52, 2021–2031, 10.1194/jlr.M017368 (2011). [DOI] [PMC free article] [PubMed] [Google Scholar]
- Fleming C. D. et al. Structural insights into drug processing by human carboxylesterase 1: tamoxifen, mevastatin, and inhibition by benzil. J Mol Biol 352, 165–177, 10.1016/j.jmb.2005.07.016 (2005). [DOI] [PubMed] [Google Scholar]
- Diczfalusy M. A., Bjorkhem I., Einarsson C., Hillebrant C. G. & Alexson S. E. Characterization of enzymes involved in formation of ethyl esters of long-chain fatty acids in humans. J Lipid Res 42, 1025–1032 (2001). [PubMed] [Google Scholar]
- Li Y. et al. Carboxylesterase 2 prevents liver steatosis by modulating lipolysis, ER stress and lipogenesis and is regulated by HNF4alpha. Hepatology, 10.1002/hep.28472 (2016). [DOI] [PMC free article] [PubMed] [Google Scholar]
- Ge X. M. et al. Aldo-keto reductase 1B7 is a target gene of FXR and regulates lipid and glucose homeostasis. J Lipid Res 52, 1561–1568, 10.1194/Jlr.M015859 (2011). [DOI] [PMC free article] [PubMed] [Google Scholar]
- Mastrodonato M. et al. Altered distribution of caveolin-1 in early liver steatosis. Eur J Clin Invest 41, 642–651, 10.1111/j.1365-2362.2010.02459.x (2011). [DOI] [PubMed] [Google Scholar]
- Edwards M., Houseman L., Phillips I. R. & Shephard E. A. Isolation of mouse hepatocytes. Methods Mol Biol 987, 283–293, 10.1007/978-1-62703-321-3_24 (2013). [DOI] [PubMed] [Google Scholar]
- Guan X., Rubin E. & Anni H. An optimized method for the measurement of acetaldehyde by high-performance liquid chromatography. Alcohol Clin Exp Res 36, 398–405, 10.1111/j.1530-0277.2011.01612.x (2012). [DOI] [PMC free article] [PubMed] [Google Scholar]
- Mishin V., Gray J. P., Heck D. E., Laskin D. L. & Laskin J. D. Application of the Amplex red/horseradish peroxidase assay to measure hydrogen peroxide generation by recombinant microsomal enzymes. Free Radic Biol Med 48, 1485–1491, 10.1016/j.freeradbiomed.2010.02.030 (2010). [DOI] [PMC free article] [PubMed] [Google Scholar]
Associated Data
This section collects any data citations, data availability statements, or supplementary materials included in this article.


