

Summary
Intratumoral heterogeneity of signaling networks may contribute to targeted cancer therapy resistance, including in the highly lethal brain cancer glioblastoma (GBM). We performed single cell phosphoproteomics on a patient-derived in vivo GBM model of mTOR kinase inhibitor (mTORki) resistance and coupled it to an analytical approach for detecting changes in signaling coordination. Alterations in the protein signaling coordination were resolved as early as 2.5 days after treatment, anticipating drug resistance long before it was clinically manifest. Combination therapies were identified that resulted in complete and sustained tumor suppression in vivo. This approach may identify actionable alterations in signal coordination that underlie adaptive resistance, which can be suppressed through combination drug therapy, including non-obvious drug combinations.
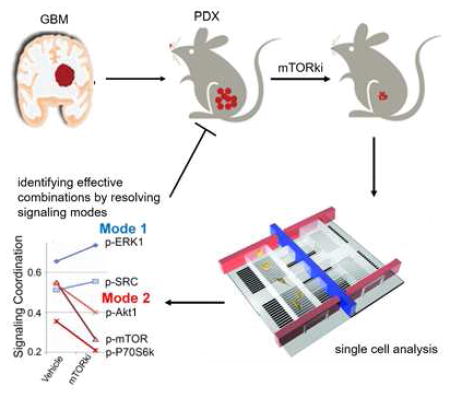
Graphical Abstract
Introduction
Glioblastoma (GBM), one of the most lethal human cancers, is a paradigmatic example of intratumoral heterogeneity. The Cancer Genome Atlas (TCGA) has revealed that prevalent GBM mutations and copy number variations (CNVs) cluster along a small set of druggable signaling pathways, including (a) receptor tyrosine kinase (RTK)/RAS/PI3K signaling, (b) p53 signaling, and (c) Rb signaling (Brennan et al., 2013). However, clinical trials with targeted monotherapies against these mutations or their downstream effectors have yet to favorably impact patient outcomes, as tumors rapidly acquire resistance (Cloughesy and Mischel, 2011; Nathanson et al., 2014). Intratumoral molecular heterogeneity may play a critical role in cancer drug resistance and new technologies that facilitate resolving such heterogeneity, including single cell RNA, DNA and even protein analyses (Irish et al., 2004; Kalisky et al., 2011; Shi et al., 2012; Wu et al., 2014) are becoming increasingly available. Mining such information to anticipate drug resistance and derive more effective combination therapies remains a serious challenge.
As a central signaling node of the RTK/RAS/PI3K signaling, the mechanistic Target Of Rapamycin (mTOR) pathway, which is hyperactivated in approximately 90% of GBMs, constitutes a compelling drug target (Cloughesy et al., 2013; Gini et al., 2013). However, resistance to targeted monotherapies against mTOR has been correlated to multiple genetic and non-genetic processes (Cope et al., 2014; Gini et al., 2013; Rodrik-Outmezguine et al., 2011; Rodrik-Outmezguine et al., 2014). Specifically, studies have shown that mutations in the mTORC1 regulators TSC1 and TSC2, or in the FKBP-rapamycin binding domain confer resistance to the allosteric mTOR inhibitor everolimus, which has activity primarily against mTOR complex 1 (mTORC1) (Iyer et al., 2012; Wagle et al., 2014). Moreover, breast cancer cells carrying mutations in the catalytic domain of mTOR are resistant to a dual ATP-competitive mTORC1/mTORC2 kinase inhibitor (mTORki) (Rodrik-Outmezguine et al., 2014). These results demonstrate that resistance to any single therapy can occur when drug-resistant tumor cell subpopulations expand to drive recurrence, akin to Darwinian-type evolution under the selection pressure of the drug (Bozic et al., 2013). At present, no GBM associated genetic mutations conferring resistance to the ATP-competitive mTORki have been identified, and the mutational spectra that promote such resistance are not well understood.
Tumors may also develop resistance through altered protein signaling networks. Studies performed in breast cancer and GBM cells treated with mTORki indicated the rapid induction of a compensatory Protein Kinase B (Akt) dependent signaling and an autophagy-dependent tumor cell survival (Gini et al., 2013; Rodrik-Outmezguine et al., 2011), respectively. These studies demonstrate that protein network rewiring could lead to resistance through which cancer cells quickly adapt to that drug, so as to maintain the signal flux through those networks required for tumor maintenance and growth (Berger and Hanahan, 2008; Elkabets et al., 2013; Krakstad and Chekenya, 2010; Lee et al., 2012; Muranen et al., 2012). These resistance promoting networks may be differentially expressed by the cells within a tumor (Marusyk et al., 2012).
The timescale of the appearance of resistance can depend upon mechanism. For Darwinian selection, the relatively long-term cell-cycle selection of the resistant subpopulation can be limiting. Deep sequencing of tumors can potentially detect those rare cell subpopulations, and thus help guide the selection of a second drug that forestalls resistance by targeting that population (Al-Lazikani et al., 2012; Brennan et al., 2013; Chin et al., 2008; Wacker et al., 2012). By contrast, resistance via adaptation can develop quickly. Thus the challenge is to measure the structure and adaptive response kinetics of the protein signaling networks that are influenced by the drug, and thereby identify any druggable signaling pathways that are active or activated during drugging. That analysis might point to therapy combinations that inhibit tumor growth and stave off resistance.
Here we investigate the basic resistance mechanism (Darwinian versus adaptation) in a patient-derived Epidermal Growth Factor Receptor (EGFR)-mutated in vivo GBM model of mTORki resistance. The findings inform a series of investigations designed to provide a priori predictions of targeted monotherapies and therapy combinations that will or will not be effective at staving off resistance. The resultant approach has implications for guiding combination therapies that can more effectively treat certain classes of GBM patients.
Results
Genomic Analysis and Stem Cell Marker Tracing in an In Vivo Model of mTORki Resistance Suggest an Adaptive Mechanism of Resistance
To generate a model of mTORki resistance in a clinically relevant, patient-derived model, we treated mice bearing GBM39 xenografts with CC214-2, an ATP-competitive mTORki that crosses the blood brain barrier and inhibits mTOR kinase activity in GBM cells (Gini et al., 2013). CC214-2 treatment (100 mg/kg, once every two days by gavage) significantly decreased tumor growth rate relative to control treated mice (Figures 1A and 1B) and reduced tumor glucose uptake as measured by 18F-fluorodeoxyglucose (FDG) positron emission tomography (PET) (Figures 1B and S1A). This initial response to CC214-2 was concordant with inhibition of mTORC1 and mTORC2 signaling and decreased Ki-67 labeling, a measure of tumor cell proliferation, as measured by immunohistochemistry (IHC) analysis of tumor tissue (Figures 1C and S1B, Table S1). By day 27, rapid tumor regrowth occurred with concomitant increases in glucose uptake and tumor volume, reactivation of mTORC1 and mTORC2 signaling and marked increase in Ki-67 labeling, thus modeling the clinical scenario of resistance (Figures 1A–1C).
Figure 1.

Characterization of GBM39 in vivo mouse model. (A) Tumor growth curve for control (sample size n=11), and treated (n=14) xenografts (n=7 for responsive and resistant groups respectively; variations expressed as mean +/− SD; *p< 0.05, with far right comparing sizes at day 19 versus day 39). (B) 18F-FDG PET (left), PET-CT (middle), and CT (right) scans for the three conditions (n=4 per condition). The arrow indicates the localization of the tumor. PET and CT images demonstrate significantly decreased metabolic burden and tumor volume in the responsive state. (C) IHC results for the three conditions. Scale bar: 100 μm. See also Figure S1 and Table S1.
We sought to characterize the mechanism of acquired mTORki resistance by GBM39 through genomic and phenotypic analyses. Therefore, we performed DNA Copy number variations (CNVs) and whole-exome sequencing (WES) analyses to resolve the basal molecular state of GBM39 PDXs and to determine whether a gain of function mutation or potential mTORki-promoted mutation was responsible for acquired drug resistance. CNVs and WES of tumor xenografts at baseline revealed a typical mutational pattern of a GBM clustering around three “core pathways” – RTK signaling, cell cycle control and TP53 signaling (Figure 2A). The CNVs analysis showed that the RTK signaling pathway contained EGFR amplification and EGFRvIII mutation along with multiple non-synonymous mutations in PTEN, NF1, and PIK(3)K genes. Analysis of the TP53 pathway revealed one non-synonymous SNV in TP53. Analysis of the cell cycle regulation pathway revealed CDKN2A/2B deletion and CDK6 amplification. We analyzed the synonymous and non-synonymous mutations using the PROVEAN/SIFT program and identified mutations generating variants predicted to have a deleterious or damaging effect only in the PIK(3)K genes, affecting PIK3C2G (P146L), PIK3C2B (P273H) and PIK3R2 (A727T and L669F/L710F/L488F). We compared this baseline genomic profile with (1) that of tumors that initially responded to CC214-2 based on reduced glucose uptake and lower tumor volume and (2) tumors that were rapidly re-growing (Figure 1). No mutations in genes whose proteins have been shown to promote resistance to mTOR inhibitors, including TSC1 and TSC2, or MTOR itself, were detected in the tumors (Tables S2 and S3) (Iyer et al., 2012; Wagle et al., 2014). Although responsive and resistant samples shared several, non-synonymous LOH alterations (Table S2), no new driver oncogenes were found that could potentially be responsible for drug resistance. Furthermore, we performed whole genome analysis and identified CNVs in control and resistant GBM39 tumors (Figures 2B and S2). We determined whether these CNVs were specific to a particular sample or shared between samples that received the same treatment (Figures 2B and S2A, Table S4). We reason that this second category of treatment-specific CNVs (summarized in Table S4) would be more representative of variations consequent to the drug treatment. We then analyzed the corresponding transcriptional profiles of the genes encoded within those CNVs (Figure S2B, Table S5). No correlation between CNVs and altered gene expression profiles were detected, indicating that the CNVs were most likely only passenger variations (Figure S2C) and did not trigger the onset of the resistant phenotype.
Figure 2.

Genomic analyses of GBM39 PDXs. (A) Whole genome SNPs and WES analyses reveal characteristic CNVs and SNVs in untreated GBM39 PDXs. There is no genetic variation between control and resistant samples for the three major TCGA pathways (RTK, TP53 and RB1). (PIK(3)K*: PIK3R1 M56I/M26I/M326I; PIK3C2G P146L (damaging, deleterious), A261E/A39E, L669F/L710F/L488F (damaging, deleterious), non-frameshift deletion exon 2 c.385_387; PIK3C2B P273H (damaging); PIK3R2 S313P, A727T (damaging)). (B) Copy number plot across the chromosomes for control (C) and resistant (R) PDXs, highlighting their genome profile similarity. See also Figures S2 and S3 and Tables S2–S5.
We next analyzed a panel of GBM cancer stem cell phenotypic markers that are correlated with resistance against a number of therapies (Schonberg et al., 2014) (Figure S3). We did not detect any changes in the expression of these markers, suggesting that resistance is not mediated by preferential proliferation of a drug-resistant stem cell population.
Taken together, these studies suggest the absence of genetic selection of a resistant phenotype as a dominant resistance mechanism. This points to the possibility of an adaptive mechanism of resistance through protein signaling rewiring.
Single Cell Analysis of Phosphoprotein Signaling Levels using an In Vivo Model of mTORki Adaptation
Guided by knowledge of signaling proteins commonly altered in GBM (Brennan et al., 2013; Chin et al., 2008; Sarkaria et al., 2007), we quantified the levels of 12 proteins and phosphoproteins in the GBM39 PDXs, using single cell IHC analysis (Figures 1C and S1B, Table S1). The protein panel included: biomarkers of mTOR activity, phospho(p)-mTOR, p70 ribosomal protein S6 kinase phosphorylation (p-P70S6K), ribosomal protein S6 phosphorylation (p-S6), eukaryotic translation initiation factor 4E binding protein 1 (p-4E-BP1), protein kinase B phosphorylation (p-Akt1), proline-rich Akt substrate of 40 kDa (p-PRAS40) and N-myc downstream regulated gene 1 (p-NDRG1) protein phosphorylation (Gini et al., 2013); biomarkers of compensatory transduction pathways downstream of EGFR, Extracellular Signal Regulated Kinase phosphorylation (p-ERK) (Mendoza et al., 2011), sarcoma kinase phosphorylation (p-Src) (Lu et al., 2009); a hypoxia index, Hypoxia Inducible Factor-1-alpha (HIF-1α); and two functional readouts, Ki-67 for cell proliferation and Terminal deoxynucleotidyl transferase mediated dUTP Nick End Labeling (TUNEL) assay for apoptosis.
During the responsive phase, CC214-2 treatment significantly reduced mTORC1 and mTORC2 signaling and cellular proliferation. Apoptotic cell death was registered only in approximately 1.5% of the cell population. Upon the onset of resistance, mTOR signaling was reactivated, as well as increased cellular proliferation, consistent with the reconstitution of tumor growth (Figures 1 and S1, Table S1). The availability of tumor tissues at baseline, during the midst of the response, and at the time of tumor regrowth, provided the opportunity to compare and confirm the single cell IHC data using the single cell barcode chip (SCBC) platform.
mTOR signaling varies dramatically from cancer cell to cancer cell in GBM39, with EGFRvIII positive tumor cells showing particularly high levels of mTOR signaling and representing the most abundant and aggressive phenotype (Gini et al., 2013; Nathanson et al., 2014). EGFRvIII and EGFR wild type expressing (EGFR+) tumor cells were separated from mouse cells and debris and sorted using an anti-EGFR antibody. EGFR+ cells were then passaged for two hr in culture to eliminate dead cells and then applied to the SCBC platform (Figure 3A). The SCBC platform (Wei et al., 2013) was designed with 310 1.5 nanoliter volume microchambers, each engineered for cell lysis and equipped with a full antibody array used in the IHC analysis, with the addition of the tumor protein p53 (p53) pathway biomarkers, p53 and cyclin-dependent kinase inhibitor protein 1A (p21) (Brennan et al., 2013), and caspase 3 as an apoptosis marker. Following cell lysis, the proteins were captured on the antibody array, and each array element was developed as a sandwich fluorescent immunoassay (Figure S4). A one-chip data set included the digitized fluorescence signals from 9 proteins measured from each of ~100 1-cell microchambers and ~100 0-cell microchambers (for signal background normalization). Two SCBCs were used for each condition studied. Scatter plots of 1-cell data are provided in Figure 3B. Comparing those single cell results with single cell IHC and immunoblotting analyses performed on bulk tumor samples confirmed that CC214-2 suppressed mTORC1 and mTORC2 signaling, which became reactivated during resistance (Figures 3B–3D). These results indicate that the SCBC assays on EGFR+ cells separated from the resected GBM39 tumors and the IHC assays on tumor tissues from those same models yield similar results across the time course of therapy.
Figure 3.

Assay protocols and single cell proteomic analysis of GBM39 tumors. (A) EGFR+ cells were separated from the GBM39 models and loaded onto an SCBC. Two SCBCs were run in parallel for each test condition. (B) Background subtracted SCBC data represented as one-dimensional scatter plots (mean +/− SEM was overlaid for each protein and is indicated by the black horizontal bar). Grey bars indicate the background level of each protein assayed. Statistical uniqueness is evaluated by two-tailed Mann-Whitney test for pairwise comparison (black stars) and Kruskal-Wallis test for comparison among three groups (blue stars, NS, not significant; *p < 0.05; **p < 0.005; ***p < 0.0005). (C) Digitized IHC results for selected proteins assayed from tumor tissue slides (mean +/− SD). (D) Immunoblots of various proteins from bulk assays of GBM39 PDXs. See also Figure S4.
Single Cell Analysis of Phosphoprotein Signaling Coordination of the In Vivo Model of mTORki Adaptation Identifies Drug-activated Signaling Modes
The SCBC single cell analysis yields two independent classes of information: the protein levels and the protein-protein correlations (Figures 4A and S5A). The latter can be mined to evaluate the coordinated signatures of the signaling proteins (Figure 4B). During response, CC214-2 profoundly diminished the levels of most proteins, as seen in the changes in sphere sizes between control and responsive plots of Figure 4A, but perhaps more clearly in the bar graph above Figure 4A. CC214-2 also strongly reduced the protein-protein correlations, as indicated by the loss of network edges of responsive plot relative to control. To evaluate the change in tumor heterogeneity across the three stages, we employed a functional heterogeneity index (FHI). The FHI reflects the dispersion of the functional protein levels across all single cell assays at a specific condition. It is defined as the dissimilarity value in the agglomerative hierarchical clustering (AHC) of mean normalized single cell data based upon Ward’s minimum variance method (Ward, 1963). In the responsive state, there is a more than 4-fold drop in the FHI (Figures 4C and S5B).
Figure 4.

Statistical analysis of single cell data informs targeted combination therapies. (A) Protein-protein correlation networks, extracted from SCBC data. Average protein levels are reflected in the sphere diameters, while correlation strengths are reflected in the thickness of the edges (see key). For the resistant state, existing, new, and lost correlations, relative to control, are indicated (see key). The relative change in average protein abundance from SCBC data is shown in the bar graphs above (p-P70S6K level is scaled by 1/4 on this graph). (B) Correlations between key functional proteins and the PC1 for the control and responsive states from in vivo and in vitro drug treatment tests. In both cases, two independent signaling modes are identified. (C) Quantification of the heterogeneity of GBM39 PDXs cells at the three stages. See also Figure S5.
The tumors were again probed at the resistant state (day 39 following the start of therapy). At this point, all protein levels were at or above those observed for the vehicle (Figures 3B and 3D and bar graph above Figure 4A). In addition, the correlation network indicated increased signaling activity, as reflected in the emergence of 9 new correlations (green edges in the resistant plot of Figure 4A), 8 of which were associated with p-ERK1 and p-Src. These results suggest that a gain of function through ERK/Src might be leading to CC214-2 resistance by promoting downstream mTOR signaling (Carracedo et al., 2008; Mendoza et al., 2011; Sunayama et al., 2010). Resistance was also associated with a sharp increase in the FHI (Figure 4C).
We analyzed how the overall protein signaling coordination is altered by mTOR kinase inhibition. To this end, we performed Principal Component Analysis (PCA), using the two-dimensional matrix of measured protein-protein co-variances as input. We then calculated the correlations between the assayed proteins and the first principal component (PC1) in response to CC214-2. PC1 captures the most essential feature of the signaling network, and so this analysis provides an estimate of which proteins participate most strongly in that signaling. For the control tumor, PC1 is populated by p-ERK1, p-Src, p-Akt1, p-mTOR, and p-P70S6K (left panel of Figure 4B). In response to CC214-2, these 5 proteins bifurcate into 2 groups, or modes (a term used to imply collective behavior). Following 19 days of treatment in vivo with CC214-2, the influence of p-Akt1, p-mTOR, and p-P70S6K (red mode of Figure 4B) on signaling coordination, relative to p-ERK1 and p-Src (blue mode), is diminished. The implication is that the drug diminishes the signaling coordination associated with mTORC1/C2 signaling, while activating ERK and Src signaling. This observation suggested that the latter may have gained the ability to maintain signal flux to key downstream mTOR effectors. Strikingly, this same conclusion may also be drawn through a similar analysis of EGFR+ cells that were extracted from the control and treated in vitro with 2 μM CC214-1 (the counterpart of CC214-2 for in vitro use) (Gini et al., 2013) for only 2.5 days (right panel of Figure 4B). Thus, although the changes in protein levels between the control and the responsive tumors, or between the control and the 2.5 days in vitro treated cells, imply an effective drug response, the shift in signaling network coordination points to the rapid emergence of a potential compensatory mechanism (Figure S5C). We cannot exclude the possibility that increased drug metabolism or drug efflux contributes to the tumor cell adaptation observed. However, our results point to a facile resistance mechanism of adaptation, with the drug-activated signaling networks providing potential targets for combination therapy.
Combination Therapies Indicated by Changes in Signaling Coordination Yield Effective In Vivo Treatments
The data of Figure 4B suggest that targeting any one of the 5 proteins is unlikely to exhibit a strong anti-cancer effect, and targeting any two proteins from the same mode would also be expected to be a poor strategy. However, simultaneously targeting 1 protein from each mode might be effective. Correspondingly, we treated mice implanted with GBM39 using combinations of CC214-2 (C), dasatinib (D, Src inhibitor), and U0126 (U, MEK inhibitor) to test four therapies or therapy combinations expected to be ineffective, and 3 therapy combinations expected to be effective. Consistent with our model, treatment with C, D, U or D+U could not induce sustained tumor growth inhibition in vitro or in vivo. In contrast, combining C with either D and/or U completely suppressed tumor growth, with no adverse effects of the treatment observed (Figures 5A, 5B and S6). In vivo treatment was stopped after 47 days with no sign of recurrence (Figure 5A). Removal of the combination therapy resulted in rapid tumor re-growth. This was concomitant with reactivation of mTORC1/C2 signaling pathways (Figure S1, Table S1).
Figure 5.

In vivo validation of 7 mono- or combination therapies. (A) In vivo test results for the 7 mono- or combination therapies based upon the predictions from the SCBC data analysis. All 7 predictions proved correct (data are shown as mean +/− SD; n=11 for vehicle, n=6 for C, n=4 for D, n=4 for U, n=4 for each combinatorial treatment group. **p<0.005 relative to samples after treatment stop versus responsive samples, ***p<0.001 relative to responsive samples versus vehicle samples). (B) IHC images of drug targets for the combinatory treatments of CC214-2 and ERK and/or Src inhibitors,. Scale bar: 100 μm. See also Figures S1 and S6 and Table S1.
These results demonstrate that in a therapeutically representative in vivo model of GBM (Sarkaria et al., 2007), long-term disease remission can be induced and sustained if independent signaling modes are identified and sufficiently inhibited. Importantly, those independent signaling modes were uniquely resolved via single cell proteomic analysis after only a couple of days of in vitro treatment of EGFR+ cells separated from the untreated tumor. This time frame is well before the emergence of observable therapeutic resistance.
Analysis of the Functional Roles of the Signaling Modes
To develop deeper insight into the independent signaling modes identified via single cell analysis, we developed a Partial Least Squares (PLS) model to identify possible relationships between the single cell IHC data (Figure 5B) and tumor functional behavior (Janes et al., 2005). PLS analysis is similar to PCA but seeks to identify the principal components of one data set (the IHC analysis in Figure 5B) that can best predict a second data set (functional observations of the tumor). Quantitative IHC assays of resected tumor tissues from all 7 tested therapy combinations and from the control were loaded into an explanatory matrix (Figure 6A, Table S6). The dependent matrix was constructed from the transitory growth rate (TGR) at sacrifice, and a cell cycle metric time constant τ. The TGR is defined as the average percentage of tumor volume change per day of the last three time points measured before sacrifice. The cell cycle metric τ was extracted by fitting the growth curves with the exponential growth function (Table S6; See Supplemental Experimental Procedures for details).
Figure 6.

PLS modeling confirms the presence of independent signaling modes. (A) Validation of the PLS modeling: the calibration phase of the model was constructed by randomly choosing part of observations (orange part). The first two PCs were used to perform a leave-one-out cross-validation to assess the model stability. The established model was then employed to predict the TGR at sacrifice and cell cycle metric τ for the remaining observations (blue part). (B) Correlations of the IHC assayed proteins, as well as the functional observations, with PC1 and PC2. TGR strongly correlates with mTOR effectors (mode 1: red), while p-Src and p-ERK1 (mode 2: blue) largely dominate PC2, constituting an independent signaling mode that accounts for adaptive response to mTOR kinase inhibitor. (C) PLS modeling shows that for effective drug combinations projections are qualitatively different from linear superposition of individual drugs, which in turn implies that synergistic drug combinations do not simply act in a linearly additive manner. See also Table S6.
The PLS model was developed using a subset of the data, and then validated through leave-one-out cross-validation and predictions of the remaining measurements (Figures 6A). The agreement between predictions and observations supports the validity of the model. In Figure 6B we plot the correlations of the assayed proteins, as well as the functional observations, with the x- and y-axis as the 1st and 2nd PCs, respectively. The mTORC1/C2 associated proteins that constitute mode 1 of Figure 4B lie principally along PC1, as does the TGR. This means that the TGR can be estimated using just the IHC measurements of the mTORC1/C2 proteins. Importantly, the TGR correlates with p-S6, p-4E-BP1 and p-Akt1, which are key factors regulating protein translation and cellular proliferation. The cell cycle metric τ is anti-correlated with the TGR and the mTORC1/C2 associated proteins but also lies largely along PC1. The application of effective drug combinations will slow tumor growth, thus increasing the characteristic cell division time. Therefore, τ is anti-correlated with the TGR. These relationships indicate that mTORC1/C2 and their effectors are the primary drivers that account for tumor growth. The functional proteins p-ERK and p-Src constitute a second group largely aligned along PC2, with only weak relationships to proteins in the first group. This is consistent with a compensatory mechanism associated with ERK signaling and Src signaling. This retrospective analysis independently confirms the two signaling modes (Figure 4B) resolved in the SCBC data analysis and yields insights on their respective functional roles (Figure 6B).
The PLS model allowed for a comparison of the therapy combinations, with each combination represented by its respective IHC data set (Table S1). Comparison of the projections of C, U with C+U (Figure 6C) on the first two PCs indicates that C+U projects qualitatively differently from the linear superposition of single-input C and U. This indicates a cooperative, non-linear influence of the two drugs on the tumor. Note that the therapeutically ineffective D+U combination is close to the linear superposition of D and U.
Generality of the Approach
A lesson from the GBM39 study is that, while the CC214-2 inhibitor targeted at mTORC1/C2 does repress mTOR signaling, the cancer cells rapidly activate other signaling to promote drug resistance. This activation may be detected after only a couple of days of in vitro treatment of the tumor cells, via single cell analysis of protein signaling network coordination. That analysis, in turn, points to combination therapies that stave off resistance and thus provide for much more effective treatments. We explored whether these findings have generality and potential clinical utility. To this end, we investigated a low-passage cell pcGBM2 derived from a patient GBM tumor, as well tumor cells from a patient recurrent GBM biopsy, taken from the operating room (Figures 7 and S7). In both cases, the cells were treated in vitro for 2 days with a targeted inhibitor that was chosen based upon existing knowledge of the tumor.
Figure 7.

Analysis of a low-passage pcGBM2 patient-derived GBM cell line. (A) Single-cell data represented as one dimensional scatter plots for control, lapatinib and XL-765 + trametinib (XL-765+T) treated samples. The cells were stimulated with 100 ng/mL EGF at 37°C for 10 min before on-chip cell lysis. The average fluorescence intensity with SEM is overlaid for each protein (black horizontal bars). Statistical uniqueness is evaluated by two-tail Mann-Whitney test for pairwise comparison (*p<0.05; **p<0.005; ***p<0.0005; NS: not significant). The down regulated p-EGFR levels shown in the inset indicate that lapatinib has successfully engaged its target. (B) Correlation between key functional proteins and the PC1 for control, lapatinib and XL-765+T treated samples. (C) The in vitro validation confirms that adapted tumor cells are more resistant to lapatinib treatment (data are shown as mean +/− SD). Student’s T-test is used to evaluate the statistical significance (*p<0.05). (D) Cell viability test shows that XL-765+T can induce significant cell death after 60 hr in vitro treatment. See also Figure S7.
The pcGBM2 cells exhibited EGFR over expression and so were treated with an EGFR inhibitor lapatinib. While the drug fully engaged the target, as assayed by changes in p-EGFR levels (Figure 7A), there were new correlations, relative to control, that emerged between p-ERK1 and core mTOR effectors, indicating a rapid cellular response to the drug through activation of ERK signaling (Figure S7A). This was detected in both the levels of p-ERK and in its role in signaling coordination (Figure 7B). In fact, lapatinib might even promote tumor cell growth through strengthening the interaction between PI3K/mTOR signaling and MEK/ERK signaling (Mendoza et al., 2011). Several core mTORC1/C2 effectors also increased their role in signaling coordination (Figure 7B), even as the levels of these proteins were repressed by the drug. Lapatinib also induced an increase in glucose uptake (Figure S7B and S7C) (Wang et al., 2013).
This adaptive response indicated that inhibition of EGFR by lapatinib at this dose would likely be an ineffective therapy. We validated this prediction by assessing in vitro cell viability and proliferation after 2 days of lapatinib treatment for both fresh EGFR+ tumor cells and adapted EGFR+ tumor cells (2 μM lapatinib 2-day pretreatment on fresh EGFR+ tumor cells was used to establish the adapted EGFR+ tumor cells). Slight cell death was observed in fresh tumor samples while an increase in cellular proliferation was apparent in the adapted tumor samples, consistent with our predictions (Figure 7C). Thus, lapatinib engaged its target, but the relatively short term (96 hr) treatment did not yield significant cell killing.
It is interesting to note that most pre-existing protein-protein correlations associated with mTOR and its effectors were not significantly altered by lapatinib (Figure 7B). This suggested that a combination treatment of an mTOR inhibitor (XL-765, in GBM clinical trials) (Cloughesy et al., 2013) with a MEK inhibitor (trametinib, T) might be more effective. Consistent with this prediction, treatment of fresh cells for 60 hr with this combination, at a clinically relevant dose, did cause significant cell killing with a reduction in the FHI (Figures 7D and S7D). Although the p-ERK1 level in the surviving cells was higher than in the untreated cells, its influence over the signaling coordination was significantly decreased following treatment (Figures 7B and S7A). This data indicates that, for the EGFR+ pcGBM2 cells, there are rapid adaptive responses to a targeted EGFR inhibitor, and a quantitative analysis of those responses leads to a choice of a therapy combination that yields improved cell killing, and represses the adaptive response, at least within the limits of what was measured.
The freshly resected patient GBM biopsy was characterized as having a Phosphatase and Tensin Homolog (PTEN) G127E loss of function mutation, a Fibroblast Growth Factor Receptor-3 (FGFR3) K650E gain of function mutation and a Tuberous Sclerosis Complex-1 (TSC1) loss of function splice site mutation. All of these mutations can contribute to PI3K-Akt-mTOR pathway activation (Fenton et al., 2012; Hu et al., 2014; Zhang et al., 2003). We thus examined the effect of the PI3K/mTOR dual inhibitor XL-765. Single cell analysis of a primary GBM biopsy is challenging because of the limited quantity of tissue, and the smaller cell size (and thus lower protein levels). Thus, the freshly resected GBM cells were analyzed using SCBCs with enhanced antibody barcodes and a signal amplification strategy. Analysis of the control and treated cells (Figures S7E–S7H) revealed that XL-765 treatment repressed all protein levels in the assayed panel, but sharply activated signaling coordination through the mTOR effector p-4E-BP1. Thus, from this limited data set, we would anticipate that treatment of this tumor with XL-765 would not be effective as it fails to inhibit one of the key components of mTORC1 signaling. Unfortunately, there was insufficient material from this tumor to permit additional tests with combination therapies. However, these data show that a SCBC platform can analyze a challenging GBM biopsy, revealing both, drug-repressed and drug-activated phosphoprotein signaling. This type of analysis might constitute a valuable tool for clinicians to predict more effective up-front treatments for cancer patients.
Discussion
For a patient-derived GBM39 model of mTORki resistance, we show that compensatory rewiring of signaling pathways during the responsive state of the treatment acts as a dominant mechanism of resistance. These resistance-leading protein networks are readily resolved using SCBCs through analysis of the differential responses in signaling coordination, but not through analysis of changes in corresponding average protein levels. Such drug-activated networks can subsequently be co-targeted to arrest tumor growth in vivo. The same compensatory protein signaling is also detected within 3 days of in vitro drug treatment of tumor cells resected from an untreated model.
Our approach has been applied in analyzing additional GBM patient samples. We have observed adaptive response in these samples as reflected by the activation of specific signaling pathways upon in vitro or in vivo drug treatment with different targeted inhibitors. However, the precious nature of the patient samples precluded testing any combination therapy hypotheses. Thus, as an additional demonstration of generality, we applied the same SCBC technology and associated algorithm towards investigating a dedifferentiation based adaptive response mechanism to patient derived BRAFV600E mutant melanomas treated with BRAF inhibitor (vemurafenib) or certain immunotherapies (data not shown). The resulting analysis of changes in protein signaling coordination yielded a successful prediction of a combination targeted therapy that arrested the cellular dedifferentiation. This result demonstrates applicability of our approach in models of other cancers, but this work, and work reported elsewhere (Bergers and Hanahan, 2008; Nathanson et al., 2014; Pisco et al., 2013), also highlights the facile ability of many cancers to adapt to targeted inhibitors. For the cases explored here, measurements of drug-activated signaling networks can provide actionable insight into the adaptive response. This is particularly relevant for GBM tumors, where the development of drug resistance is seen in virtually every patient.
SCBCs have been compared against related single methods in the recent literature (Heath et al., 2016). An advantage of SCBCs for analysis of patient materials is their requirement of only a small amount of cells (~1000) and that cells are imaged prior to analysis. This combination is crucial for tumor biopsy samples that usually contain non-cellular debris. The protein panels explored here were chosen using prior knowledge of the nature of the tumors and tumor models under study. A more comprehensive panel would permit an unbiased analysis of all 4 of the GBM associated signaling networks identified by the TCGA working group (Brennan et al., 2013). The results indicate that single cell quantitative proteomics may provide useful information for guiding the choice of targeted therapies and therapy combinations. This hypothesis will need to be tested in a clinical trial, and the work reported here motivates additional pre-clinical work to set the stage for such a trial.
Experimental Procedures
Experimental methods are briefly summarized below, with more details in the Supplemental Experimental Procedures.
Cell lines, primary cells and reagents
GBM39 primary neurospheres were previously described by our group (Nathanson et al., 2014) and authenticated by luciferase reporter expression before the beginning of the in vivo experiments. The pcGBM2 cell line derived from a 15-year old male patient bearing an EGFRvIII+ GBM tumor was provided as a kind gift from Dr. Michelle Monje (Stanford University) upon informed consent following the Stanford University Ethical Committee regulations. The cells were cultured in tumor sphere media (TSM). The patient samples were collected from freshly resected brain tumors upon informed consent following the UCLA Ethical Committee regulations. The resected tumors were blood cell depleted and dissociated into single cell suspension immediately after collection from the operating room.
Targeted inhibitors
CC214-1 and CC214-2 were provided by Celgene Corporation (San Diego, U.S.A.) (Mortensen et al., 2013). Lapatinib ditosylate (GW-572016), trametinib (GSK1120212), XL-765 (SAR245409), U0126, erlotinib and dasatinib were obtained from Selleckchem.
GBM39 flank xenografts
GBM39 flank xenografts were obtained in full compliance with the UCLA-Division of Laboratory Animal Medicine (DLAM) regulation and with the UCSD-Institution of Animal Care and Use Committee (IACUC) regulations. One million of GBM39 cells were injected in the flank of each 4 week old female athymic mouse (Gini et al., 2013). Single drug treatments: CC214-2 (oral gavage, 100 mg/kg, once every two days); dasatinib (oral gavage, 30 mg/kg, once every two days); U0126 (intra-peritoneal injection, 25 μmol/kg, once every two days). Mice were euthanized when tumors reached 15 mm diameter. Combination drug treatments followed similar dosages and schedules.
MicroPET/CT imaging
Four mice for each group were anesthetized with isoflurane (2% in 100% oxygen), warmed and injected with 20 μCi 18F-fluorodeoxyglucose (FDG). After 60 min mice were placed in a chamber for both PET and CT imaging. Acquisition of PET images was performed for 10 min followed by 8 min CT acquisition.
IHC
IHC stains of paraffin embedded GBM39 xenograft blocks were stained as described in Mellinghoff et al. (Mellinghoff et al., 2005). In the IHC quantification, the following number of xenografts was considered for each group: n= 7 (control), n= 6 (CC214-2 responsive), n= 5 (CC214-2 resistant), n= 4 (dasatinib), n= 4 (U0126), n= 4 (U0126 plus dasatinib), n= 2 (each combination with CC214-2), n= 2 (each drug removed group).
Whole Exome Sequencing (WES) analysis
A range of 6–14 μg of gDNAs was extracted from the GBM39 xenografts at control, responsive and resistant stages using Qiagen QIAamp DNA Mini kit. Whole-exome DNA was captured from total genomic DNA using the SeqCap EZ System from NimbleGen according to the manufacturer’s instructions. Libraries were then sequenced with an average coverage for each tumor ≥ 100X on the NextSeq 500 platform from Illumina, using 100-bp pair-ended reads.
Single Nucleotide Polymorphism (SNPs) and Gene Expression (GE) analyses
Two controls and two CC214-2 resistant PDXs were used for DNA extractions, using the Qiagen QIAamp DNA Mini kit protocol; 500 ng of DNA from control and resistant samples were analyzed by Affymetrix SNP 6.0 array (200 kb filter, 50 markers) at the Clinical Microarray Core, UCLA. Gene expression analysis was performed at the same core by Affymetrix U133plus2.0 array using 200 ng of RNA extracted from the same two controls and two CC214-2 resistant xenografts used in the SNPs screening (Qiagen micro RNA extraction kit).
Microchip Fabrication
SCBCs are fabricated as previously described (Wei et al., 2013). All DNA and antibody reagents have been checked for cross reactivity and are listed in the Supplemental Experimental Procedure.
Tumor cell sorting and preparation for the SCBC test
Single cell suspensions were prepared from xenograft tumors or the patient samples, using procedures described in the Supplemental Experimental Procedures. For the xenografts, cell sorting was carried out with the Human EGFR PlusCellectTM Kit from R&D systems (Catalog number PLS1095) following the manufacturer’s protocol. For both types of tumor samples, cells were plated on a laminin-coated petri dish and incubated for 2 hr. Dead cells were removed via aspiration, and the live cells were subsequently transferred into the SCBCs. Cell viability was >95% after employing the surface plating step.
Protocols of single cell proteomic assay
The antibody arrays within the SCBC were prepared immediately prior to use. Cells were randomly loaded into the 310 microchambers of the SCBC. Each microchamber has an assay component, and a separate reservoir of lysis buffer, and was photographed after cell loading. The SCBC was then cooled on ice for cell lysis. Following a 2-hr protein capture period at room temperature, the microchambers were flushed and the antibody arrays were developed using a cocktail of detection antibodies. The developed antibody barcode arrays were digitized by a Genepix scanner. Each array is matched with the micrograph of that array for preparing a table that contains the microchamber address, the numbers of cells, and the measured fluorescence levels of each assayed protein.
In vitro assays of GBM39 tumor cells
GBM39 neurospheres were treated with therapy or therapy combinations for 24 hr, followed by immunoblotting of selected proteins (Figure S6A). EGFR+ cells from GBM39 neurospheres that were treated for 4 days with the same therapies and therapy combinations were surface captured using the DEAL technique (Bailey et al., 2007) followed by trypan blue staining and counting the numbers of live and dead cells (Figure S6B). In parallel, all cells, regardless of EGFR expression, were cultured in a 12-well plate under standard conditions (Figure S6C). These cells were treated with the various therapies and therapy combinations for 3 days followed by trypan blue staining and counting the numbers of live and dead cells (Figure S6D).
In vitro assay on the pcGBM2 cell line
pcGBM2 cells were grown in neurosphere culture. Neurospheres were dissociated, and EGFR+ cells were sorted using magnetic bead-based techniques following the protocols described above. One set of cells was treated with lapatinib (2 μM) to establish the adapted cells. The other set was treated with DMSO for 2 days. The culture medium was flushed, and both sets of cells were treated for 2 days with 2 μM lapatinib. Cell viability and proliferation were measured at each stage.
RIMChip 18F-FDG assays
RIMChip 18F-FDG assays were carried out as previously described (Dooraghi et al., 2013; Wang et al., 2013). EGFR+ pcGBM2 cells were treated with lapatinib for 0.5, 1, 1.5, and 2 hr and then loaded to the RIMChip (Figures S7B and S7C). The level of the glucose uptake was normalized by cell number to yield a quantitative comparison for all time points.
Mathematical analysis and statistical methods
All p values for group comparison were evaluated using one-way ANOVA and Student’s T-test with Bonferroni correction unless otherwise noted. PCA, AHC and PLS analyses were performed with XLSTAT (Addinsoft) (see Supplemental Experimental Procedure for details).
Supplementary Material
Significance.
Genomic analyses of GBM tumors have revealed a core set of mutations that reside along druggable pathways, but drugs targeted to those pathways have only marginally improved patient outcomes, with the rapid development of drug resistance being almost universal. Using genomics and single cell phophoproteomics analyses of a human derived in vivo GBM model of mTORki resistance, we show that drug resistance can proceed via a non-genetic (adaptive) mechanism that is activated within days of drugging. The measured adaptive response points to combination therapies that are tested in vivo and shown to halt tumor growth. This single cell analytic approach appears to provide clinically actionable insights into designing combination therapy strategies for more effectively treating GBM patients.
Highlights.
Sequencing excludes the selection of an mTORki resistant genotype in a GBM model
Heterogeneous signaling networks rapidly adapt to mTORki to drive resistance
Resistance promoting signaling is observed a priori by single cell analysis
Network analyses point to therapy combinations for long term disease suppression
Acknowledgments
This work was supported by the Ben and Catherine Ivy Foundation Fund (J.R.H, P.S.M. and T.F.C.) and by the National Institutes of Health (NIH) grants 5U54CA 151819 (W.W., P.S.M, J.R.H.), NS73831 (P.S.M.), Phelps Family Foundation (W.W., Y.S.S.) and support from the Defeat GBM Research Collaborative, a subsidiary of National Brain Tumor Society (W.K.C., P.S.M., T.F.C.). W.K.C. is a Fellow of the National Foundation for Cancer Research. B.G. received support from The European Commission (PIOF-GA-2010-271819). We thank Dr. David Nathanson for proofreading and comments. R.C. is employed as vice president at Celgene and has ownership interest. T.F.C. was a consultant and was on the advisory board of Celgene. J.R.H. is a board member of IsoPlexis, which is a company seeking to commercialize the SCBC technology.
Footnotes
Accession numbers
Microarray gene expression and SNPs analyses data have been deposited into GEO. The accession code is GSE63387 and GSE53042. WES analysis data have been deposited in SRA, and the accession code is SRP062496.
Supplemental Information includes Supplemental Experimental Procedures, 7 figures and 6 tables, and can be found with the article online.
No potential conflicts of interest were disclosed by the other authors.
Author Contributions
W.W., B.G., Y.S.S., P.S.M. and J.R.H. initiated the project and designed the experiments. W.W., B.G., Y.S.S., M.X., X.D., H.Y., T.M., K.M., J.Z., D.J. and S.I. performed the experiments and analyzed the data. B.G. designed and performed the in vivo GBM model. W.W. performed the computational modeling. R.C. supported the CC214-2 tests. T.F.C. contributed to the experiment designs. K.H., J.K., B.B., Y.S., Y.G., X.L. and C.D.J. supported the experiment realization. W.W., B.G., Y.S.S., W.K.C., P.S.M. and J.R.H. wrote the manuscript.
Publisher's Disclaimer: This is a PDF file of an unedited manuscript that has been accepted for publication. As a service to our customers we are providing this early version of the manuscript. The manuscript will undergo copyediting, typesetting, and review of the resulting proof before it is published in its final citable form. Please note that during the production process errors may be discovered which could affect the content, and all legal disclaimers that apply to the journal pertain.
References
- Al-Lazikani B, Banerji U, Workman P. Combinatorial drug therapy for cancer in the post-genomic era. Nat Biotechnol. 2012;30:679–691. doi: 10.1038/nbt.2284. [DOI] [PubMed] [Google Scholar]
- Bailey RC, Kwong GA, Radu CG, Witte ON, Heath JR. DNA-encoded antibody libraries: a unified platform for multiplexed cell sorting and detection of genes and proteins. J Am Chem Soc. 2007;129:1959–1967. doi: 10.1021/ja065930i. [DOI] [PMC free article] [PubMed] [Google Scholar]
- Berger C, Hanahan D. Modes of resistance to anti-angiogenic therapy. Nat Rev Cancer. 2008;8:592–603. doi: 10.1038/nrc2442. [DOI] [PMC free article] [PubMed] [Google Scholar]
- Bozic I, Reiter JG, Allen B, Antal T, Chatterjee K, Shah P, Moon YS, Yaqubie A, Nelly N, Le DT, et al. Evolutionary dynamics of cancer in response to targeted combination therapy. eLIFE. 2013;2:e00747. doi: 10.7554/eLife.00747. [DOI] [PMC free article] [PubMed] [Google Scholar]
- Brennan CW, Verhaak RG, McKenna A, Campos B, Noushmehr H, Salama SR, Zheng S, Chakravarty D, Sanborn JZ, Berman SH, et al. The somatic genetic landscape of glioblastoma. Cell. 2013;155:462–477. doi: 10.1016/j.cell.2013.09.034. [DOI] [PMC free article] [PubMed] [Google Scholar]
- Carracedo A, Ma L, Teruya-Feldstein J, Rojo F, Salmena L, Alimonti A, Egia A, Sasaki AT, Thomas G, Kozma SC, et al. Inhibition of mTORC1 leads to MAPK pathway activation through a PI3K-dependent feedback loop in human cancer. J Clin Invest. 2008;118:3065–3074. doi: 10.1172/JCI34739. [DOI] [PMC free article] [PubMed] [Google Scholar]
- Chin L, Meyerson M, Aldape K, Bigner D, Mikkelsen T, VandenBerg S, Kahn A, Penny R, Ferguson ML, Gerhard DS, et al. Comprehensive genomic characterization defines human glioblastoma genes and core pathways. Nature. 2008;455:1061–1068. doi: 10.1038/nature07385. [DOI] [PMC free article] [PubMed] [Google Scholar]
- Cloughesy TF, Mischel PS. New Strategies in the Molecular Targeting of Glioblastoma: How Do You Hit a Moving Target? Clin Cancer Res. 2011;17:6–11. doi: 10.1158/1078-0432.CCR-09-2268. [DOI] [PMC free article] [PubMed] [Google Scholar]
- Cloughesy TF, Mischel PS, Omuro AMP, Prados M, Wen PY, Wu B, Rockich K, Xu Y, Lager JJ, Mellinghoff IK. Tumor pharmacokinetics (PK) and pharmacodynamics (PD) of SAR245409 (XL765) and SAR245408 (XL147) administered as single agents to patients with recurrent glioblastoma (GBM): An Ivy Foundation early-phase clinical trials consortium study. ASCO Meeting Abstracts. 2013;31 [Google Scholar]
- Cope CL, Gilley R, Balmanno K, Sale MJ, Howarth KD, Hampson M, Smith PD, Guichard SM, Cook SJ. Adaptation to mTOR kinase inhibitors by amplification of eIF4E to maintain cap-dependent translation. J Cell Sci. 2014;127:788–800. doi: 10.1242/jcs.137588. [DOI] [PubMed] [Google Scholar]
- Dooraghi AA, Vu NT, Silverman RW, Farrell R, Shah KS, Wang J, Heath JR, Chatziioannou AF. Betabox: a beta particle imaging system based on a position sensitive avalanche photodiode. Phys Med Biol. 2013;58:3739–3753. doi: 10.1088/0031-9155/58/11/3739. [DOI] [PMC free article] [PubMed] [Google Scholar]
- Elkabets M, Vora S, Juric D, Morse N, Mino-Kenudson M, Muranen T, Tao J, Campos AB, Rodon J, Ibrahim YH, et al. mTORC1 inhibition is required for sensitivity to PI3K p110alpha inhibitors in PIK3CA-mutant breast cancer. Sci Transl Med. 2013;5:196ra199. doi: 10.1126/scitranslmed.3005747. [DOI] [PMC free article] [PubMed] [Google Scholar]
- Fenton TR, Nathanson D, Ponte de Albuquerque C, Kuga D, Iwanami A, Dang J, Yang H, Tanaka K, Oba-Shinjo SM, Uno M, et al. Resistance to EGF receptor inhibitors in glioblastoma mediated by phosphorylation of the PTEN tumor suppressor at tyrosine 240. Proc Natl Acad Sci USA. 2012;109:14164–14169. doi: 10.1073/pnas.1211962109. [DOI] [PMC free article] [PubMed] [Google Scholar]
- Gini B, Zanca C, Guo D, Matsutani T, Masui K, Ikegami S, Yang H, Nathanson D, Villa GR, Shackelford D, et al. The mTOR kinase inhibitors CC214-1 and CC214-2 preferentially block the growth of EGFRvIII-activated glioblastomas. Clin Cancer Res. 2013;19:5722–5732. doi: 10.1158/1078-0432.CCR-13-0527. [DOI] [PMC free article] [PubMed] [Google Scholar]
- Heath JR, Ribas A, Mischel PS. Single-cell analysis tools for drug discovery and development. Nat Rev Drug Discov. 2016;15:204–216. doi: 10.1038/nrd.2015.16. [DOI] [PMC free article] [PubMed] [Google Scholar]
- Hu Y, Lu H, Zhang J, Chen J, Chai Z, Zhang J. Essential role of AKT in tumor cells addicted to FGFR. Anticancer Drugs. 2014;25:183–188. doi: 10.1097/CAD.0000000000000034. [DOI] [PubMed] [Google Scholar]
- Irish JM, Hovland R, Krutzik PO, Perez OD, Bruserud O, Gjertsen BT, Nolan GP. Single cell profiling of potentiated phospho-protein networks in cancer cells. Cell. 2004;118:217–228. doi: 10.1016/j.cell.2004.06.028. [DOI] [PubMed] [Google Scholar]
- Iyer G, Hanrahan AJ, Milowsky MI, Al-Ahmadie H, Scott SN, Janakiraman M, Pirun M, Sander C, Socci ND, Ostrovnaya I, et al. Genome sequencing identifies a basis for everolimus sensitivity. Science. 2012;338:221. doi: 10.1126/science.1226344. [DOI] [PMC free article] [PubMed] [Google Scholar]
- Janes KA, Albeck JG, Gaudet S, Sorger PK, Lauffenburger DA, Yaffe MB. Systems model of signaling identifies a molecular basis set for cytokine-induced apoptosis. Science. 2005;310:1646–1653. doi: 10.1126/science.1116598. [DOI] [PubMed] [Google Scholar]
- Kalisky T, Blainey P, Quake SR. Genomic analysis at the single-cell level. Annu Rev Genet. 2011;45:431–445. doi: 10.1146/annurev-genet-102209-163607. [DOI] [PMC free article] [PubMed] [Google Scholar]
- Krakstad C, Chekenya M. Survival signalling and apoptosis resistance in glioblastomas: opportunities for targeted therapeutics. Mol Cancer Ther. 2010;9:135. doi: 10.1186/1476-4598-9-135. [DOI] [PMC free article] [PubMed] [Google Scholar]
- Lee MJ, Ye AS, Gardino AK, Heijink AM, Sorger PK, MacBeath G, Yaffe MB. Sequential Application of Anticancer Drugs Enhances Cell Death by Rewiring Apoptotic Signaling Networks. Cell. 2012;148:780–794. doi: 10.1016/j.cell.2012.03.031. [DOI] [PMC free article] [PubMed] [Google Scholar]
- Lu KV, Zhu S, Cvrljevic A, Huang TT, Sarkaria S, Ahkavan D, Dang J, Dinca EB, Plaisier SB, Oderberg I, et al. Fyn and SRC are effectors of oncogenic epidermal growth factor receptor signaling in glioblastoma patients. Cancer Res. 2009;69:6889–6898. doi: 10.1158/0008-5472.CAN-09-0347. [DOI] [PMC free article] [PubMed] [Google Scholar]
- Marusyk A, Almendro V, Polyak K. Intra-tumour heterogeneity: a looking glass for cancer? Nat Rev Cancer. 2012;12:323–334. doi: 10.1038/nrc3261. [DOI] [PubMed] [Google Scholar]
- Mellinghoff IK, Wang MY, Vivanco I, Haas-Kogan DA, Zhu S, Dia EQ, Lu KV, Yoshimoto K, Huang JH, Chute DJ, et al. Molecular determinants of the response of glioblastomas to EGFR kinase inhibitors. N Engl J Med. 2005;353:2012–2024. doi: 10.1056/NEJMoa051918. [DOI] [PubMed] [Google Scholar]
- Mendoza MC, Er EE, Blenis J. The Ras-ERK and PI3K-mTOR pathways: cross-talk and compensation. Trends Biochem Sci. 2011;36:320–328. doi: 10.1016/j.tibs.2011.03.006. [DOI] [PMC free article] [PubMed] [Google Scholar]
- Mortensen DS, Sapienza J, Lee BGS, Perrin-Ninkovic SM, Harris R, Shevlin G, Parnes JS, Whitefield B, Hickman M, Khambatta G, et al. Use of core modification in the discovery of CC214-2, an orally available, selective inhibitor of mTOR kinase. Bioorg Med Chem Lett. 2013;23:1588–1591. doi: 10.1016/j.bmcl.2013.01.110. [DOI] [PubMed] [Google Scholar]
- Muranen T, Selfors LM, Worster DT, Iwanicki MP, Song L, Morales FC, Gao S, Mills GB, Brugge JS. Inhibition of PI3K/mTOR leads to adaptive resistance in matrix-attached cancer cells. Cancer Cell. 2012;21:227–239. doi: 10.1016/j.ccr.2011.12.024. [DOI] [PMC free article] [PubMed] [Google Scholar]
- Nathanson D, Gini B, Mottahedeh J, Visnyei K, Koga T, Gomez G, Eskin A, Hwang K, Wang J, Masui K, et al. Targeted therapy resistance mediated by dynamic regulation of extrachromosomal mutant EGFR DNA. Science. 2014;343:72–76. doi: 10.1126/science.1241328. [DOI] [PMC free article] [PubMed] [Google Scholar]
- Pisco AO, Brock A, Zhou J, Moor A, Mojtahedi M, Jackson D, Huang S. Non-Darwinian dynamics in therapy-induced cancer drug resistance. Nat Commun. 2013;4:2467. doi: 10.1038/ncomms3467. [DOI] [PMC free article] [PubMed] [Google Scholar]
- Rodrik-Outmezguine VS, Chandarlapaty S, Pagano NC, Poulikakos PI, Scaltriti M, Moskatel E, Baselga J, Guichard S, Rosen N. mTOR kinase inhibition causes feedback-dependent biphasic regulation of AKT signaling. Cancer Discov. 2011;1:248–259. doi: 10.1158/2159-8290.CD-11-0085. [DOI] [PMC free article] [PubMed] [Google Scholar]
- Rodrik-Outmezguine VS, Yao Z, Mukherjee R, Cai L, Barratt D, Ward R, Klinowska T, De Stanchina E, Berger M, Baselga J, Rosen N. Acquired resistance to rapamycin and mTOR kinase inhibitors is mediated by non-overlapping mutations in distinct sites in the mTOR protein. [abstract]. Cancer Res; Proceedings of the 105th Annual Meeting of the American Association for Cancer Research; 2014 Apr 5–9; San Diego, CA. Philadelphia (PA): AACR; 2014. p. 1726. [Google Scholar]
- Sarkaria JN, Yang L, Grogan PT, Kitange GJ, Carlson BL, Schroeder MA, Galanis E, Giannini C, Wu W, Dinca EB, James CD. Identification of molecular characteristics correlated with glioblastoma sensitivity to EGFR kinase inhibition through use of an intracranial xenograft test panel. Mol Cancer Ther. 2007;6:1167–1174. doi: 10.1158/1535-7163.MCT-06-0691. [DOI] [PubMed] [Google Scholar]
- Schonberg DL, Lubelski D, Miller TE, Rich JN. Brain tumor stem cells: Molecular characteristics and their impact on therapy. Mol Aspects Med. 2014;39:82–101. doi: 10.1016/j.mam.2013.06.004. [DOI] [PMC free article] [PubMed] [Google Scholar]
- Shi Q, Qin L, Fan R, Wei W, Guo D, Shin YS, Hood L, Mischel PS, Heath JR. Single Cell Proteomic Chip for Profiling Intracellular Signaling Pathways in Single Tumor Cells. Proc Nat Acad Sci USA. 2012;109:419–425. doi: 10.1073/pnas.1110865109. [DOI] [PMC free article] [PubMed] [Google Scholar]
- Sunayama J, Matsuda KI, Sato A, Tachibana K, Suzuki K, Narita Y, Shibui S, Sakurada K, Kayama T, Tomiyama A, Kitanaka C. Crosstalk Between the PI3K/mTOR and MEK/ERK Pathways Involved in the Maintenance of Self-Renewal and Tumorigenicity of Glioblastoma Stem-Like Cells. Stem Cells. 2010;28:1930–1939. doi: 10.1002/stem.521. [DOI] [PubMed] [Google Scholar]
- Wacker SA, Houghtaling BR, Elemento O, Kapoor TM. Using transcriptome sequencing to identify mechanisms of drug action and resistance. Nat Chem Biol. 2012;8:235–237. doi: 10.1038/nchembio.779. [DOI] [PMC free article] [PubMed] [Google Scholar]
- Wagle N, Grabiner BC, Van Allen EM, Amin-Mansour A, Taylor-Weiner A, Rosenberg M, Gray N, Barletta JA, Guo Y, Swanson SJ, et al. Response and acquired resistance to everolimus in anaplastic thyroid cancer. N Engl J Med. 2014;371:1426–1433. doi: 10.1056/NEJMoa1403352. [DOI] [PMC free article] [PubMed] [Google Scholar]
- Wang J, Hwang K, Brass D, Dooraghi A, Nathanson D, Campbell DO, Gu J, Sandberg T, Mischel PS, CGR, et al. Fast Metabolic Response to Drug Intervention through Analysis on a Miniaturized, Highly Integrated Molecular Imaging System. J Nucl Med. 2013;54:1820–1824. doi: 10.2967/jnumed.112.118497. [DOI] [PMC free article] [PubMed] [Google Scholar]
- Ward JH. Hierarchical Grouping to Optimize an Objective Function. J Am Stat Assoc. 1963;58:236–244. [Google Scholar]
- Wei W, Shi Q, Remacle F, Qin L, Shackelford D, Shin YS, Mischel PS, Levine RD, Heath JR. Hypoxia Induces a Phase Transition within a Kinase Signaling Network in Cancer Cells. Proc Nat Acad Sci USA. 2013;110:E1352–E1360. doi: 10.1073/pnas.1303060110. [DOI] [PMC free article] [PubMed] [Google Scholar]
- Wu AR, Neff NF, Kalisky T, Dalerba P, Treutlein B, Rothenberg ME, Mburu FM, Mantalas GL, Sim S, Clarke MF, Quake SR. Quantitative assessment of single-cell RNA-sequencing methods. Nat Methods. 2014;11:41–46. doi: 10.1038/nmeth.2694. [DOI] [PMC free article] [PubMed] [Google Scholar]
- Zhang H, Cicchetti G, Onda H, Koon HB, Asrican K, Bajraszewski N, Vazquez F, Carpenter CL, Kwiatkowski DJ. Loss of Tsc1/Tsc2 activates mTOR and disrupts PI3K-Akt signaling through downregulation of PDGFR. J Clin Invest. 2003;112:1223–1233. doi: 10.1172/JCI17222. [DOI] [PMC free article] [PubMed] [Google Scholar]
Associated Data
This section collects any data citations, data availability statements, or supplementary materials included in this article.