Abstract
The main complications of zirconia-based laminated systems are chipping and delamination of veneering porcelain, which has been found to be directly associated with the development of residual thermal stresses in the porcelain layer. This study investigates the effects of cooling rate and specimen geometry on the residual stress states in porcelain-veneered zirconia structures. Bilayers of three different shapes (bars, semi-cylindrical shells, and arch-cubic structures) with 1.5 mm and 0.7 mm thickness of dentin porcelain and zirconia framework, respectively, were subjected to two cooling protocols: slow cooling (SC) at 32 °C/min and extremely-slow cooling (XSC) at 2 °C/min. The residual thermal stresses were determined using the Vickers indentation method and validated by finite element analysis. The residual stress profiles were similar among geometries in the same cooling protocol. XSC groups presented significantly higher tensile stresses (p = 0.000), especially for curved interfaces. XSC is a time-consuming process that showed no beneficial effect regarding residual stresses compared to the manufacturer recommended slow cooling rate.
Keywords: Porcelain-veneered zirconia, Residual thermal stresses, Cooling rates, Specimen geometries, Vickers indentation method, Finite element analysis
1. Introduction
Zirconia-based materials have become increasingly popular among patients because of their good aesthetics in mimicking natural teeth [1,2]. For dentists and dental laboratories, CAD/ CAM systems are appealing due to reduced treatment time and specialized labor. In addition, the prefabricated blocks are almost flawless, since the processing and sintering were performed under highly controlled conditions. However, unless kept extremely thin (<0.5 mm), most of the zirconia available in the market is opaque [3] and needs a layer of porcelain to achieve the expected esthetics. This veneering layer remains the weak link for all-ceramic dental prostheses [4,5]. The main complications reported in zirconia-based systems are the chipping and delamination of the porcelain veneer, which has been directly linked to the development of thermal residual stress in the porcelain layer [6,7].
In order to reduce the risk of veneer chipping, residual stresses in the porcelain overlay have been extensively investigated [8–14]. Together with the CTE mismatch, the thermal gradient has been identified as the main cause of porcelain chipping [7,10]. The low thermal diffusivity of zirconia creates a steep temperature gradient, especially in fast cooling protocols. As a result, the global thermal residual stress in the porcelain layer increases significantly because there is no sufficient time for viscoelastic relaxation above its glass transition temperature (Tg). In extreme cases, fast cooling rates can lead to thermal shock in the ceramic system, ultimately causing spontaneous cracking [15,16]. Nowadays, the dental community is well aware of the detrimental effect of fast cooling rates on ceramics with low thermal diffusivity. Thus, most manufacturers recommend a relatively slow cooling rate for porcelain veneered zirconia, which is achieved by keeping the furnace door closed until the furnace temperature falls below the Tg temperature of porcelain. Moreover, some protocols suggest extremely slow cooling rates until room temperature is reached [11,13]. However, an extremely slow cooling can potentially induce additional residual stresses in the porcelain layer due to microstructural changes [17].
Different methodologies have been used to study the residual stress in bilayer specimens: analytical models [6,18], the hole-drilling method [19,20], optical birefringence technique [7,21], Vickers indentation method [8, 22–24] and finite element analysis [10,25]. Some of these methods can estimate the residual stresses only in simple bilayer geometries, e.g. disks and bars. However, thermal stresses are dependent on the specimen geometry and it has been observed that the curved porcelain-zirconia interface plays an important role in the residual stress distribution of dental crowns [21,25]. Therefore, it is important to define a specimen shape that can be easily standardized within different methodologies, yet includes clinical relevant aspects of a curved interface and large porcelain volume in the cusp region.
Accordingly, the aim of this study was to investigate the effects of cooling rate (i.e. slow cooling or extremely-slow cooling) and geometry complexity (from bars to shells to arch-cubic shapes) on the residual stress states in porcelain-veneered zirconia structures. The residual thermal stresses were determined using the Vickers indentation method (VIM) and evaluated by finite element analysis (FEA). Two hypotheses were tested: (1) an extremely slow cooling rate would not reduce the global residual thermal stress when compared to the manufacturer recommended slow cooling protocol, and (2) curved specimens would result in higher residual stresses relative to flat specimens.
2. Materials and methods
2.1. Sample preparation
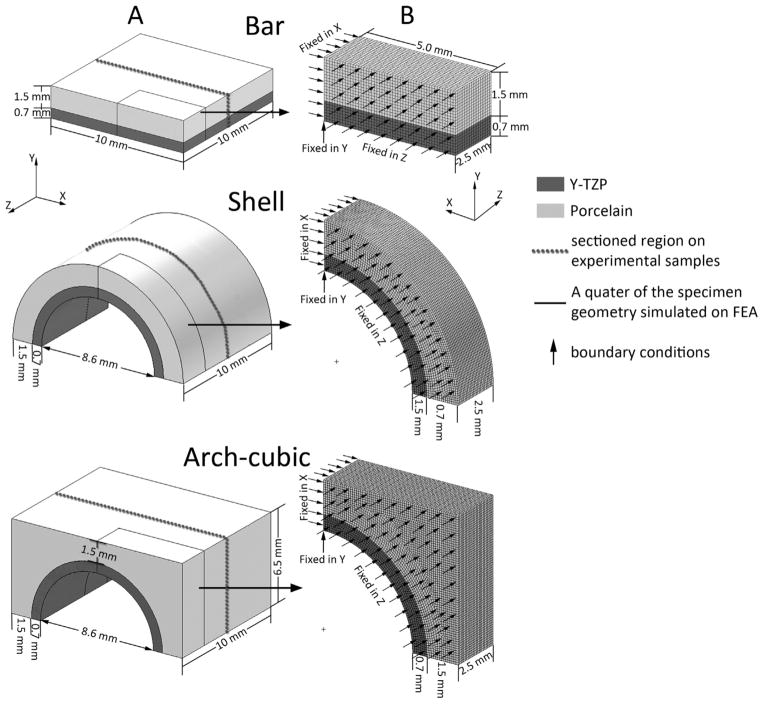
Pre-sintered Y-TZP blocks (Lava™ Plus High Translucency Zirconia Blocks without color ion shading, 3M ESPE St. Paul, Minnesota, USA) were CAD/CAM milled and sintered to obtain two 0.7 mm thick framework shapes: bars and semi-cylindrical shells (Fig. 1). Three zirconia frameworks were prepared for each geometry. Prior to veneering, the surfaces of zirconia frameworks were sandblasted with 50 μm Al2O3 particles for 5 s at a standoff distance of 10 mm and a compressed air pressure of 2 bars. We only modified the framework surface with sandblasting, since a previous study showed that the application of an adhesive glass interlayer between the zirconia framework and porcelain veneer had little effect on the veneer/core bonding strength [26]. The frameworks were hand-veneered by an experienced technician to create bilayers of three shapes: bars, semi-cylindrical shells, and arch-cubic structures. The final thickness of 1.5 mm dentin porcelain (VITA VM9 base dentine 3M2, VITA Zahnfabrik, Germany) was attained through two firing cycles. The firing cycles followed manufacturer's specifications: the final temperatures of 910 °C (first porcelain firing) and 900 °C (second firing), a heating rate of 55 °C/min from 500 °C to final temperature, and a holding time at the final sintering temperature of 1 min. Finally, all specimens were glaze fired at a heating rate of 60 °C/min from 450 °C to 900 °C, followed by 1 min holding time. Six bar-shaped monolithic porcelain specimens were prepared and used as an unstressed control group.
Fig. 1.
Specimens' details. A: Schematic of as manufactured samples, cut in half (dotted line) which resulted in the dimensions of experimental specimens. Solid lines highlight the 1/4 specimen represented in the finite element model. B: Finite element mesh and boundary conditions. Note that the FEA models in (B) are rotated 180° in relation to the whole specimen representation in (A) for a better view of fixed boundary conditions.
After sintering, all specimens were cut into two 5.0 mm-wide halves using a diamond blade (Isomet 2000, Buehler, Lake Bluff, USA), resulting in a total of 6 samples for each geometry. On the side to be indented, the surface was grinded with 600 grit SiC abrasive paper and polished with diamond suspensions of 9, 6, 3 and 1 μm (Buehler, Lake Bluff, USA). After polishing, a last firing was applied to relieve stresses induced from cutting and polishing as well as to establish the residual thermal stresses in bilayer structures. All samples were subjected individually to the last firing cycle, starting from 450 °C and ending at 700 °C, with a heating rate of 60 °C/min and 1 min holding time. Upon cooling, two distinct protocols, slow cooling (n = 3) and extremely-slow cooling (n = 3), were applied.
2.2. Cooling protocols
Slow cooling (SC) was controlled by keeping the furnace (Lindberg/Blue M, Thermo Fisher Scientific Inc., Waltham, USA) door closed until reaching 450 °C, which is below the Tg temperature of porcelain. The cooling rate of the SC protocol was approximately 32 °C/min from 700 to 450 °C. Then, the samples were removed from the furnace and cooled in ambient air to room temperature (25 °C).
For the extremely-slow cooling (XSC) protocol, the specimens were cooled at 2 °C/min in a closed furnace from the last firing temperature until 25 °C.
2.3. Vickers indentation method (VIM)
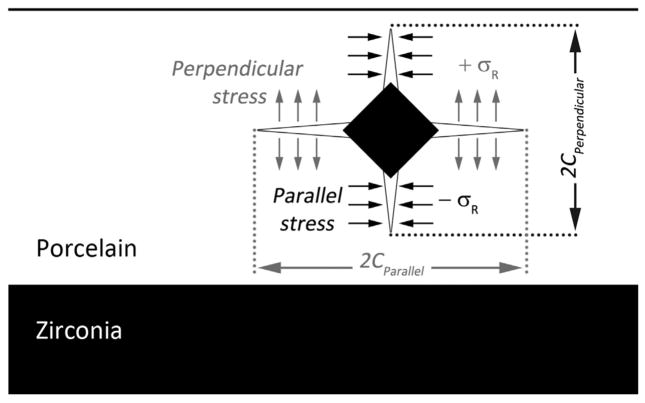
Vickers indentations were performed on the polished surfaces using a peak load of 4.9 N and a dwell time of 5 s. Three rows of 20 indentations were made: they were located approximately 0.4, 0.8, and 1.3 mm from the veneer/core interface. The Vickers indenter was positioned so that one of its orthogonal axes was oriented parallel to the veneer/core interface, in order to keep corner cracks either parallel or perpendicular to the veneer/core interface. Indentations were separated by at least twice the crack length to prevent interactions. Images of crack patterns were taken immediately after indentation using the microindentation tester imaging system (Leco, St. Joseph MI, USA).
Indentations that caused lateral chipping were excluded from the analysis. The magnitude and sign of the residual stresses (σR) were determined according to Eq. (1) [27]:
| (1) |
where ψ = 1.24 is a crack geometry factor for half-penny cracks [27]. C0 and C1 are the indentation crack lengths in unstressed monolithic porcelain and stressed bilayer (core/veneer) specimens, respectively. K1C is the fracture toughness of the porcelain veneer (VM9, Vita Zahnfabrik, K1C = 1.0 MPa m1/2). The stress value obtained from Eq. (1) may be positive (C1 > C0) or negative (C1 <C0), depending upon whether the stresses are tensile or compressive, respectively, in nature.
A schematic of an indentation impression is shown in Fig. 2. The length of the perpendicular cracks was used to calculate the parallel residual stress (Eq. (1)), while the length of parallel cracks was used for perpendicular residual stress.
Fig. 2.
Schematic of the indentation pattern associated with Vickers indentation and crack dimensions used for residual stress calculations. Perpendicular and parallel terms are relative to the veneer/core interface.
2.4. X-ray diffraction analysis
X-ray diffraction analysis was performed to identify crystal phases in the porcelain veneer layer. One sample of each cooling protocol (SC and XSC) was scanned at three different regions located 0.4, 0.8, 1.3 mm from the interface. Samples were scanned from 15° to 45° 2θ with Cu radiation (Bruker D8DISCOVER, MA, USA). Phase identification was carried out using the diffractometer software (Bruker D8 DISCOVER GADDS).
2.5. Statistical analysis
One-way ANOVA with post-hoc Tukey HSD test were performed to compare residual stresses in different sample shapes (bars, semi-cylindrical shells and arch-cubic structures) and between different cooling rates (SC vs. XSC) among specimens within the same geometry group (α = 0.05; SigmaPlot 11.0, Ashburn, VA, USA). Residual stresses at different distances from the interface (0.4, 0.8 and 1.3 mm) were compared by one-way repeated measures ANOVA (α = 0.05; SigmaPlot 11.0, Ashburn, VA, USA), separately for residual stresses in parallel and perpendicular directions.
2.6. Finite element analysis
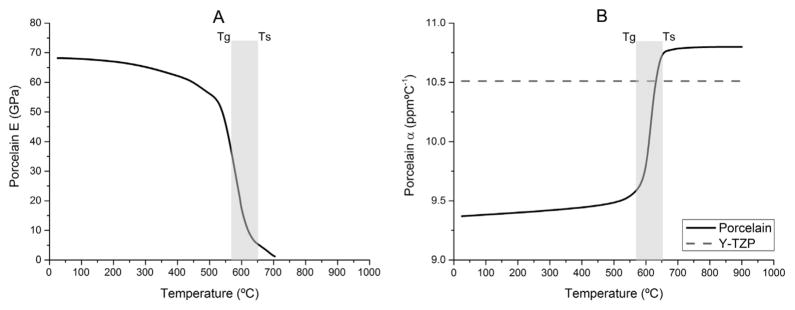
A 3D finite element analysis (FEA) was performed to complement the experimental data. Only a quarter of the specimen geometry was represented, due to the symmetric nature of the specimens and boundary conditions (Fig. 1). A mesh was generated with hexahedral elements and a convergence test was applied to ensure that a fine enough element discretization has been used. The materials’ thermal and mechanical properties are presented in Table 1 and Fig. 2. The FE analysis was divided into two steps using MSC.MarcMentat (MSC Software, Santa Ana, CA, USA), as described below.
Table 1.
Thermal and mechanical properties of the materials.
| Conductivity (W/mm °C) | Specific heat (J/kg °C) | Density (kg/mm3) | Elastic modulus (GPa) | Poisson's ratio | α solid (ppm °C−1) | References | |
|---|---|---|---|---|---|---|---|
| Y-TZP | 2.0 × 10⁻³ | 450 | 6.0 × 10⁻⁶ | 205 | 0.30 | 10.5 | [33,34] |
| Veneering porcelain | 1.5 × 10⁻³ | 840 | 2.4 × 10⁻⁶ | Fig. 3 | 0.25 | 9.3a | [32,34] |
Data measured by the Edward Orton Jr. Ceramic Foundation.
Firstly, two heat transfer analyses were performed for each geometry to create cooling profiles similar to experimental SC and XSC protocols. For the SC model, the initial temperature was set at 700 °C (above Tg), which corresponds to the last firing temperature applied in the experimental test. The cooling rates used in finite element analysis were adjusted based on cooling curves determined experimentally. A heat transfer coefficient of 9.0 W/m2 was applied to the veneering porcelain external surface. In this case, it was considered that there was not enough time for stress relaxation above Tg. For XSC simulation, a heat transfer coefficient of 0.7 W/m2 was used. For this cooling protocol, it was assumed that all stresses generated above Tg were relieved due to viscoelastic relaxation. Therefore, the initial temperature was set at 600 °C, which represents the porcelain Tg.
Secondly, a thermal stress analysis was done using the thermal profile outputs of the first analysis as input data. Changes in the coefficient of thermal expansion and elastic modulus of the porcelain as the cooling temperature passed through the glass transition zone were included only for the SC model, since their initial temperature was above Tg (Fig. 3).
Fig. 3.
A: The porcelain elastic modulus (E) profile across the glass transition zone [32]. B: The porcelain coefficient of thermal contraction (α) profile across the glass transition zone. CTE values were measured for temperatures up to 700 °C (Orton dilatometer model 1000D) by the Edward Orton Jr. Ceramic Foundation.
The nodes of symmetry planes were fixed in x or z direction (Fig. 1) and a single node at the intersection of these two planes was restricted in y-direction to avoid rigid body motion. Perpendicular and parallel stresses were obtained for all models along the segment AB (Fig. 4). For bar specimens, perpendicular and parallel stresses were coincident with the Y-component and X-component, respectively. For shell and arch-cubic specimens, the following formulas were used, in which θ = 45°:
| (2) |
| (3) |
Fig. 4.
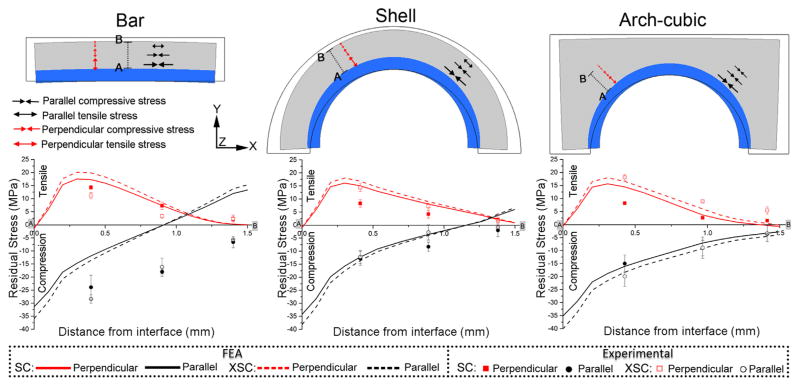
Deformed specimens after the final firing cycle; solid lines represent the stress free model. Parallel and perpendicular stress distribution in bar, shell and arch-cubic models. Residual stress values through porcelain thickness (from A to B) and vector direction for 0.4, 0.8 and 1.3 mm from the interface. Graphs show FEA stress profiles through A to B and data points from experimental data.
3. Results
In Fig. 4, residual stresses are presented as a function of the distance from the interface, along the line segment AB. The square and circle symbols represent the experimental data, whereas the curves are FEA predictions. In all cases, experimental data revealed that residual thermal stresses were significantly higher (p = 0.000) near the veneer/core interface for both tension and compression (in the direction parallel and perpendicular to the interface, respectively). Both stresses decreased as the distance from the interface increased and eventually reached near-zero stress at the porcelain surface. There was no statistically significant difference in residual stresses between geometries in the perpendicular direction (p = 0.571). However, there was a statistical difference in the parallel direction (p = 0.00).
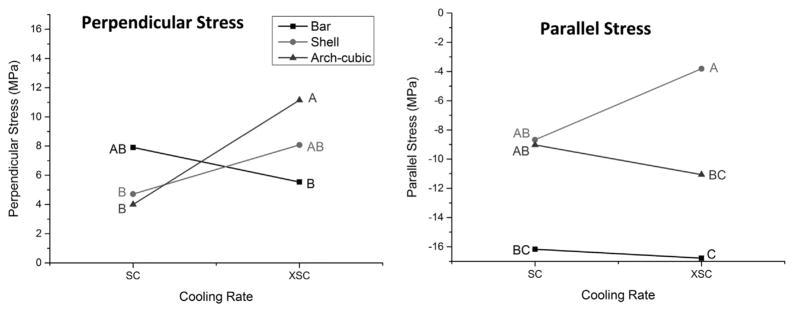
Significant pairwise comparison was found between the cooling rate and geometry (Fig. 5) in both directions (perpendicular stress, p = 0.003 and parallel stress, p = 0.038). For SC no significant difference was found among different geometries in both directions. However, for XSC, tensile residual stress (in the perpendicular direction) was significantly higher for arch-cubic geometry than that for bar (Fig. 5), whereas compressive residual stress (in the parallel direction) was higher for bar specimens than that for curved ones (shell and arch-cubic). Our experimental observations were partially supported by the FEA calculations; the models showed that the stress profiles were similar among the three geometries and the stresses were slightly higher for the XSC protocol. The maximum tensile stress occurred at approximately 0.25 mm from the porcelain/zirconia interface, with an orientation perpendicular to the interface. The maximum compressive stress appeared at the interface (point A), in the direction parallel to the interface.
Fig. 5.
Significant pairwise comparison between cooling rate and geometry for the perpendicular stress (p = 0.003) and parallel stress (p = 0.038). Mean values followed by same letters denote non-significant differences according to Tukey's test (P<0.05).
A major advantage of FEA is its ability to provide full-field stress analysis. Several interesting findings can be derived from the FEA stress profiles. (1) The XSC groups presented slightly higher tensile stresses and higher compressive stresses throughout the segment AB, when compared to the respective SC groups. (2) Bar and shell specimens showed compressive parallel stresses in two-thirds of the veneer thickness from the zirconia interface, but tensile parallel stress in the one-third close to the porcelain free surface. In contrast, arch-cubic presented compressive parallel stresses throughout the AB segment. (3) Comparing bar and shell specimens, the distance at which the compressive parallel stress curve crossed the x-axis and intersected with the perpendicular stress curve was smaller for the former, which resulted in a narrower zone (0.9 mm) of compressive stress in bar porcelain layer. For arch-cubic specimens, the parallel compressive stresses were present throughout the segment AB; however, the perpendicular compressive stresses were observed beyond point B. (4) For bar and shell specimens, tensile perpendicular stresses were observed throughout the porcelain layer, with a magnitude approach to zero at both extremities of the AB segment. For arch-cubic specimens, the tensile perpendicular stress curve crossed the x-axis at 1.3 mm from interface, and presented a negative value from this point on.
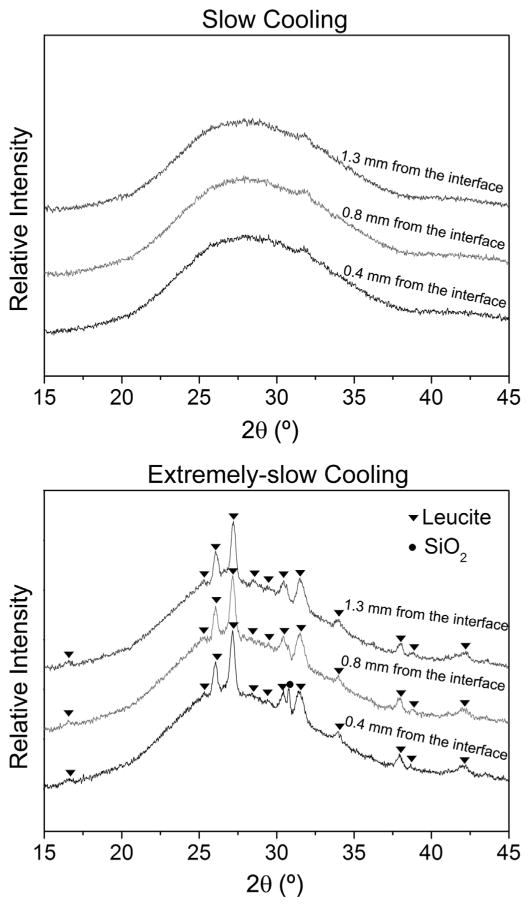
X-ray diffraction analysis (Fig. 5) revealed a predominantly amorphous glass phase in the porcelain overlay of specimens subjected to SC. However, for XSC specimens, leucite peaks were observed with similar intensities at the three scanned locations (0.4, 0.8, 1.3 mm from the veneer/core interface, respectively).
4. Discussion
According to FEA and experimental residual stress data, the first hypothesis was accepted. The XSC protocol did not result in lower residual stresses compared to the SC protocol. This result disagrees with the majority of the studies, which suggest that a slow cooling rate is important to reduce the residual thermal stresses in the porcelain veneer [6,7]. However, the lack of a clear definition on what is considered slow cooling may create some misunderstandings.
In the present study, “slow cooling” refers to the protocol in which the cooling rate was low until slightly below the porcelain Tg. Some authors (Table 2) [8–10, 14] have reported favorable results with the same protocol compared to fast cooling, in which the furnace door was opened immediately at the end of the firing cycle.
Table 2.
Comparison among studies that evaluated different slow cooling methods.
| Author, year (Ref) | Label used | Description of the cooling rate | Porcelain | Tg (°C) |
|---|---|---|---|---|
| Al-Amleh, 2014 [8] | Slow | Cooling at 20 °C/min from final glaze temperature (725 °C) to 400 °C. | IPS e.max ZirPress | 530 |
| IPS e.maxCeram | 490 | |||
| Belli, 2013 [9] | Slow | At final glaze temperature, the door of the furnace was opened only 10%, until the temperature reached 200 °C. | VM9 | 600 |
| Lava Ceram | 565 | |||
| Benetti, 2014 [10] | Slow | The chamber was kept closed until the furnace reached 50 °C below the Tg. | Lava Ceram | 557 |
| Vita Omega 900 | 594 | |||
| VM9 | 600 | |||
| Zirox | 570 | |||
| Lava Ceram | 565 | |||
| Tan, 2012 [14] | Slow | The specimen was left in the partially (30%) open mufffle for 15 minutes until a mufffle temperature of 500 °C was reached. | VM9 | 600 |
| Mainjot, 2011 [13] | Slow | Cooling at 2 °C/min in a special furnace (Carbolite LMF 12/2, Carbolite, Hope Valley, UK), from 900 °C to room temperature. | ||
| Modified | Cooling from 900 °C to 600 °C with furnace closed. | |||
| Choi, 2011 [11] | Slow | The furnace was kept closed from final sintering temperature to 100 °C. Which took approximately 30–40 min depending on the firing cycle used. | Vita PM9 | 640 |
| Normal | The furnace was kept closed until temperature drops to the starting temperature of the glazing cycle. | IPS e.max Zirpress | 530 | |
| Wieland Xzr | 620 | |||
| CZR | 615 |
On the other hand, two other studies [13,28] used different denominations for protocols equivalent to “slow cooling” used in this study and called “slow” a protocol similar to the “extremely-slow” in the present study, in which the cooling rate remained low until it reached the room temperature (Table 2). For both studies, there was no difference between SC (referred to as “modified” [13] or “normal” [28]) and XSC protocols, which agrees with the results of the present study. In those studies, the effect of cooling protocol was noteworthy when a fast cooling protocol was used.
Apparently, the cooling rate is a critical factor only above porcelain Tg, when residual tempering stresses can be locked into the veneer due to a high thermal gradient. Below the glass transformation temperature, molecular rearrangements are more restricted and the temperature gradient will be significant only for transient stresses. In this case, the residual stresses will be determined primarily by CTE mismatch.
It was hypothesized that the extremely slow cooling rates below porcelain Tg could influence the residual stress due to porcelain crystallization. The crystalline phase has a much larger CTE relative to the glass matrix [29], which tends to develop additional residual stresses in the porcelain layer with compression in leucite particles and tension stresses in the glass matrix. The XRD analysis confirmed the occurrence of porcelain crystallization for extremely-slow cooling specimens (Fig. 5). This crystallization was sufficient to induce a statistically significant difference (p = 0.019) in tensile residual stress between SC and XSC groups.
The second hypothesis was that the residual tensile stress would be higher in curved interfaces. Although a statistical difference was observed between bar and arc-cubic for XSC group (Fig. 5), it should not be assumed that the curvature increased the stress concentration, since no difference was observed between the bar and curved specimen, nor for SC specimens.
These results are probably due to the fact that the curved interfaces were examined through just one plane of the specimen (XY plane), with a relatively large curvature radius. Previous studies [21,25] observed higher stress concentration at curved regions when dental crown-shaped specimens were used, in which the curvature was present in two orientations (transversal and longitudinal planes), and with a small curvature radius close to the cusps. In addition, the stress concentration observed in these studies [21,25] may be associated to the stiffness provided by the occlusal plateau of the Y-TZP core.
The three tested geometries presented similar FEA stress profiles. In addition, FEA predictions were in good accordance with VIM residual stress data (Fig. 4). This high correspondence between FEA and the experiments could be observed because the stress components of interest in this study were specifically isolated in both methods. Except for bar specimens, in which the experimental compressive parallel stresses were slightly higher and did not turn to tension near the porcelain surface. That difference might be attributed to the fact that the bar specimens were maintained aslope in the furnace, and bending due to its own weight could have taken place especially at high temperatures, changing the stress states.
The studies available with analytical solutions of thermal residual stress of bilayer specimens have calculated the stress in just one orientation: parallel to interface [6,18,30,31]. Comparing our parallel stress profile with these studies, a good agreement was observed in specimens with similar core/veneer thickness ratio. This profile is also coherent with the thermal stress theory of the bilayer specimen in which parallel compressive stresses arise in the lower CTE material (porcelain) by the greater contraction of the higher CTE material (zirconia). This positive mismatch (αzirconia > αporcelain) tends to bend the specimen towards the zirconia layer, and depending upon the veneer/core thickness ratio. This bending can change the parallel stress from compression (close to interface) to tensile (close to porcelain surface), justifying the inversion of parallel stress profile observed in Fig. 4. According to Hsueh et al.[18], this inversion is usually observed with a low core/veneer thickness ratio (ratio<1). When the core/veneer ratio is high (ratio > 1), only parallel compression is usually seen in the porcelain layer due to CTE mismatch.
One Fig. 6 of the VIM studies on veneered zirconia specimen [23] also calculated the residual stress in two orientations, and the reported general stress state is in agreement with the present study. They found radial tensile stress (perpendicular to interface) and compressive hoop stress (parallel to interface) in a transversal section of a fixed partial denture. However, the majority of VIM studies [8,28] did not distinguish the orientation of indenter diagonals, and the residual stress was calculated based on the average of the four crack lengths for each indentation. In this case, a comparison with our results is inappropriate.
Fig. 6.
XRD spectra of the porcelain veneer at 0.4, 0.8 and 1.3 mm from the interface for the two different cooling protocols (SC and XSC). Note: the XRD locations coincide with the three rows of Vickers indentation.
Our FEA model neglected the viscoelastic behavior of porcelain at the temperature above its Tg. Therefore, the true stress profiles, especially near the veneer/core interface, might not be captured accurately. Future study using an advanced viscoelastic finite element method is necessary. In addition, the current model also failed to account for potential thermal stresses induced from crystallization of the glass matrix and possible zirconia phase transformation under the XSC condition. However, these simplifications do not significantly compromise the general conclusions of this study.
5. Conclusion
This study has shown that extremely-slow cooling is a time-consuming process and has a deleterious effect on laminated ceramic materials regarding residual stresses compared with the manufacturer recommended slow cooling rate. The anticipated higher stresses in curved interfaces were observed in XSC groups.
Supplementary Material
Acknowledgments
Funding was provided by the United States National Institutes of Health, National Institute of Dental and Craniofacial Research (Grant 2R01 DE017925) and the National Science Foundation (Grant CMMI-0758530). The authors acknowledge the Brazilian agencies CAPES (BEX 4909/13-5) and FAPESP (2012/17094-5; 2013/06988-8) for the financial support of the Ph.D student Carina B. Tanaka to conduct research at the New York University College of Dentistry as a visiting scholar.
Footnotes
Conflict of interest
All authors declare no conflict of interest.
References
- 1.Fehmer V, et al. Criteria for the selection of restoration materials. Quintessence Int. 2014;45(9):723–730. doi: 10.3290/j.qi.a32509. [DOI] [PubMed] [Google Scholar]
- 2.Zembic A, et al. Eleven-year follow-up of a prospective study of zirconia implant abutments supporting single all-ceramic crowns in anterior and premolar regions. Clin Implant Dent Relat Res. 2014 doi: 10.1111/cid.12263. [DOI] [PubMed] [Google Scholar]
- 3.Zhang Y. Making yttria-stabilized tetragonal zirconia translucent. Dent Mater. 2014;30(10):1195–1203. doi: 10.1016/j.dental.2014.08.375. [DOI] [PMC free article] [PubMed] [Google Scholar]
- 4.Triwatana P, Nagaviroj N, Tulapornchai C. Clinical performance and failures of zirconia-based fixed partial dentures: a review literature. J Adv Prosthodont. 2012;4(2):76–83. doi: 10.4047/jap.2012.4.2.76. [DOI] [PMC free article] [PubMed] [Google Scholar]
- 5.Zhang Y, et al. Edge chipping and flexural resistance of monolithic ceramics. Dent Mater. 2013;29(12):1201–1208. doi: 10.1016/j.dental.2013.09.004. [DOI] [PMC free article] [PubMed] [Google Scholar]
- 6.Swain MV. Unstable cracking (chipping) of veneering porcelain on all-ceramic dental crowns and fixed partial dentures. Acta Biomater. 2009;5(5):1668–1677. doi: 10.1016/j.actbio.2008.12.016. [DOI] [PubMed] [Google Scholar]
- 7.Tholey MJ, Swain MV, Thiel N. Thermal gradients and residual stresses in veneered Y-TZP frameworks. Dent Mater. 2011;27(11):1102–1110. doi: 10.1016/j.dental.2011.08.001. [DOI] [PubMed] [Google Scholar]
- 8.Al-Amleh B, et al. Influence of veneering porcelain thickness and cooling rate on residual stresses in zirconia molar crowns. Dent Mater. 2014;30(3):271–280. doi: 10.1016/j.dental.2013.11.011. [DOI] [PubMed] [Google Scholar]
- 9.Belli R, et al. Thermal-induced residual stresses affect the lifetime of zirconia–veneer crowns. Dent Mater. 2013;29(2):181–190. doi: 10.1016/j.dental.2012.11.015. [DOI] [PubMed] [Google Scholar]
- 10.Benetti P, et al. Influence of thermal gradients on stress state of veneered restorations. Dent Mater. 2014;30(5):554–563. doi: 10.1016/j.dental.2014.02.020. [DOI] [PubMed] [Google Scholar]
- 11.Choi JE, et al. Pressed ceramics onto zirconia. Part 1: comparison of crystalline phases present, adhesion to a zirconia system and flexural strength. Dent Mater. 2011;27(12):1204–1212. doi: 10.1016/j.dental.2011.08.006. [DOI] [PubMed] [Google Scholar]
- 12.Gostemeyer G, et al. Influence of cooling rate on zirconia/veneer interfacial adhesion. Acta Biomater. 2010;6(12):4532–4538. doi: 10.1016/j.actbio.2010.06.026. [DOI] [PubMed] [Google Scholar]
- 13.Mainjot AK, et al. Influence of cooling rate on residual stress profile in veneering ceramic: measurement by hole-drilling. Dent Mater. 2011;27(9):906–914. doi: 10.1016/j.dental.2011.05.005. [DOI] [PubMed] [Google Scholar]
- 14.Tan JP, et al. The use of slow heating and slow cooling regimens to strengthen porcelain fused to zirconia. J Prosthet Dent. 2012;107(3):163–169. doi: 10.1016/S0022-3913(12)60050-X. [DOI] [PubMed] [Google Scholar]
- 15.DeHoff PH, et al. Thermal compatibility of dental ceramic systems using cylindrical and spherical geometries. Dent Mater. 2008;24(6):744–752. doi: 10.1016/j.dental.2007.08.008. [DOI] [PMC free article] [PubMed] [Google Scholar]
- 16.Guazzato M, et al. Influence of thickness and cooling rate on development of spontaneous cracks in porcelain/zirconia structures. Aust Dent J. 2010;55(3):306–310. doi: 10.1111/j.1834-7819.2010.01239.x. [DOI] [PubMed] [Google Scholar]
- 17.Mackert JR, Butts MB, Fairhurst CW. The effect of the leucite transformation on dental porcelain expansion. Dent Mater. 1986;2(1):32–36. doi: 10.1016/s0109-5641(86)80067-7. [DOI] [PubMed] [Google Scholar]
- 18.Hsueh CH, et al. Analyses of layer-thickness effects in bilayered dental ceramics subjected to thermal stresses and ring-on-ring tests. Dent Mater. 2008;24(1):9–17. doi: 10.1016/j.dental.2006.12.009. [DOI] [PubMed] [Google Scholar]
- 19.Fukushima KA, et al. Residual stress profiles in veneering ceramic on Y-TZP, alumina and ZTA frameworks: measurement by hole-drilling. Dent Mater. 2014;30(2):105–111. doi: 10.1016/j.dental.2013.10.005. [DOI] [PubMed] [Google Scholar]
- 20.Mainjot AK, et al. Residual stress measurement in veneering ceramic by hole-drilling. Dent Mater. 2011;27(5):439–444. doi: 10.1016/j.dental.2010.12.002. [DOI] [PubMed] [Google Scholar]
- 21.Belli R, et al. A photoelastic assessment of residual stresses in zirconia-veneer crowns. J Dent Res. 2012;91(3):316–320. doi: 10.1177/0022034511435100. [DOI] [PubMed] [Google Scholar]
- 22.Zhang Y, Allahkarami M, Hanan JC. Measuring residual stress in ceramic zirconia-porcelain dental crowns by nanoindentation. J Mech Behav Biomed Mater. 2012;6:120–127. doi: 10.1016/j.jmbbm.2011.11.006. [DOI] [PubMed] [Google Scholar]
- 23.Baldassarri M, et al. Residual stresses in porcelain-veneered zirconia prostheses. Dent Mater. 2012;28(8):873–879. doi: 10.1016/j.dental.2012.04.019. [DOI] [PMC free article] [PubMed] [Google Scholar]
- 24.Marshall DB, et al. The compelling case for indentation as a functional exploratory and characterization tool. J Am Ceram Soc. 2015;98(9):2671–2680. [Google Scholar]
- 25.Meira JB, et al. Residual stresses in Y-TZP crowns due to changes in the thermal contraction coefficient of veneers. Dent Mater. 2013;29(5):594–601. doi: 10.1016/j.dental.2013.03.012. [DOI] [PubMed] [Google Scholar]
- 26.Chai H, et al. On the interfacial fracture of porcelain/zirconia and graded zirconia dental structures. Acta Biomater. 2014;10(8):3756–3761. doi: 10.1016/j.actbio.2014.04.016. [DOI] [PMC free article] [PubMed] [Google Scholar]
- 27.Zeng KY, Rowcliffe D. Experimental-measurement of residual-stress field around a sharp indentation in class. J Am Ceram Soc. 1994;77(2):524–530. [Google Scholar]
- 28.Choi JE, Waddell JN, Swain MV. Pressed ceramics onto zirconia. Part 2: indentation fracture and influence of cooling rate on residual stresses. Dent Mater. 2011;27(11):1111–1118. doi: 10.1016/j.dental.2011.08.003. [DOI] [PubMed] [Google Scholar]
- 29.Ren L, Zhang Y. Sliding contact fracture of dental ceramics: principles and validation. Acta Biomater. 2014;10(7):3243–3253. doi: 10.1016/j.actbio.2014.03.004. [DOI] [PMC free article] [PubMed] [Google Scholar]
- 30.Hsueh CH, Kelly JR. Simple solutions of multilayered discs subjected to biaxial moment loading. Dent Mater. 2009;25(4):506–513. doi: 10.1016/j.dental.2008.10.002. [DOI] [PubMed] [Google Scholar]
- 31.Hsueh CH, Thompson GA. Appraisal of formulas for stresses in bilayered dental ceramics subjected to biaxial moment loading. J Dent. 2007;35(7):600–606. doi: 10.1016/j.jdent.2007.04.004. [DOI] [PubMed] [Google Scholar]
- 32.Mcgraw DA. A method for determining youngs modulus of glass at elevated temperatures. J Am Ceram Soc. 1952;35(1):22–27. [Google Scholar]
- 33.Guazzato M, Proos K, Quach L, Swain MV. Strength, reliability and mode of fracture of bilayered porcelain/zirconia (Y-TZP) dental ceramics. Biomaterials. 2004;25:5045–5052. doi: 10.1016/j.biomaterials.2004.02.036. [DOI] [PubMed] [Google Scholar]
- 34.O'Brien WJ. Dental materials and their selection. 3. Quintessence Publishing Co., Inc; Hanover Park, IL: 2002. [Google Scholar]
Associated Data
This section collects any data citations, data availability statements, or supplementary materials included in this article.


