Abstract
Development of advanced synthetic materials that can mimic the mechanical properties of non-mineralized soft biological materials has important implications in a wide range of technologies. Hierarchical lattice materials constructed with horseshoe microstructures belong to this class of bio-inspired synthetic materials, where the mechanical responses can be tailored to match the nonlinear J-shaped stress-strain curves of human skins. The underlying relations between the J-shaped stress-strain curves and their microstructure geometry are essential in designing such systems for targeted applications. Here, a theoretical model of this type of hierarchical lattice material is developed by combining a finite deformation constitutive relation of the building block (i.e., horseshoe microstructure), with the analyses of equilibrium and deformation compatibility in the periodical lattices. The nonlinear J-shaped stress-strain curves and Poisson ratios predicted by this model agree very well with results of finite element analyses (FEA) and experiment. Based on this model, analytic solutions were obtained for some key mechanical quantities, e.g., elastic modulus, Poisson ratio, peak modulus, and critical strain around which the tangent modulus increases rapidly. A negative Poisson effect is revealed in the hierarchical lattice with triangular topology, as opposed to a positive Poisson effect in hierarchical lattices with Kagome and honeycomb topologies. The lattice topology is also found to have a strong influence on the stress-strain curve. For the three isotropic lattice topologies (triangular, Kagome and honeycomb), the hierarchical triangular lattice material renders the sharpest transition in the stress-strain curve and relative high stretchability, given the same porosity and arc angle of horseshoe microstructure. Furthermore, a demonstrative example illustrates the utility of the developed model in the rapid optimization of hierarchical lattice materials for reproducing the desired stress-strain curves of human skins. This study provides theoretical guidelines for future designs of soft bio-mimetic materials with hierarchical lattice constructions.
Keywords: Hierarchical design, Lattice materials, Bio-inspired materials, Stress-strain curves, Horseshoe microstructure, Finite deformation
1. Introduction
Research over the last decade has yielded rapid and substantial advancements in the field of materials science that draws inspiration from the nature, as an important approach to the design and synthesis of new materials (Aizenberg, 2005; Capadona et al., 2008; Cranford et al., 2012; Kim et al., 2013; Ma et al., 2013; Morin, 2012; Ortiz and Boyce, 2008; Pokroy et al., 2009; Sanchez et al., 2005; Wegst et al., 2015; Wong, 2011). Among many examples, bio-inspired structural materials are of growing interest, due to utility of the types of complex and hierarchical micro/nano-structures that are found in most biological systems (Meyers et al., 2013; Ortiz and Boyce, 2008; Wegst et al., 2015). The mechanical and functional performances are attractive for applications in a wide range of engineered systems.
Two broad classes of structural materials can be found in biology (Meyers et al., 2013): 1) mineralized hard materials, mainly in the form of hierarchically assembled composites that combine minerals (e.g., calcium carbonate and amorphous silica) with organic polymer additives (e.g., collagen); and 2) non-mineralized soft materials, typically constructed with wavy, fibrous constituents (e.g., collagen, keratin and elastin) that are embedded in extracellular matrices. Representative examples of the former type include bone, seashell and teeth, which exhibit remarkable combinations of high stiffness and toughness. The underlying mechanisms of their extraordinary mechanical properties associate their resistance to fracture with hierarchical constructions of microstructures (Evans et al., 2001b; Gao et al., 2003; Jackson et al., 1988; Launey et al., 2010; Lin and Meyers, 2009; Schaffer et al., 1997; Song and Bai, 2001). In particular, the ‘brick-and-mortar’ arrangement of organic constituents and minerals enhances the fracture toughness, partially due to the deflection of cracks around the ‘bricks’ instead of through them (Launey et al., 2010). A number of synthetic materials with similar microstructure constructions were fabricated and characterized (Bonderer et al., 2008; Bouville, 2014; Mayer, 2005; Munch et al., 2008; Tang et al., 2003; Weiner and Addadi, 1997). Furthermore, both theoretical and computational models were developed to study the various mechanical properties (e.g., elastic modulus, ultimate strength, buckling resistance), to provide important guidelines for optimal design (Buehler et al., 2006; Ji, 2008; Ji and Gao, 2004, 2006, 2010; Ji et al., 2004; Kauffmann et al., 2005; Yao and Gao, 2007; Zhang et al., 2010; Zhang et al., 2011). By contrast, non-mineralized soft biological materials refer to biopolymers such as collagen and viscid spider silk, which possess simultaneously low elastic moduli, large levels of stretchability, and relatively high tensile strengths. Recent studies show that an unconventional J-shaped stress-strain curve, induced by molecular uncoiling and unkinking under low stress, can yield superior mechanical properties (Fratzl et al., 1998; Gautieri et al., 2011; Keten et al., 2010; Komatsu, 2010; Meyers et al., 2013; Miserez et al., 2009; Provenzano et al., 2002; Simmons et al., 1996). Despite promising applications in tissue engineering and biomedical devices, the development of soft synthetic materials with matching mechanical properties has received far less attention (Hong, 2011; Jang et al., 2015; Naik et al., 2014) compared to that of mineralized biological materials, in part due to the complex, irregularly distributed microstructures.
Recently, Jang et al. (2015) introduced a class of soft network composite material that embeds an ultralow-modulus (~ 3 kPa) matrix with an open, stretchable network as a structural reinforcement. The studied network consists of a hierarchical lattice pattern that combines two-dimensional (2D) lattice topologies (e.g., triangular, Kagome and honeycomb) of cellular materials (Chen et al., 1999; Deshpande et al., 2001; Evans et al., 2001a; Fleck and Qiu, 2007; Hutchinson and Fleck, 2006; Kang et al., 2014; Kang et al., 2013; Lu and Chen, 1999; Zhang et al., 2008) with stretchable horseshoe/serpentine microstructures (Hsu et al., 2009; Kim et al., 2011; Kim et al., 2008; Widlund et al., 2014). Preliminary finite element analyses (FEA) and experimental measurements (Jang et al., 2015) demonstrate that such hierarchical lattice materials can be tailored to match the nonlinear J-shaped stress-strain curves of human skin, thereby offering great promise for applications in tissue engineering (Naik et al., 2014; Yannas and Burke, 1980). Such J-shaped stress-strain curves combine soft, compliant mechanics and large levels of stretchability, with a huge modulus enhancement at large strain that offers a relatively high mechanical strength simultaneously. Integrating all of these mechanical attributes in a single system is very attractive for achieving a mechanically robust form of stretchable electronics (Jang et al., 2014) that could improve the survivability substantially in bio-integrated applications (Kim et al., 2011; Rogers et al., 2010; Xu et al., 2014; Yao and Zhu, 2014; Zhang et al., 2014). The underlying relations between the J-shaped stress-strain curves and the microstructure geometric parameters of hierarchical lattice materials require, however, a relevant mechanics theory, as the basis of a design approach for practical applications. Optimization of hierarchical lattice materials for desired nonlinear mechanical response is prohibitively time-consuming based on FEA. In this study, a theoretical model of hierarchical lattice materials is developed to study the deformation mechanisms and to predict the J-shaped stress-strain curves. Quantitative comparisons with FEA and experimental results illustrate its validity. Based on this model, analytic solutions were obtained for some key mechanical quantities (e.g., elastic modulus, peak modulus, Poisson ratio and critical strain around which the tangent modulus increases rapidly). Both negative and positive Poisson ratios were found in this class of hierarchical lattice materials, which show nonlinear and anisotropic characteristics at large levels of stretching. Furthermore, a demonstrative example shows that the developed model can be employed to enable rapid optimization of microstructure geometry for matching precisely the stress-strain curves of human skins.
The paper is outlined as follows. Section 2 illustrates the design concept and geometry of the hierarchical lattice materials. Section 3 describes a finite deformation model of the building block, i.e., a filamentary wire in the horseshoe pattern. In Section 4, this model was combined with the analyses of equilibrium and deformation compatibility in the periodical lattices, to formulate a theoretical model for the hierarchical lattice materials. Section 5 presents the analysis of key mechanical properties as well as the effect of lattice topology, using the developed theoretical model and FEA. Section 6 introduces a design optimization of hierarchical lattice materials for reproducing the desired J-shaped stress-strain curves. The conclusions are drawn in Section 7.
2. Geometry of hierarchical lattice materials with horseshoe microstructures
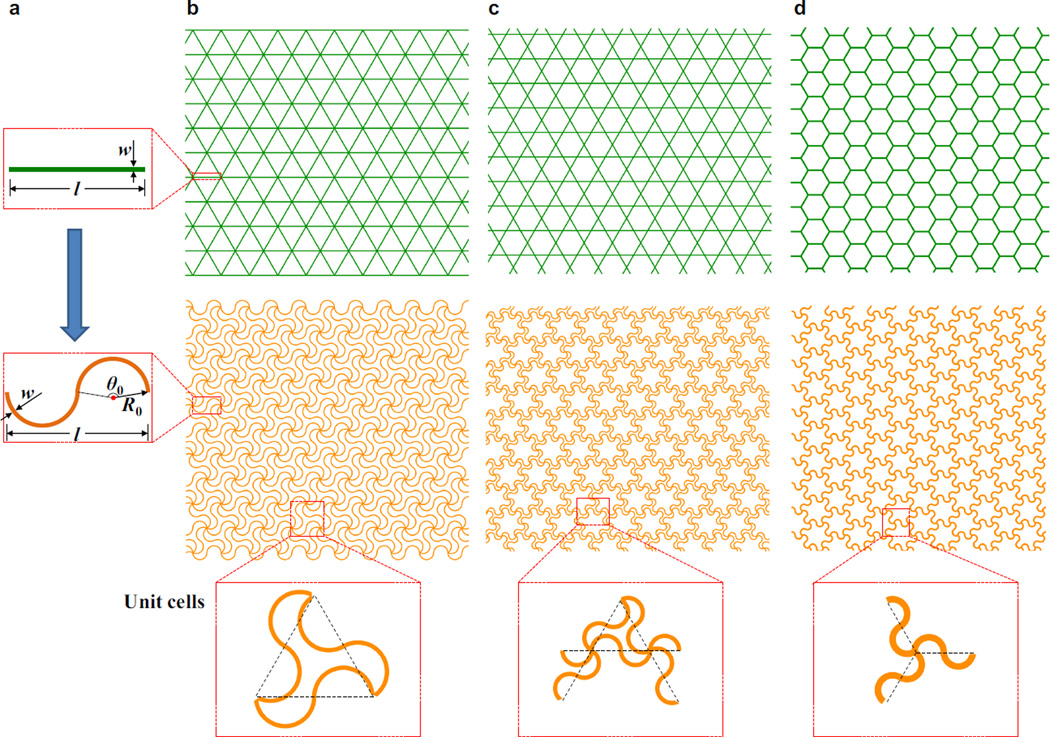
The key building block of the hierarchical lattice design is a horseshoe microstructure, as shown in the bottom panel of Fig. 1a, which renders a much higher flexibility and larger stretchability than a straight microstructure shown in the top panel of Fig. 1a. The horseshoe microstructure consists of two identical circular arcs, each with an arc angle of θ0, radius of R0, and width of w, and its span is l = 4R0 sin (θ0/2). For a horseshoe microstructure under relatively small stretching between the two ends, the deformation is clearly bending dominated due to its initial curvature. As the horseshoe microstructure is fully stretched to an approximate straight wire, the deformation becomes stretching dominated. Such a transition from bending- to stretching-dominated deformation modes gives the effective modulus of the horseshoe microstructure increasing with the applied strain, which attributes to the formation of J-shaped stress-strain curve. This mechanism is similar to that revealed in a single protein molecule (such as the tropocollagen molecule) (Buehler and Ackbarow, 2007; Buehler et al., 2008), which also involves unfolding of a wavy and/or helical microstructure during the pulling experiment. Elastomers (such as polyimide and PDMS) (Chang et al., 2008; Khang et al., 2006; Lu et al., 2007) with relatively large fracture strains (e.g., 10%) are ideal materials for the horseshoe microstructures, since they could survive the unfolding process (i.e., from a wavy wire to an approximate straight wire).
Figure 1. Geometric construction of the hierarchical lattice materials.
(a) the building block (straight wire) of traditional lattice materials in comparison to the building block (horseshoe wire) of hierarchical lattice materials; (b) traditional triangular versus hierarchical triangular lattice materials; (c) traditional Kagome versus hierarchical Kagome lattice materials; (d) traditional honeycomb versus hierarchical honeycomb lattice materials.
To form 2D material based on this building block, the design concept of lattice materials (Deshpande et al., 2001; Fleck and Qiu, 2007; Hutchinson and Fleck, 2006) can be adopted, with the horseshoe microstructure to connect each pair of nodes with nearest distance. Three representative lattice topologies, namely the triangular, Kagome and honeycomb lattices as shown in the top panels of Figs. 1b–1d, which all offer elastic isotropy at small strain, are studied in this paper. After replacing the straight wires of the three lattices by the horseshoe wires, the hierarchical lattice materials with horseshoe microstructures (referred to as “hierarchical lattice materials” for simplicity in the following) are constructed in the middle panels of Figs. 1b–1d. The thickness of hierarchical lattice materials is assumed to be much larger than the width of horseshoe microstructures, such that the lateral buckling would not be triggered due to the energetic preference of in-plane deformations, as opposed to out-of-plane deformations (Zhang et al., 2013).
The hierarchical lattice material is represented by two non-dimensional parameters, i.e., the arc angle θ0 and normalized cell wall width w̅ = w/R0. The unit cells of each pattern are shown at the bottom panel of Fig. 1, which could form the periodic structural material by extending along two different directions. The relative density (ρ̅) of lattice material, defined as the ratio of mass densities of lattice to solid materials, then equals its area ratio. It is approximately linearly proportional to the normalized cell width, and is given by
| (1) |
for the three patterns shown in Figs. 1b to 1d. It clearly shows that the hierarchical triangular lattice is most densely distributed, and the honeycomb one is most sparsely distributed.
Due to the hierarchical geometric construction, the mechanics analyses are carried out at two different levels, i.e., the levels of horseshoe microstructure and periodical lattices, which are elaborated in Sections 3 and 4, respectively.
3. An analytic model for the horseshoe microstructures
This section introduces an analytic model for the horseshoe microstructure (i.e., the building block of hierarchical lattice materials). The focus is on the effect of two non-dimensional microstructure parameters w̅ = w/R0 and θ0 on the effective stress-strain curve and the stretchability.
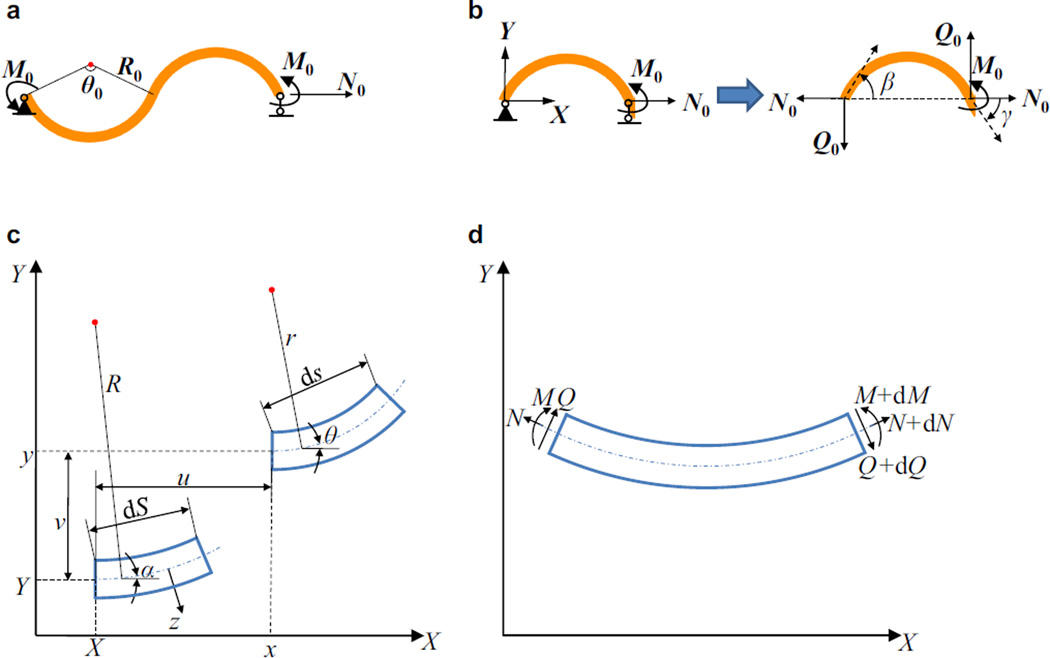
The horseshoe pattern can be modeled as a curved beam with w̅ = w/R0 ≪ 1 such that the Kirchhoff assumptions still hold (Timoshenko and Gere, 1961). For the hierarchical lattice materials under uniaxial stretching, each horseshoe microstructure in the unit cell undergoes anti-symmetric deformations with respect to the central point (i.e., the joints of two arcs), due to the periodicity and geometry of microstructures. This deformation characteristic is also verified by FEA results to be shown in Section 5. As such, we consider a simply supported horseshoe microstructure subject to a force N0 along the axial direction and a pair of moments (M0) anti-symmetrically located at the two ends, as shown in Fig. 2a. Since the geometry is anti-symmetric with regard to the central point, only half of the horseshoe microstructure (i.e., one arc) is analyzed, as shown in Fig. 2b, in which Q0 is the shear force at the right end. A model for small strain but finite rotation, which accounts for both bending and membrane deformation, is introduced in the following to analyze the deformation and maximum strain in the microstructure. It degenerates into the well-known Elastica theory (Fertis, 1999; Lin and Lin, 2011; Timoshenko and Gere, 1961) if the effect of membrane deformation is neglected.
Figure 2. Schematic illustration of theoretical model for the horseshoe microstructure.
(a) a simply supported horseshoe microstructure subject to an axial force at the right end and a pair of moments anti-symmetrically located at the two ends; (b) half of the horseshoe microstructure subject to an axial force and a moment at the right end; (c) deformation of a unit length element; (d) sign conventions of forces and moment.
Consider a curved beam with its centroid axis lying on the X–Y plane, as shown in Fig. 2c, either in the un-deformed or deformed states represented by the coordinates (X,Y) and (x, y), respectively. The length dS and angle α of the element in the un-deformed state become ds and θ, respectively, after deformation. The angles (α and θ) are in the range of [−π,π], where the positive (or negative) sign represents a counterclockwise (or clockwise) rotation required from the X axis to the tangential direction of the beam. FEA shows that the membrane strain in microstructure is typically within ~ 5% for the level of stretching in the present study such that it is reasonable to use the engineering strain ε = (ds − dS)/dS at the centroid axis and the rotational angle φ = θ − α. The strain at a distance of z from the centroid axis is given by
| (2) |
For a linear elastic material with the Young’s modulus Es, integration of the above equation then gives the axial force N, shear force Q and bending moment M (per unit thickness, Fig. 2d) in the beam as
| (3a,b) |
where EsA and EsI are the tensile and bending stiffness, respectively. The equilibrium equations are
| (4a,b,c) |
For the loading condition shown in Fig. 2b, the axial and shear forces are
| (5) |
which satisfy Eqs. (4b) and (4c). Its substitution into Eq. (4a), together with Eq. (3), gives
| (6) |
For the arc with an initial radius R0 (in Fig. 2b), , where φ = θ − α has been used. Equation (6) then becomes
| (7) |
The vanishing bending moment at the left end can be written as (dθ/dα)|α=θ0/2 = 1, which, together with the integration of Eq. (7), gives
| (8) |
where β is the deformed angle at the left end (α = θ0/2), as shown in Fig. 2b. Typically, the sign of curvature does not change in the same arc during the stretching of hierarchical lattice materials, such that keeps positive, which is also consistent with FEA calculations to be shown in Section 5. In this case, integration of Eq. (8) from the left to the right end gives the following equation,
| (9) |
where γ denotes the deformed angle at the right end (α = −θ0/2), as shown in Fig. 2b. At the right end, the deformed coordinates are x = xend and y = 0 (because of the anti-symmetric geometry), which can be evaluated by integrating dx = cosθds and dy = sinθds from the left end to the right end, i.e.,
| (10) |
where ds = (1 + ε) dS = R0 (1 + ε)dα, as well as Eqs. (3), (5) and (8) are used in the derivation. By solving Eqs. (9) and (10), both the deformed angles and coordinates at the two ends, i.e., β, γ and xend, can be determined. In other words, the following constitutive relation can be obtained numerically:
| (11) |
where the functions F1 and F2 both depend on two non-dimensional parameters w̅ and θ0, and are shown in Fig. S.1 (Electronic Supplementary materials) for three representative combinations (w̅, θ0) = (0.15, 120°), (0.15, 180°), and (0.25, 180°). Note that the shear force (Q0) can be related to the bending moment (M0) by M0 = −Q0xend, for the simply supported boundary conditions shown in Figs. 2a and 2b. To facilitate the derivation and solution, the axial and shear forces (N0 and Q0) are adopted as the two independent variables as given by Eq. (11). In case that the bending moment at the end is too large and induces change of sign in the curvature, the horseshoe microstructure must be bending dominated and the membrane strain should be negligible, such that Eqs. (9) and (10) can be replaced
| (12) |
| (13) |
where θcr is the deformed angle of the critical position with zero curvature, which can be related to the deformed angle (β) at the left end by
| (14) |
Equation (14) is obtained by setting and neglecting the membrane strain in Eq. (8). Then the constitutive relation [Eq. (11)] can be determined by solving Eqs. (12) – (14). In the condition of infinitesimal deformation, the constitutive relation is usually written in terms of the displacement and rotational angle, which can be obtained directly by using the energy approach, as given by
| (15) |
where u is the displacement at the right end along the axial direction of horseshoe microstructure (parallel to N0), and ω is the rotational angle at the right end.
Take the simply-supported boundary conditions to analyze the effective stress-strain relation of the horseshoe microstructure. In this case, the moment at the right end vanishes, i.e., M0=0 and Q0=0, and the deformed angle (β = −γ) can be solved directly from Eq. (9). The effective stress of the horseshoe microstructure is defined as σhorseshoe = N0/A. The effective strain is the percentage of elongation between the two ends, i.e., εhorseshoe = xend/[2R0 sin (θ0/2)] − 1. Substitution of N0 = σhorseshoeA and Q0 = 0 into Eq. (9) and (10) yields the effective stress-strain relation.[1] The maximum strain occurs at the middle [X = R0 sin (θ0 / 2), Y = R0[1 − cos (θ0 / 2)], in Fig. 2b] of the arc, and can be obtained from Eqs. (2) and (8).
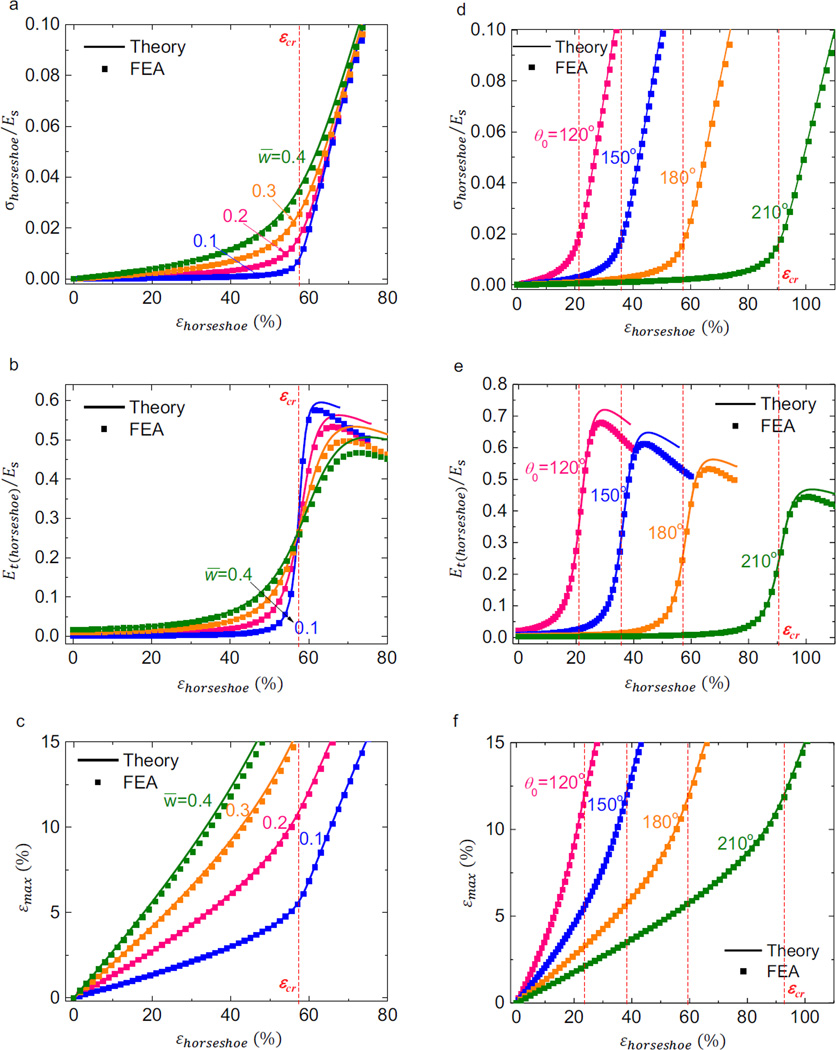
Figures 3a and 3b give the normalized stress-strain curve and normalized tangent modulus [(dσcohesive/dεcohesive)/Es] obtained from the above analytic model for a set of horseshoe microstructures with a fixed arc angle θ0 = 180° and four different normalized cell. wall widths (w̅) ranging from 0.1 to 0.4. As shown in Figs. 3a and 3b for polyimide (Es = 3.23 GPa and νs = 0.3), the analytic results for the entire range of loading and width are validated by the nonlinear FEA, which accounts for the finite deformation of the horseshoe microstructure. Elements based on the theory of Timoshenko beam are used in FEA, and the meshes are refined to ensure the accuracy. The stress-strain curve increases slowly at low strain because of the bending-dominated deformation mode, and after a critical strain, it increases rapidly due to the transition of deformation mode into stretching-dominated. This critical strain is well represented by εcr = θ0/[2sin (θ0/2)] − 1, denoting the strain to fully extend the horseshoe microstructure, as marked by the dashed line in Figs. 3a and 3b. The tangent modulus also increases slowly for stretching below εcr, and rapidly beyond εcr. Then it reaches a peak, after which it decreases due to the reduction of cross-sectional area. The analytic model predicts that all curves in Fig. 3b almost pass the same point at εcr, indicating that the horseshoe microstructures with different widths have almost the same tangent modulus at εcr. The effective stress-strain curve and tangent modulus, also confirmed by FEA, are shown in Figs. 3d and 3e for several arc angles. It is clear that the arc angle can be used to control the transition from low to high tangent modulus of the stress-strain curve (via the critical strain εcr).
Figure 3. Theoretical and FEA results of normalized stress-strain curve, tangent modulus and maximum strain for the horseshoe microstructure.
(a) normalized stress, (b) corresponding tangent modulus and (c) maximum principal strain versus applied strain for a wide range of normalized width, and fixed arc angle of θ0=180°; (d) normalized stress and (e) corresponding tangent modulus and (f) maximum principal strain versus applied strain for a wide range of arc angle, and fixed normalized width of w̅ = 0.2. The dashlines denote the critical strain (εcr).
Figure 3c shows the variation of maximum strain, εmax, during stretching of the horseshoe microstructures with different widths. Similar to the stress-strain curves in Figs. 3a and 3d, the maximum strain also increases relative slowly at small strain, and fast at relatively large strain. However, there is not an obvious critical strain separating the two. A narrow microstructure (small w) gives low εmax, and thereby large stretchability. For example, for a fracture strain of 10%, the stretchability for the horseshoe microstructure with normalized cell wall width of w̅ = 0.1 is 65%, as compared to 33% for w̅ = 0.4. The effect of arc angle on the maximum strain is illustrated in Fig. 3f, which demonstrates a low strain level in the microstructure with a large arc angle. Results from the analytic model and FEA also agree well in Figs. 3c and 3f for various microstructure geometries. The above results indicate that the stress-strain curve and stretchability of horseshoe microstructure can be well controlled by tuning the two geometric parameters (w̅ and θ0).
4. A theoretical model for the hierarchical lattice materials
In this section, the analytic model developed in Section 3 is combined with the analyses of equilibrium and deformation compatibility in the periodical lattices, to formulate a theoretical model for the hierarchical lattice materials. The finite deformation model is introduced in Section 4.1, which is further linearized in Section 4.2 to yield analytic solutions of elastic modulus and Poisson ratio under infinitesimal deformation. The validation of the theoretical model is presented in section 4.3.
4.1 Finite deformation model
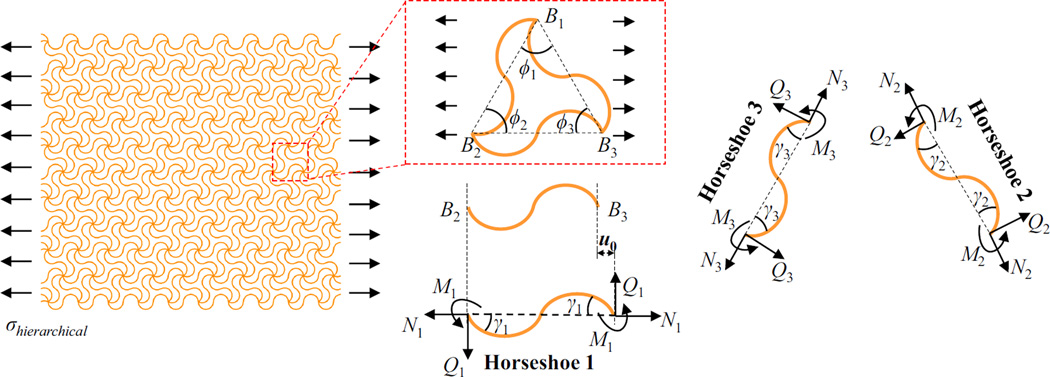
The hierarchical triangular lattice material under horizontal stretching is taken as an example to illustrate the model, as shown in Fig. 4. Due to the lattice periodicity, only a representative unit cell (in the red frame of Fig. 4), denoted by B1B2B3, is analyzed. This unit cell consists of three horseshoe microstructures, indexed from 1 to 3. The inner forces and moment at the ends are denoted by Ni, Qi and Mi (i=1‥3), as shown in Fig. 4. As described in Section 3, each horseshoe microstructure undergoes anti-symmetric deformations with respect to the central point (i.e., the joints of two arcs), as shown in Figs. 2a and 2b. Therefore, the moment (Mi) is related to the shear force (Qi) by Mi = −Qili/2 (i=1‥3), where li is the span (i.e., the distance between two ends) of the horseshoe microstructure in the deformed configuration. The effective stress (σhierarchical) of the hierarchical lattice material, similar to that frequently used for cellular materials (Onck et al., 2001), is the ratio of the total reaction force at the boundary to the initial cross-sectional area (i.e., the length of boundary multiplied by the thickness) of the computational model. The static equilibrium of the unit cell gives the relations among the inner forces (Ni and Qi) and the external loading (i.e., vanishing vertical load and shear load, and normal stress σhierarchical along horizontal direction):
| (16a) |
| (16b) |
| (16c) |
where ϕ1, ϕ2 and ϕ3 denote the three interior angles of the triangle ‘B1B2B3’ in the deformed configuration, and The equilibrium of an arbitrary joint (connected by six horseshoe microstructures) requires
| (17) |
It is worth noting that each unit cell of the hierarchical lattice materials undergoes the same loading conditions due to the lattice periodicity, such that only the moments at the ends of three differently oriented horseshoe microstructures are taken into account in Eq. (17).
Figure 4. Schematic illustration of the theoretical model of the hierarchical triangular lattice material subject to a uniform tensile stress along horizontal stretching.
A representative unit cell is analyzed, with the free body diagrams of the three horseshoe microstructures aligned in different directions.
The inner forces (Ni and Qi) lead to deformations in the horseshoe microstructure, as reflected by the change of the span (li) and the angle (γi) at the ends. According to the analyses in Section 3 [i.e., Eq. (11)], the correlation between the inner forces and the deformation can be written as
| (18) |
The deformation compatibility requires that the side lengths and interior angles of the deformed triangle ‘B1B2B3’ should satisfy the following geometric relations:
| (19) |
The angle between the tangent lines of different horseshoe microstructures keeps unchanged during the deformation, which gives two additional equations between the various angles, i.e.
| (20) |
The effective strain of the hierarchical lattice material, defined as the percentage of elongation along horizontal direction, can be expressed as
| (21) |
For a prescribed amount of stretching (εhierarchical), the effective stress (σhierarchical) as well as the deformed configurations of all horseshoe microstructures can be obtained by solving Eqs. (16) – (21) and
4.2 Analytic solutions of elastic modulus and Poisson ratio
For infinitesimal deformation, the above finite deformation model can be linearized to yield solutions of the elastic modulus and Poisson ratio. In this condition, the spans (l1, l2, l3) and the angles (ϕ1, ϕ2, ϕ3) can be expressed in terms of their original values and the infinitesimal increments as li = 4R0 sin (θ0/2) + ui and ϕ1 = π/3 + Δϕi (i=1‥3). Since the equilibrium equations under infinitesimal deformation can be established in the un-deformed configuration, Eqs. (16) and (17) can be linearized by setting ui = Δϕi = 0 inserting li = 4R0 sin (θ0/2) and ϕi = π/3 (i=1‥3), yielding
| (22a) |
| (22b) |
| (22c) |
| (23) |
According to Eq. (15), the constitutive relations under infinitesimal deformation can be written as
| (24) |
Taking into account the geometric relations ui = li − l0 and ωi = θ0/2 − γi (i=1‥3), the conditions [Eqs. (19) – (21)] of deformation compatibility can be linearized and reorganized into
| (25) |
| (26) |
| (27) |
Based on Eqs. (22) – (27), an analytic solution of the elastic modulus [Eelastic(hierarchical) = σhierarchical / εhierarchical] can be obtained as
| (28) |
Noting that the transverse strain can be linearized as , the Poisson ratio, νelastic(hierarchical) = −εtransverse/εhierachical, can be solved as well, and given by
| (29) |
Taking the limit of θ0 → 0 and neglecting the higher-order terms of w/l, Equations (28) and (29) degenerate to the solutions of triangular lattice material with straight microstructures and small relative densities, i.e., (Fleck and Qiu, 2007; Wang and McDowell, 2004). For a relatively large arc angle (e.g., θ0 > 90°), the hierarchical lattice is bending dominated under infinitesimal deformation, such that the solutions of elastic modulus and Poisson ratio can be simplified
| (30) |
| (31) |
4.3 Validation of the model
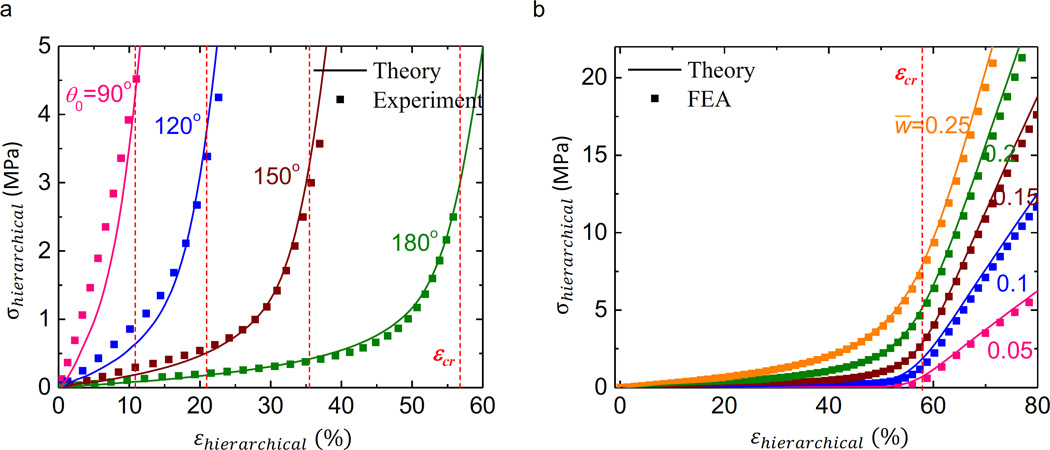
Figures 5a and 5b present the predicted stress-strain curves using the finite deformation model, together with the experimental data and FEA calculations, for hierarchical triangular lattice materials with a wide range of normalized cell wall widths (w̅) and arc angles (θ0), and made of polyimide (Es=3.23 GPa and (νs=0.3). The experimental results in Fig. 5a are extracted from a previous study (Jang et al., 2015), in which the normalized cell wall width is fixed as w̅ = 0.15, and the arc angle (θ0) ranges from 90° to 180°. The experimental results of samples with other geometric parameters in Jang et al. (2015) are not included here, because the lateral buckling occurs in these samples, leading to out-of-plane deformations. In FEA calculations, a sufficiently large number (e.g., ≥10×10) of unit cells (as shown in Fig. 1) is adopted to avoid the possible edge effect (Onck et al., 2001) in cellular materials. The displacement component along the stretching direction is applied, and the boundaries are allowed to deform freely along the transverse direction. The results in Figs. 5a and 5b show good agreements between theoretical results and experiment (or FEA) results. Similar to the building block (i.e, horseshoe microstructure), the hierarchical triangular lattice also possesses a stress-strain curve with the effective stress σhierarchical increasing quite slowly at small strain, and rapidly at large strain. The critical strain denoting such transition in stress-stain curve is the same as the horseshoe microstructure, i.e., εcr = θ0/[2sin(θ0/2)] − 1 (Appendix A), as shown as the red dash lines in Fig. 5a.
Figure 5. Theoretical, FEA and experimental results of stress-strain curves for the hierarchical triangular lattice material under horizontal stretching.
(a) stress-strain curves for a wide range of arc angle, and fixed normalized width of w̅ = 0.15; (b) stress-strain curves for a wide range of normalized width, and fixed arc angle of θ0=180°. The dashlines denote the critical strain (εcr).
5. Mechanical properties of hierarchical lattice materials under uniaxial stretching
After validating the developed model in Section 4, this section studies the key mechanical properties of hierarchical lattice materials under uniaxial stretching, including the nonlinear tangent modulus, Poisson ratio and stretchability.
5.1 Tuning the J-shaped stress-strain curves and tangent moduli via microstructure geometry
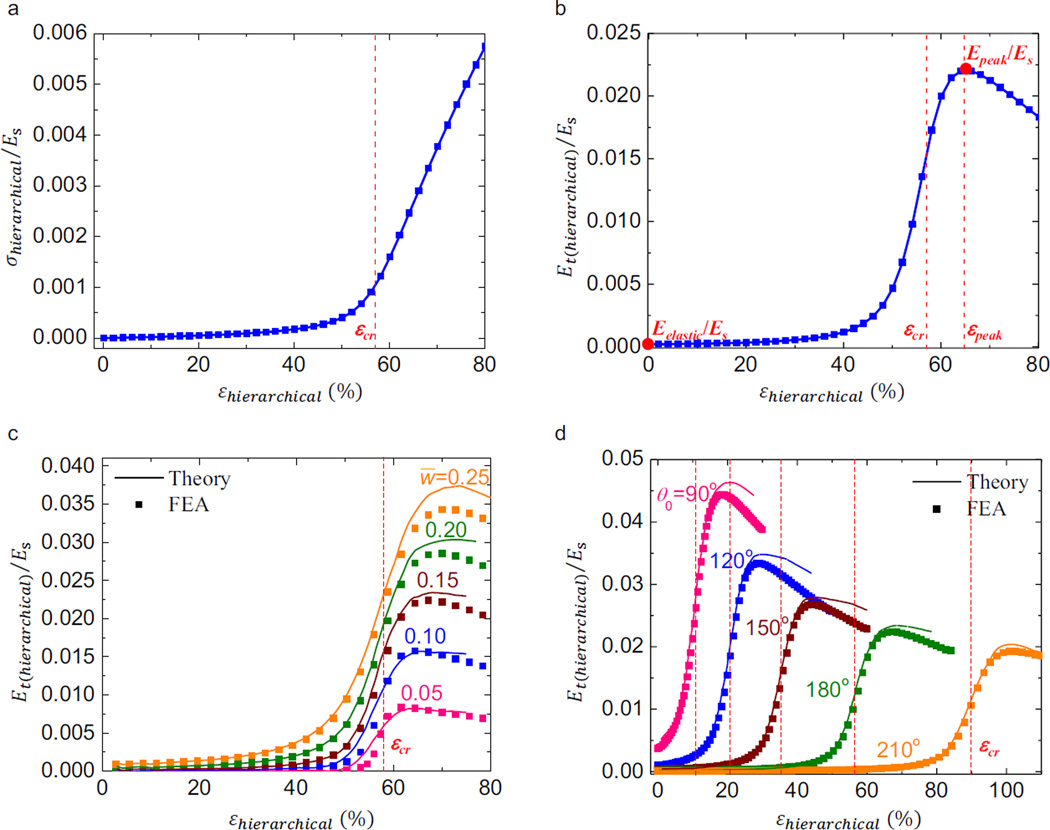
Figures 6a and 6b show a typical J-shaped stress-strain curve and the corresponding tangent modulus under horizontal stretching, for a hierarchical triangular lattice with the normalized cell wall width w̅ = 0.15 and arc angle θ0=180°, corresponding to the relative density of ~ 20% (or equivalently, a void fraction of ~ 80%). The tangent modulus increases sharply around the critical strain (εcr), reaches its peak (Epeak), and then experiences a slight drop, due to the reduction of cross-sectional area in the horseshoe microstructure as illustrated in Section 3. Such large variations of tangent modulus can be characterized by four key non-dimensional parameters, namely the normalized (initial) elastic modulus Eelastic/Es, critical strain εcr, normalized peak modulus Epeak/Es and the corresponding strain named the peak strain εpeak. A remarkable difference of elastic and peak moduli (or a large ratio of Epeak/Eelastic) is important to offer a high mechanical strength while providing an ultralow modulus at relative small strain (e.g., <40% in the example in Fig. 6). Besides, a small difference of critical and peak strain (or the ratio εpeak/εcr slightly larger than 1) is required to result in a sharp transition such that the enhancement of modulus can be accomplished over a small range of stretching.
Figure 6.
FEA results of a typical stress-strain curve (a) and tangent modulus-strain curve (b) for a hierarchical triangular lattice material with the normalized width and arc angle are w̅ = 0.15 and θ0 =180° ; theoretical and FEA results of tangent modulus-strain curves for (c) a wide range of arc angle, and fixed normalized width of ,w̅ = 0.15 and a wide range of normalized width, and fixed arc angle of θ0=180°.
The J-shaped stress-strain curves can be well controlled by tuning the microstructure geometries, as illustrated in Fig. 5. Theoretical predictions and FEA calculations in Figs. 6c and 6d show that both the normalized cell wall width (w̅) and arc angle θ0 can be utilized to control the level of elastic and peak moduli (therefore the tangent modulus) for the hierarchical triangular lattice materials; w̅ has essentially no effect on the critical strain, but the arc angle does over a wide range. For example, the ratio of Epeak/Eelastic decreases as the arc angle decreases (and approaches 1 for θ0 → 0) due to suppression of transition in the deformation modes. To enable quantitative tuning of stress-strain curve, analytic models are introduced below to describe the dependences of the key quantities (Eelastic/Es, Epeak/Es, εcr and εpeak) on the microstructure geometries.
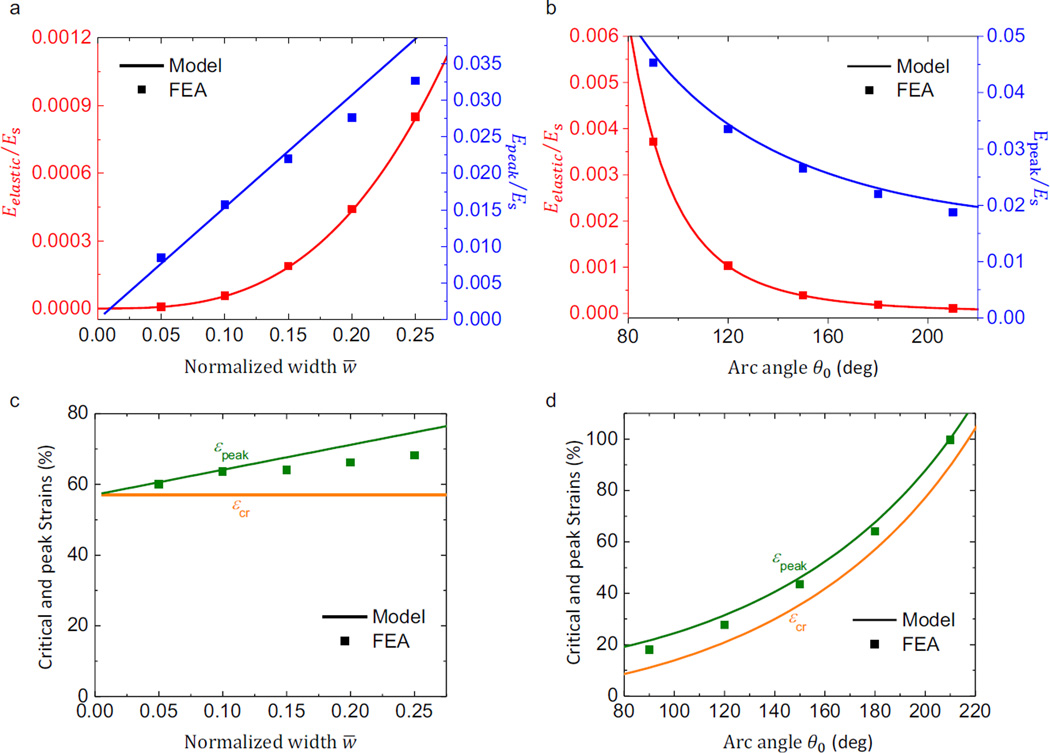
As described in Section 4.2, an analytic solution of the elastic modulus is obtained and given by Eq. (28). This equation, confirmed by FEA as shown in Figs. 7a and 7b, suggests that the elastic modulus can be significantly reduced by decreasing the cell wall width or increasing the arc angle. When the tangent modulus reaches its peak at large strain, it can be shown by theoretical and FEA calculations that only the horizontally aligned horseshoe microstructures undergo stretching-dominated deformation and the other microstructures undergo bending-dominated deformation. Therefore, the contribution of tilted horseshoe microstructures to the peak modulus can be neglected, and Epeak can be approximated by
| (32) |
where Epeak (horseshoe) represents the peak modulus of the horseshoe microstructure under axial stretching. According to Figs. 3b and 3e, Epeak(horseshoe) is insensitive to the cell wall width (e.g., with the relative change <17% for w̅ decreased by four times), and decreases almost linearly with the arc angle θ0. Therefore, Epeak (Beam3) can be approximately written as
| (33) |
where the coefficient 0.15 is determined from the theoretical results in Fig. 6c, but it holds for all hierarchical triangular lattice materials. Thereby, Epeak(horseshoe) can be written as
| (34) |
for hierarchical triangular lattice materials. The above equation degenerates to for θ0 → 0, consistent with the solution of elastic modulus for the triangular lattice with straight microstructures (Fleck and Qiu, 2007; Wang and McDowell, 2004). Equation (34), confirmed by FEA for different widths (Fig. 7a) and arc angles (Fig. 7b), and Eq. (30) indicates that a large ratio of Epeak/Es can be realized using a narrow cell wall.
Figure 7. Key mechanical properties characterizing the effective stress-strain curve versus the microstructure geometrical parameters.
(a) elastic modulus and peak modulus versus normalized width for a fixed arc angle of θ0 =180° ; (b) elastic modulus and peak modulus versus arc angle for a fixed normalized width of w̅ = 0.15; (c) critical strain and peak strain versus normalized width for a fixed arc angle of θ0 =180° ; (d) critical strain and peak strain versus arc angle for a fixed normalized width of w̅ = 0.15.
The critical strain εcr = θ0/[2 sin (θ0/2)] −1, and the peak strain εpeak obtained from FEA, are shown versus w̅ and θ0 in Figs. 7c and 7d, respectively. The peak strain can be well approximated by εpeak =εcr + 0.7w̅, where the coefficient 0.7 is determined by fitting with the theoretical results in Fig. 6c, but it holds for different hierarchical triangular lattice materials. Therefore, one can either decrease the cell wall width or increase the arc angle to reduce the ratio of εpeak/εcr.
5.2 Nonlinear Poisson effect of hierarchical triangular lattice materials
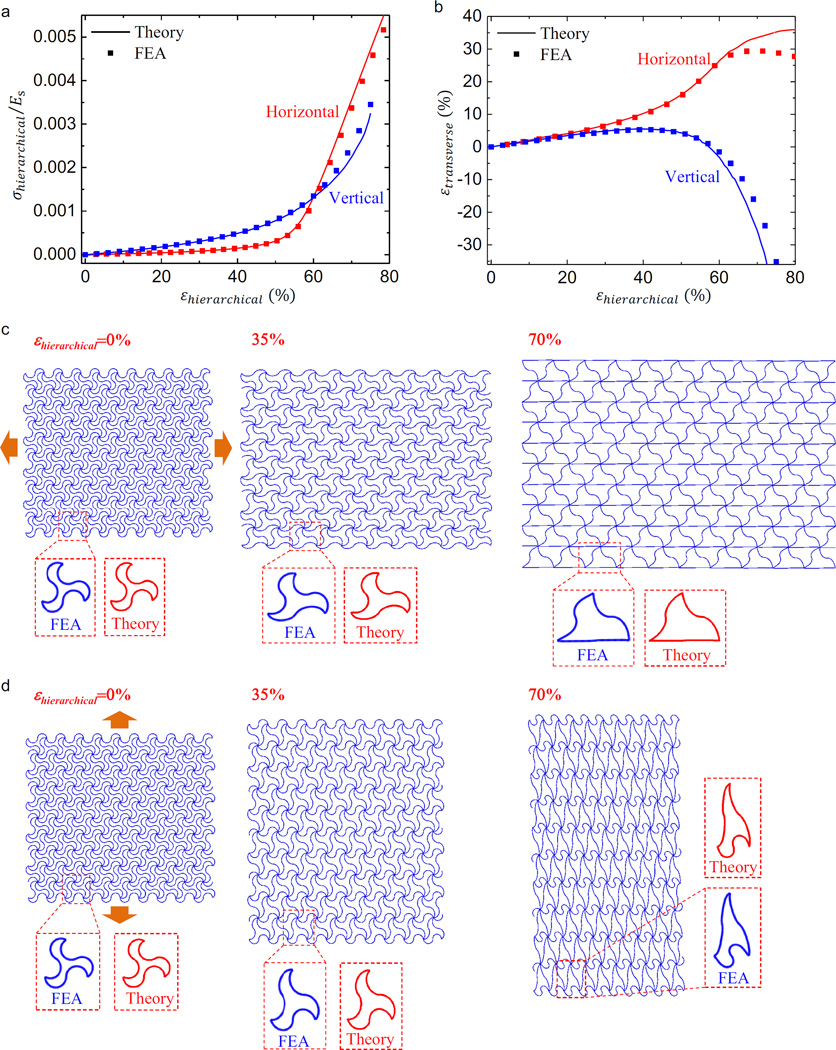
Besides the stress-strain curve, the theoretical model in Section 4 also enables the prediction of deformation along transverse direction that is relevant to the Poisson effect. Figure 8 presents the nonlinear dependences of normalized stress and transverse strain on the applied strain, as well as the deformed configurations for a typical hierarchical triangular lattice (ρ̅ ≈ 20% and θ0 = 180°) under uniaxial stretching along vertical and horizontal directions. All theoretical results agree reasonably well with the FEA calculations. In particular, the deformed configurations of the representative unit cell based on the theoretical prediction show very good accordance with the FEA results under different stages of uniaxial stretching.
Figure 8.
Theoretical and FEA results of normalized stress-strain curve (a), transverse strain-applied strain curve (b), and deformed configurations (c, d) of hierarchical triangular lattice materials under uniaxial stretching along horizontal and vertical directions. The normalized width and arc angle are w̅ = 0.15 and θ0 =180.
Under horizontal stretching, the transverse strain increases almost proportionally at small strain (e.g., < 15%), and then more rapidly until the applied strain reaches around the critical strain (εcr). It is notable that the transverse strain is always positive in the entire stretching process (up to 80%). Such negative Poisson effect originates mainly from the dilatation of the triangular shaped unit cell, as illustrated in Fig. 8c. Here, a remarkable expansion of ~ 8.1% or 29.5% along vertical direction can be clearly observed for 35% and 70% horizontal stretching, corresponding to Poisson ratios of −0.23 and −0.42. Similar negative Poisson effect was also reported in traditional cellular materials (Babaee et al., 2013; Bertoldi et al., 2010; Taylor et al., 2014) without using horseshoe microstructures, though the deformation mechanisms are different. The evolution of deformed configurations also demonstrates a clear transition of deformation mode from bending-dominated to stretching-dominated in the load bearing wires (i.e., horizontally aligned horseshoe microstructures).
The hierarchical triangular lattice possesses the 6-fold rotational symmetry, thereby offering an elastically isotropic property. As such, the transverse strain under vertical stretching is very close to that under horizontal stretching for a small strain (e.g., < 15%), as evidenced in Fig. 8b. Under a large level of stretching (e.g., > 40%), the geometrically nonlinear effect comes into play, leading to anisotropic mechanical behaviors. In particular, the triangular shaped unit cell does not dilate progressively under vertical stretching, due to a considerable level of compressive force loaded onto the horizontally aligned horseshoe microstructures. Such compressive force increases rapidly as the load bearing wires (i.e., tilted horseshoe microstructures) becomes stretching-dominated, which switches the Poisson ratio from negative to positive (at ~ 58%). The two deformed configurations in Fig. 8d, which correspond to a negative Poisson ratio (−0.17) at a small strain (35%) and a positive Poisson ratio (0.26) at a large strain (70%), illustrate such transition.
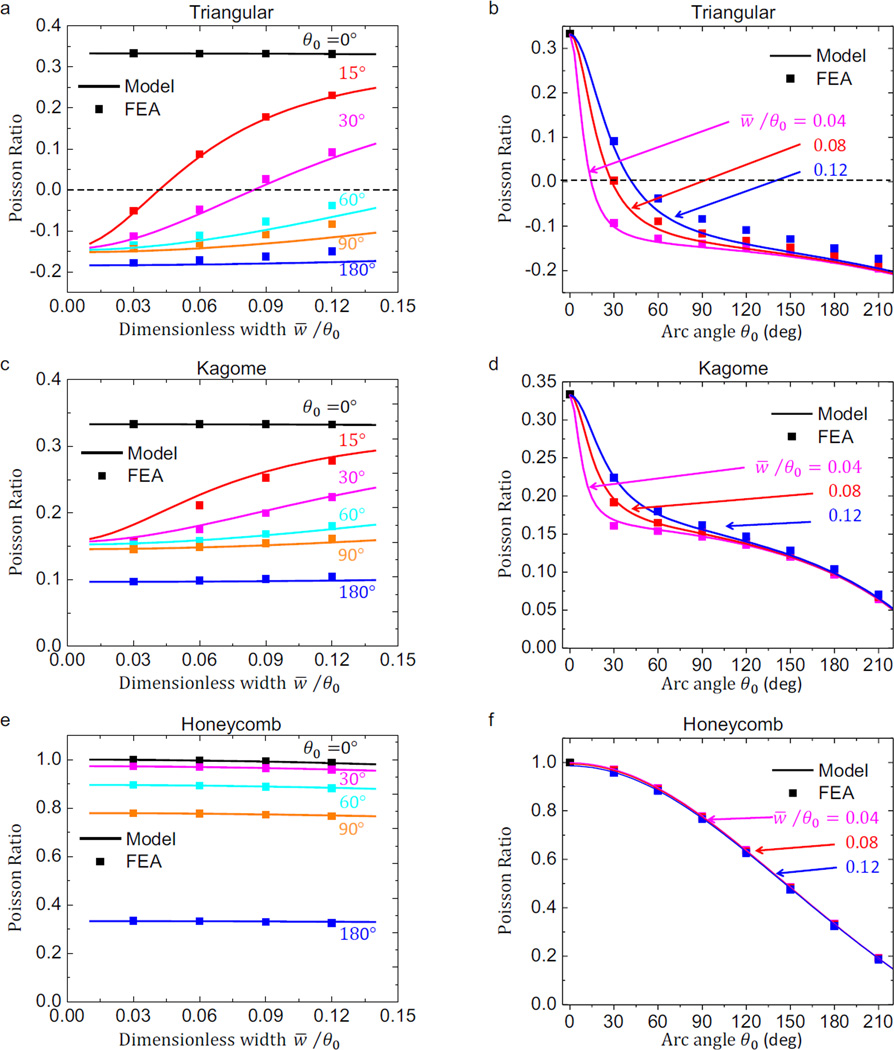
Similar to the J-shaped stress-strain curves, the Poisson effect described above also depends highly on the microstructure geometric parameters. For simplicity, we focus on the Poisson ratio [Eq. (29)] under infinitesimal deformation, to highlight its dependence on the dimensionless width (w̅/θ0) and arc angle (θ0), as shown in Figs. 9a and 9b. For any given (w̅/θ0), the Poisson ratio always decreases continuously from 0.33 at θ0 = 0, to approximately −0.20 at θ0 = 220°. This indicates that the hierarchical triangular lattice can be tailored precisely to yield a desired Poisson ratio in the range of [−0.20, 0.33], including zero Poisson ratio (see Fig. S.2a, Electronic Supplementary materials) that is of high interest in many engineering applications. For example, the analytic solution [Eq. (29)] gives a critical arc angle (~ 28.5°) to achieve zero Poisson ratio, for a representative dimensionless width w̅/θ0 = 0.08. The finite deformation analyses (see Figs. S.2b and S.2c, Electronic Supplementary materials) confirmed this point, showing a negligible Poisson ratio (e.g., < 0.05) for horizontal stretching up to 1.50% (and vertical stretching up to 0.56%). When the arc angle is relatively large (e.g., > 120°), the hierarchical lattices become highly bending-dominated, such that the Poisson ratio is almost independent on the dimensionless width, as shown in Fig. 9b. In all of the different geometric parameters, the analytic predictions always agree well with FEA results, although slight deviations can be observed for relatively large w̅/θ0, due to the neglect of shear deformation in the analytic model.
Figure 9.
Theoretical and FEA results of Poisson ratio under infinitesimal deformation versus the microstructure geometrical parameters (w̅ θ0 and θ0) for the hierarchical lattice materials, with (a, b) triangular, (c, d) Kagome, and (e, f) honeycomb topologies.
5.3 Effect of lattice topology on the mechanical performances
Since the coordinated deformation of the triangular shaped unit cell plays an important role in the negative Poisson effect described in Section 5.2, it can be expected that the hierarchical materials with different lattice topologies may exhibit distinct mechanical behaviors. This section elucidates such effect both in the regime of infinitesimal and finite deformations, through a comparison to the other two lattice topologies (i.e., Kagome and honeycomb patterns, as shown in Figs. 1b and 1c). The theoretical model developed in Section 4 is extended to these two hierarchical lattices to obtain the analytic solutions of elastic modulus and Poisson ratio (Appendix B). Figures 9c to 9f present the results of Poisson ratio based on Eqs. (B.2) and (B.4), for a wide range of w̅/θ0 and θ0, which are in good accordance with FEA. Different from the hierarchical triangular lattice, both the hierarchical Kagome and honeycomb lattices always exhibit a positive Poisson effect. For all of the three hierarchical lattices, the Poisson ratio always decreases monotonously with increasing the arc angle, in which the hierarchical Kagome lattice is most insensitive to its change (from 0.33 at θ0 = 0 to 0.05 at θ0 = 220°). It is interesting to note that the Poisson ratio of hierarchical honeycomb lattice is almost independent on the dimensionless width in the entire range of arc angle (0<θ0<220°), mainly because the honeycomb lattice with straight wires (θ0=0) is also bending-dominated.
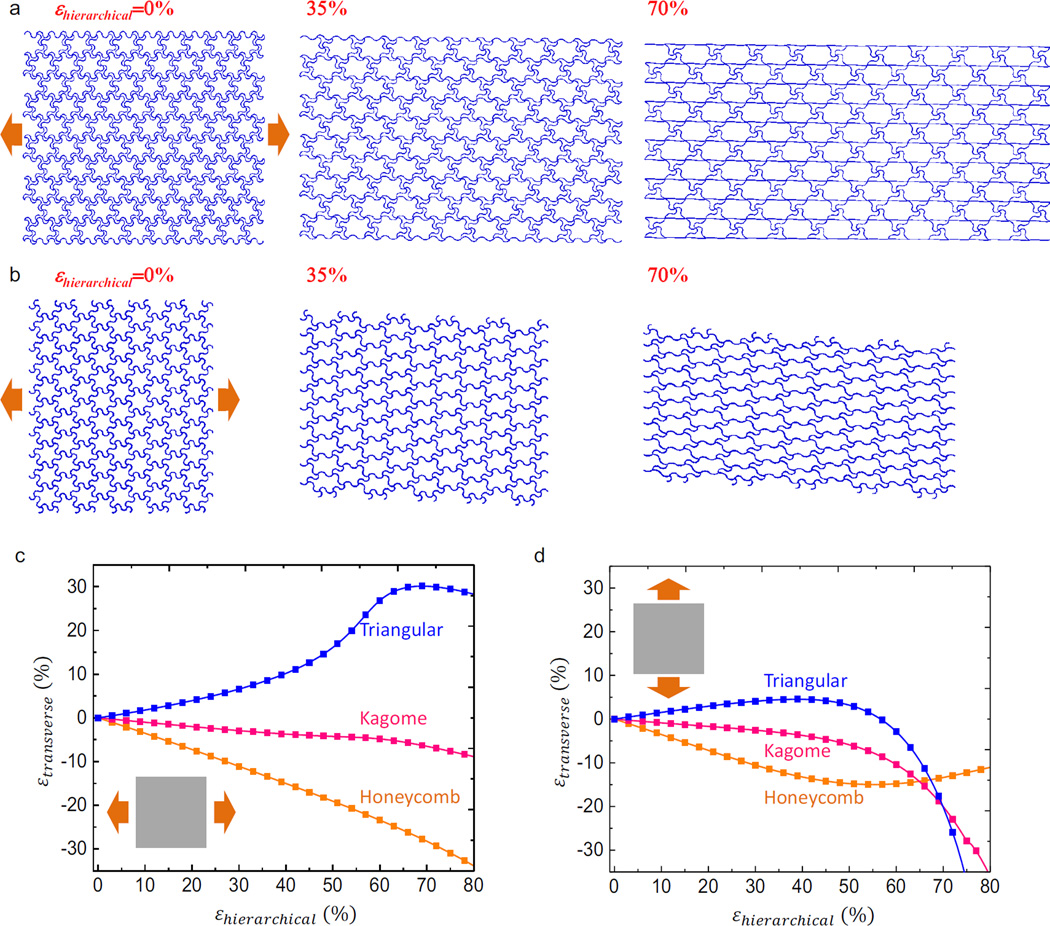
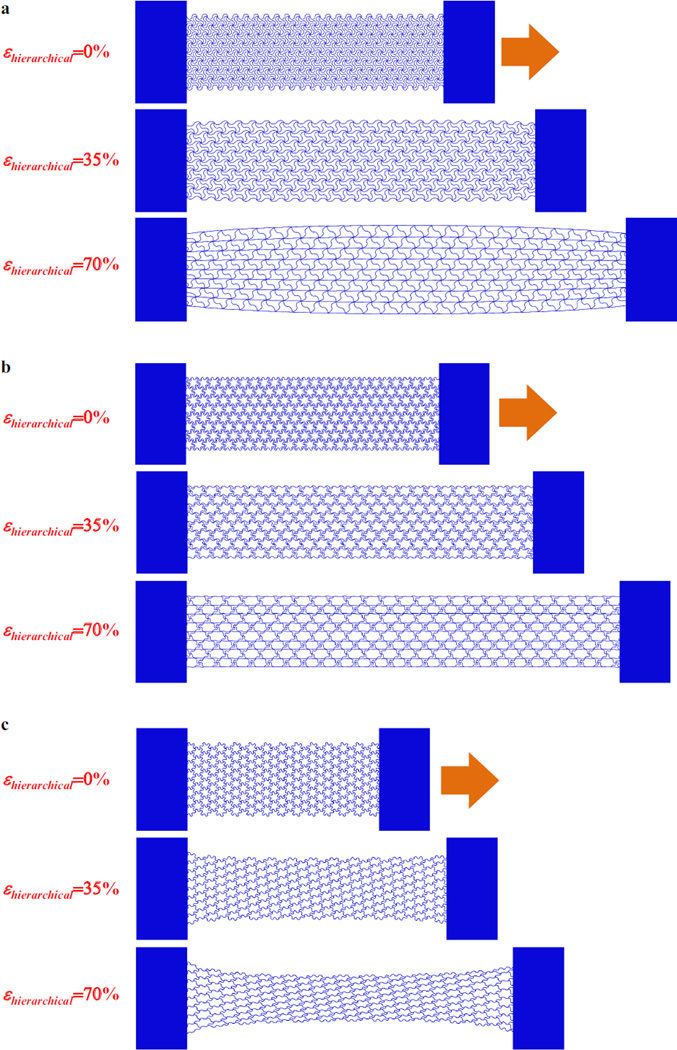
To analyze the effect of lattice topologies under finite deformation, the relative density and arc angle of Kagome and honeycomb lattices are kept the same as those of the hierarchical triangular lattice in Fig. 8, i.e., ρ̅ ≈ 20% and θ0 =180°. Figures 10a to 10c present FEA results of the deformation patterns and transverse strains at different levels of horizontal stretching. In contrary to the negative Poisson ratio for the triangular pattern (Fig. 8c), the Kagome pattern offers a nearly zero Poisson ratio (e.g., 0.095 and 0.093 for 35% and 70% stretching, respectively), while the honeycomb pattern provides a large positive Poisson ratio (e.g., 0.37 and 0.40 for 35% and 70% stretching, respectively). Such significant dependence of Poisson effect on the lattice topologies is also observed under clamped boundary conditions (Fig. 11), in which the three hierarchical lattices are re-configured into narrow rectangular shapes and connected by solid plate to facilitate stretching. Similar to the hierarchical triangular lattice, the hierarchical Kagome and honeycomb lattices also possess isotropic and anisotropic Poisson ratios under small and large strains, respectively. In particular, the transverse strain under vertical stretching (in Fig. 10d) deviates evidently from that under horizontal stretching (in Fig. 10c), when the applied strain is larger than a certain value (~ 30% for triangular lattice, ~ 40% for honeycomb lattice, and ~ 50% for Kagome lattice). Such deviation in transverse strain is most prominent in the hierarchical triangular lattice. This can be also observed from the comparison of deformed configurations under both relaxed (i.e., the boundaries are allowed to deform freely along the transverse direction) and clamped boundaries, as shown in Figs. 8, 10, 11, Fig. S.3 and Fig. S.4 (Electronic Supplementary materials).
Figure 10.
FEA results of deformed configurations of (a) hierarchical Kagome lattice, and (b) hierarchical honeycomb lattice, under uniaxial stretching along horizontal direction, and the transverse strains for the three different lattices under uniaxial stretching along horizontal (c) and vertical (d) direction. The relative density and arc angle are fixed as ρ̅ = 20% and θ0=18°, respectively.
Figure 11. Deformed configurations of (a) hierarchical triangular lattice, (b) hierarchical Kagome lattice, and (c) hierarchical honeycomb lattice, under uniaxial stretching along horizontal direction.
All of the three hierarchical lattices are connected with solid plates made of the same material to model clamped boundaries at the two ends. The relative density and arc angle are fixed as ρ̅= 20% and θ0=180°, respectively.
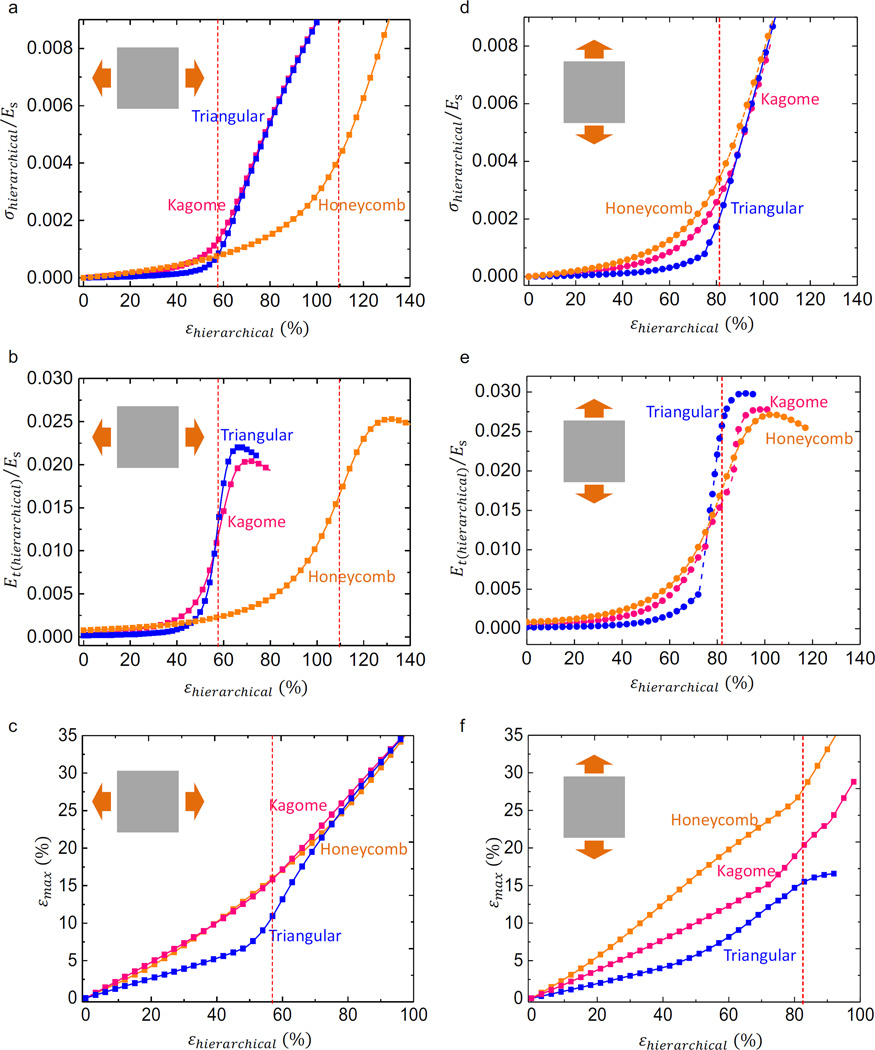
In addition to the Poisson ratio, many other mechanical properties, such as the stress-strain curve, tangent modulus and stretchability, are also sensitive to the lattice topology, as illustrated in Fig. 12. In all of these figures, the red dash lines represent the critical strain. Under horizontal stretching, the hierarchical Kagome lattice material has the same critical strain (to fully extend the lattice material) εcr = θ0/[2sin (θ0/2)] − 1 (Appendix A) as the triangular lattice, which gives 57% for θ0 =180°. The hierarchical honeycomb lattice material, however, requires a larger critical strain, 2θ0/[3sin (θ0/2)] − 1 (Appendix A), which gives 109% for θ0 =180°. Differently, all three patterns have the same critical strain, (Appendix A), under vertical stretching, which gives 81.4% for θ0 = 180°. From the comparison of stress-strain curve and tangent modulus, it can be found that the triangular pattern gives the sharpest transition in stress-strain curve for both the horizontal and vertical stretching, consistent with its largest value of Epeak/Eelastic and smallest εpeak/εcr that can be observed from Figs. 12b and 12e. The stress-strain curve for the Kagome pattern under horizontal stretching is close to that of triangular pattern, although its modulus does not increase as quickly around the critical strain. The honeycomb pattern can be utilized to offer a later transition (i.e., a larger critical strain) in stress-strain curve under horizontal stretching. Similar to the Poisson effect, all of three hierarchical lattices show anisotropic stress-strain responses only in the regime of large strain, which can be observed through a comparison between Fig. 12a and Fig. 12d. The maximum strain versus the applied strain is shown in Figs. 12c and 12f, from which the stretchability can be determined directly, once the fracture limit of the parent material is given. For horizontal loading (Fig. 12c), the triangular pattern gives the lowest strain for stretching below ~ 75%; above this value, the honeycomb outperforms the other two patterns slightly due to its largest critical strain to trigger the transition of deformation mode into stretching-dominated. For vertical loading (Fig. 12f), the triangular pattern always gives the lowest strain, and therefore, the largest stretchability.
Figure 12. Effect of lattice topology on the stress-strain curve, tangent modulus-strain curve and maximum strain.
(a) normalized stress-strain curve, (b) corresponding tangent modulus and (c) maximum principal strain versus applied strain under uniaxial stretching along horizontal direction; (d) normalized stress-strain curve, (e) corresponding tangent modulus and (f) maximum principal strain versus applied strain under uniaxial stretching along vertical direction. The relative density and arc angle are fixed as ρ̅= 20% and θ0=180°, respectively. The dashlines denote the critical strain (εcr).
6. Design optimization of hierarchical lattice materials for reproducing the desired stress-strain curves of human skins
The theoretical models in Sections 4 and 5 can be employed to achieve rapid optimization of microstructure geometry for matching precisely the stress-strain curves of human skins. Three different sets of human skins (Annaidh et al., 2012; Shergold et al., 2006) at various locations on different individuals are taken into account. Let (ε1, σ1) to (εn, σn) denote the data set (with n values) of stress-strain curves for human skins measured in experiment. The hierarchical triangular lattice made of polyimide (Es=3.23 GPa and (νs=0.3) is taken as an example to illustrate the design optimization. Using the above theoretical model, the stress-strain curve of the hierarchical triangular lattice (under horizontal stretching) can be obtained and expressed as σ = G (ε, w̅, θ0) for a given microstructure geometry. Here, the coefficient of determination (also known as R squared) that reflects how well the experimental data fit the model is adopted to construct to the objective functional (Π), which reads
| (35) |
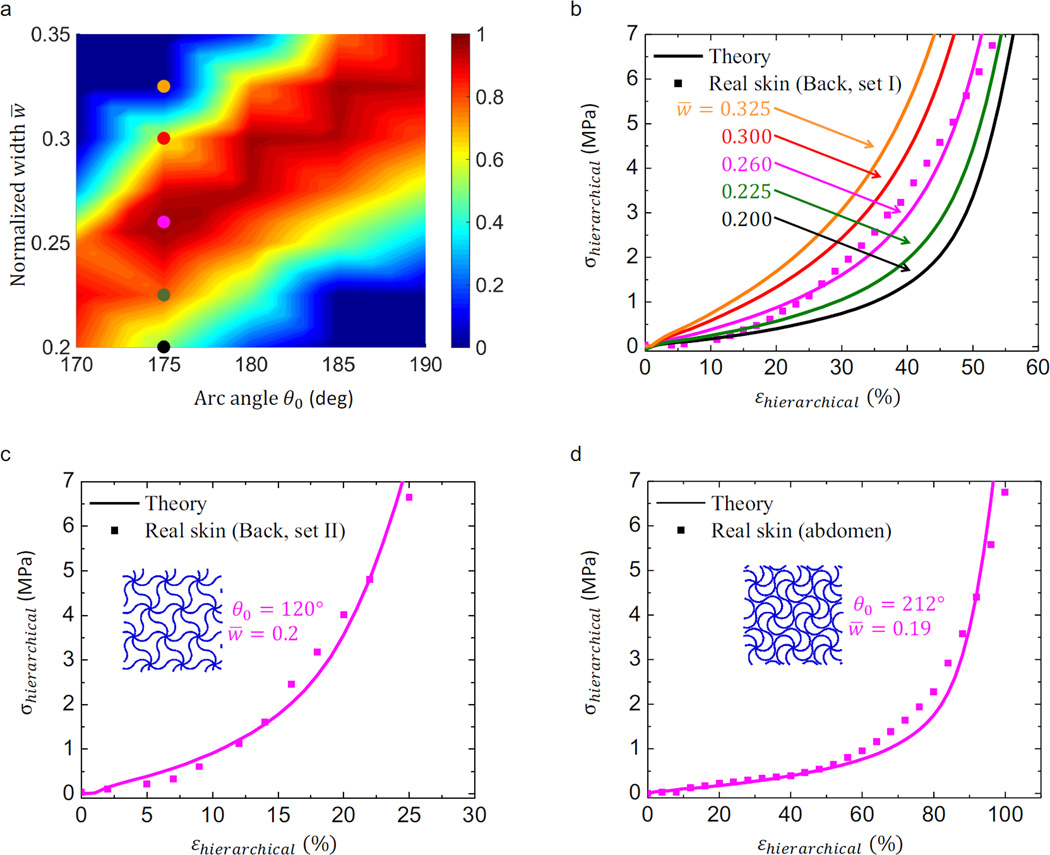
Maximization of this functional by searching over a reasonable range of normalized cell wall width and arc angle then gives solutions for the two unknowns. Here, the analytic solutions of elastic modulus, critical strain and peak modulus can be utilized to assist the determination of an initial range of geometric parameters in the optimization. Figure 13a illustrates the distribution of objective functional over a range of normalized cell wall width and arc angle, for a real skin (back area of a person) (Annaidh et al., 2012). The optimal geometric parameters (θ0 ≈ 175°, w̅ ≈ 0.26) can be determined from this optimization process, and the corresponding stress-strain curve indeed agrees very well with the counterpart of real skin, as shown in Fig. 13b. Note that the variation of geometric parameters could result in an evident deviation of stress-strain curve from the experimental result (Fig. 13b). For real human skins with highly different critical strains in the stress-strain curve (Figs. 13c and 13d), the above optimization process also allows rapid determination of geometric parameters in the hierarchical triangular lattices for matching precisely the stress-strain curves.
Figure 13. Design optimization of the hierarchical triangular lattice materials.
(a) Distribution of the coefficient of determination over a range of microstructure parameters (θ0 and w̅), for the stress-strain curve of a real human skin (back area of a person) (Annaidh et al., 2012) shown in (b). (b) Stress-strain curve of a real human skin in comparison to the counterpart of hierarchical triangular lattices with the arc angle of θ0=175° and normalized width ranging from 0.200 to 0.325, corresponding to the five circles in (a). (c, d) Stress-strain curves of human skin for two different locations (back area and abdomen area) on different individuals (Shergold et al., 2006) and skin-like hierarchical triangular lattices with (θ0, w̅ = (120°, 0.2) and (212°, 0.19).
7. Conclusions
This paper presents a theoretical study of nonlinear mechanical behavior in a class of bio-inspired hierarchical lattice materials. A finite deformation model of hierarchical triangular lattice is developed and validated by FEA and experimental results. This model can predict precisely the nonlinear stress-strain curve and Poisson ratio, as well as the deformed configurations under uniaxial stretching. The theoretical results shows that the J-shaped stress-strain curves can be well characterized by four mechanical quantities (i.e., elastic modulus, critical strain, peak modulus and the associated strain). Analytic solutions of these quantities were proposed to describe their dependences on the microstructure geometry. Negative and positive Poisson ratios were found in the hierarchical materials with different lattice topologies, which show nonlinear and anisotropic characteristics at large levels of stretching. The lattice topology also has a strong influence on the stress-strain curve, and the analyses indicate that the triangular pattern offers the sharpest transition in the stress-strain curve. These results and the theoretical model in general, can be exploited in the design and optimization of hierarchical lattice materials for applications in tissue engineering (Naik et al., 2014; Yannas and Burke, 1980) and stretchable bio-integrated electronics (Kim et al., 2011; Rogers et al., 2010; Xu and Zhu, 2012; Xu et al., 2014; Yao and Zhu, 2015; Zhang et al., 2014).
Supplementary Material
Highlights.
This paper presents a theoretical study of nonlinear mechanical behavior in a class of bio-inspired hierarchical lattice materials.
The developed model can predict precisely the nonlinear stress-strain curve and Poisson ratio, as well as the deformed configurations.
Negative and positive Poisson ratios were found in the hierarchical materials with different lattice topologies.
This study provides theoretical guidelines for future designs of soft bio-mimetic materials with hierarchical lattice constructions.
Acknowledgments
Y.Z. acknowledges support from the Thousand Young Talents Program of China and the National Science Foundation of China (Grant No. 11502129). Y.H. and J.A.R. acknowledge the support from NSF (CMMI-1300846 and CMMI-1400169) and the NIH (grant #R01EB019337). K.C.H. acknowledges the support from the National Basic Research Program of China (Grant No. 2015CB351900) and NSFC.
Appendix A
Critical strains of the hierarchical lattices with different topologies
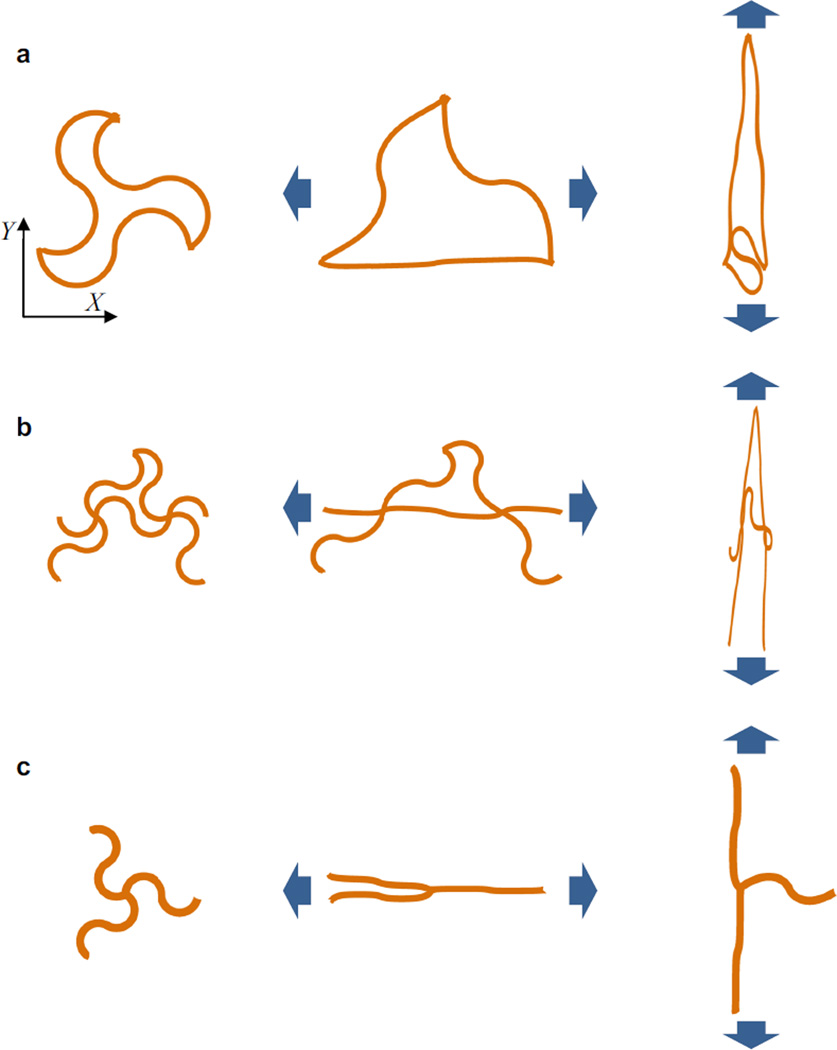
The critical strain characterizing the transition of deformation mode can be determined by analyzing the deformation of a representative unit cell in the hierarchical lattice material. For the triangular hierarchical lattice shown in Fig. A1a, the x-directional stretching is mainly accommodated by the horizontally aligned horseshoe microstructure. The deformation becomes stretching-dominated as this microstructure becomes fully extended to a straight wire (with a length of 2θ0R0). The corresponding critical strain can be then obtained as
| (A.1) |
Under the vertical stretching, the two initially tilted horseshoe microstructures are stretched, while the horizontal one is compressed, as shown in Fig. A1a. In this case, the occurrence of stretching-dominated mode requires that the initially tilted horseshoe microstructures are not only fully extended to straight wires, but also rotated to be aligned with y-axis, leading to
| (A.2) |
The hierarchical Kagome and honeycomb lattices can be analyzed in a similar manner, as schematically shown in Fig. A1b and A1c, respectively. The corresponding critical strains along the x and y axes are given by
| (A.3) |
| (A.4) |
Figure A1. Schematic illustration of the deformation pattern around the critical strain: the unit cell, and its deformed patterns along horizontal and vertical directions, for the hierarchical lattice materials with (a) triangular, (b) Kagome and (c) honeycomb topologies.
Appendix B
Elastic moduli and Poisson ratios of the hierarchical Kagome and honeycomb lattices
Using a similar approach to that illustrated in Section 4, the equilibrium equations, deformation compatibility equations, and effective constitutive relation can be established for the hierarchical Kagome and honeycomb lattices as well. After linearizing these equations for infinitesimal deformation, the analytic solutions of elastic moduli and Poisson ratios can be obtained as
| (B.1) |
| (B.2) |
| (B.3) |
| (B.4) |
Figures 9 and S.5 (Electronic Supplementary materials) show that the above analytic solutions agree remarkably well with FEA results for a wide range of geometric parameters.
Footnotes
Publisher's Disclaimer: This is a PDF file of an unedited manuscript that has been accepted for publication. As a service to our customers we are providing this early version of the manuscript. The manuscript will undergo copyediting, typesetting, and review of the resulting proof before it is published in its final citable form. Please note that during the production process errors may be discovered which could affect the content, and all legal disclaimers that apply to the journal pertain.
It should be pointed out that, once the horseshoe microstructure is close to being full extended, the membrane strain becomes large such that the cross section area is significantly reduced. This effect is accounted for by multiplying a factor 1 − 2νs (σhorseshoe/Es) the effective stress, where νs is the Poisson ratio of the material.
References
- Aizenberg J. Skeleton of Euplectella sp.: Sturctural hierarchy from the nanoscale to the macroscale. Science. 2005;309:275–278. doi: 10.1126/science.1112255. [DOI] [PubMed] [Google Scholar]
- Annaidh AN, Bruyere K, Destrade M, Gilchrist MD, Ottenio M. Characterization of the anisotropic mechanical properties of excised human skin. Journal of the Mechanical Behavior of Biomedical Materials. 2012;5:139–148. doi: 10.1016/j.jmbbm.2011.08.016. [DOI] [PubMed] [Google Scholar]
- Babaee S, Shim J, Weaver JC, Chen ER, Patel N, Bertoldi K. 3D Soft Metamaterials with Negative Poisson's Ratio. Advanced Materials. 2013;25:5044–5049. doi: 10.1002/adma.201301986. [DOI] [PubMed] [Google Scholar]
- Bertoldi K, Reis PM, Willshaw S, Mullin T. Negative Poisson's Ratio Behavior Induced by an Elastic Instability. Advanced Materials. 2010;22:361–366. doi: 10.1002/adma.200901956. [DOI] [PubMed] [Google Scholar]
- Bonderer LJ, Studart AR, Gauckler LJ. Bioinspired design and assembly of platelet reinforced polymer films. Science. 2008;319:1069–1073. doi: 10.1126/science.1148726. [DOI] [PubMed] [Google Scholar]
- Bouville F. Strong, tough and stiff bioinspired ceramics from brittle constituents. Nature Materials. 2014;13:508–514. doi: 10.1038/nmat3915. [DOI] [PubMed] [Google Scholar]
- Buehler MJ, Ackbarow T. Fracture mechanics of protein materials. Materials Today. 2007;10:46–58. [Google Scholar]
- Buehler MJ, Keten S, Ackbarow T. Theoretical and computational hierarchical nanomechanics of protein materials: Deformation and fracture. Progress in Materials Science. 2008;53:1101–1241. [Google Scholar]
- Buehler MJ, Yao HM, Gao HJ, Ji BH. Cracking and adhesion at small scales: atomistic and continuum studies of flaw tolerant nanostructures. Modelling and Simulation in Materials Science and Engineering. 2006;14:799–816. [Google Scholar]
- Capadona JR, Shanmuganathan K, Tyler DJ, Rowan SJ, Weder C. Stimuli-responsive polymer nanocomposites inspired by the sea cucumber demis. Science. 2008;319:370–374. doi: 10.1126/science.1153307. [DOI] [PubMed] [Google Scholar]
- Chang WY, Fang TH, Lin YC. Physical characteristics of polyimide films for flexible sensors. Applied Physics A-Materials Science & Processing. 2008;92:693–701. [Google Scholar]
- Chen C, Lu TJ, Fleck NA. Effect of imperfections on the yielding of two-dimensional foams. Journal of the Mechanics and Physics of Solids. 1999;47:2235–2272. [Google Scholar]
- Cranford SW, Tarakanova A, Pugno NM, Buehler MJ. Nonlinear material behavior of spider silk yields robust webs. Nature. 2012;482:72–76. doi: 10.1038/nature10739. [DOI] [PubMed] [Google Scholar]
- Deshpande VS, Ashby MF, Fleck NA. Foam topology bending versus stretching dominated architectures. Acta Materialia. 2001;49:1035–1040. [Google Scholar]
- Evans AG, Hutchinson JW, Fleck NA, Ashby MF, Wadley HNG. The topological design of multifunctional cellular metals. Progress in Materials Science. 2001a;46:309–327. [Google Scholar]
- Evans AG, Suo Z, Wang RZ, Aksay IA, He MY, Hutchinson JW. Model for the robust mechanical behavior of nacre. Journal of Materials Research. 2001b;16:2475–2484. [Google Scholar]
- Fertis DG. Nonlinear Mechanics. New York: CRC Press Inc; 1999. [Google Scholar]
- Fleck NA, Qiu XM. The damage tolerance of elastic-brittle, two-dimensional isotropic lattices. Journal of the Mechanics and Physics of Solids. 2007;55:562–588. [Google Scholar]
- Fratzl P, Misof K, Zizak I, Rapp G, Amenitsch H, Bernstorff S. Fibrillar structure and mechanical properties of collagen. Journal of Structural Biology. 1998;122:119–122. doi: 10.1006/jsbi.1998.3966. [DOI] [PubMed] [Google Scholar]
- Gao HJ, Ji BH, Jager IL, Arzt E, Fratzl P. Materials become insensitive to flaws at nanoscale: Lessons from nature. Proceedings of the National Academy of Sciences of the United States of America. 2003;100:5597–5600. doi: 10.1073/pnas.0631609100. [DOI] [PMC free article] [PubMed] [Google Scholar]
- Gautieri A, Vesentini S, Redaelli A, Buehler MJ. Hierarchical Structure and Nanomechanics of Collagen Microfibrils from the Atomistic Scale Up. Nano Letters. 2011;11:757–766. doi: 10.1021/nl103943u. [DOI] [PubMed] [Google Scholar]
- Hong Y. Mechanical properties and in vivo behavior of a biodegradable synthetic polymer microfiber-extracellular matrix hydrogel biohybrid scaffold. Biomaterials. 2011;32:3387–3394. doi: 10.1016/j.biomaterials.2011.01.025. [DOI] [PMC free article] [PubMed] [Google Scholar]
- Hsu YY, Gonzalez M, Bossuyt F, Axisa F, Vanfleteren J, De Wolf I. In situ observations on deformation behavior and stretching-induced failure of fine pitch stretchable interconnect. Journal of Materials Research. 2009;24:3573–3582. [Google Scholar]
- Hutchinson RG, Fleck NA. The structural performance of the periodic truss. Journal of the Mechanics and Physics of Solids. 2006;54:756–782. [Google Scholar]
- Jackson AP, Vincent JFV, Turner RM. THE MECHANICAL DESIGN OF NACRE. Proceedings of the Royal Society Series B-Biological Sciences. 1988;234:415–440. [Google Scholar]
- Jang K-I, Chung HU, Xu S, Lee CH, Luan H, Jeong J, Cheng H, Kim G-T, Han SY, Lee JW, Kim J, Cho M, Miao F, Yang Y, Jung HN, Flavin M, Liu H, Kong GW, Yu KJ, Rhee SI, Chung J, Kim B, Kwak JW, Yun MH, Kim JY, Song YM, Paik U, Zhang Y, Huang Y, Rogers JA. Soft network composite materials with deterministic and bio-inspired designs. Nature communications. 2015;6:6566. doi: 10.1038/ncomms7566. [DOI] [PMC free article] [PubMed] [Google Scholar]
- Jang KI, Han SY, Xu S, Mathewson KE, Zhang YH, Jeong JW, Kim GT, Webb C, Lee JW, Dawidczyk TJ, Kim RH, Song YM, Yeo WH, Kim S, Cheng HY, Il, Rhee S, Chung J, Kim B, Chung HU, Lee DJ, Yang YY, Cho M, Gaspar JG, Carbonari R, Fabiani M, Gratton G, Huang YG, Rogers JA. Rugged and breathable forms of stretchable electronics with adherent composite substrates for transcutaneous monitoring. Nature Communications. 2014;5:4779. doi: 10.1038/ncomms5779. [DOI] [PubMed] [Google Scholar]
- Ji BH. A study of the interface strength between protein and mineral in biological materials. Journal of Biomechanics. 2008;41:259–266. doi: 10.1016/j.jbiomech.2007.09.022. [DOI] [PubMed] [Google Scholar]
- Ji BH, Gao HJ. Mechanical properties of nanostructure of biological materials. Journal of the Mechanics and Physics of Solids. 2004;52:1963–1990. [Google Scholar]
- Ji BH, Gao HJ. Elastic properties of nanocomposite structure of bone. Composites Science and Technology. 2006;66:1212–1218. [Google Scholar]
- Ji BH, Gao HJ. Mechanical Principles of Biological Nanocomposites. Annual Review of Materials Research. 2010;40:77–100. [Google Scholar]
- Ji BH, Gao HJ, Hsia KJ. How do slender mineral crystals resist buckling in biological materials? Philosophical Magazine Letters. 2004;84:631–641. [Google Scholar]
- Kang SH, Shan S, Kosmrlj A, Noorduin WL, Shian S, Weaver JC, Clarke DR, Bertoldi K. Complex Ordered Patterns in Mechanical Instability Induced Geometrically Frustrated Triangular Cellular Structures. Physical Review Letters. 2014;112:098701. doi: 10.1103/PhysRevLett.112.098701. [DOI] [PubMed] [Google Scholar]
- Kang SH, Shan S, Noorduin WL, Khan M, Aizenberg J, Bertoldi K. Buckling-Induced Reversible Symmetry Breaking and Amplification of Chirality Using Supported Cellular Structures. Advanced Materials. 2013;25:3380–3385. doi: 10.1002/adma.201300617. [DOI] [PubMed] [Google Scholar]
- Kauffmann F, Ji BH, Dehm G, Gao HJ, Arzt E. A quantitative study of the hardness of a superhard nanocrystalline titanium nitride/silicon nitride coating. Scripta Materialia. 2005;52:1269–1274. [Google Scholar]
- Keten S, Xu ZP, Ihle B, Buehler MJ. Nanoconfinement controls stiffness, strength and mechanical toughness of beta-sheet crystals in silk. Nature Materials. 2010;9:359–367. doi: 10.1038/nmat2704. [DOI] [PubMed] [Google Scholar]
- Khang DY, Jiang HQ, Huang Y, Rogers JA. A stretchable form of single-crystal silicon for high-performance electronics on rubber substrates. Science. 2006;311:208–212. doi: 10.1126/science.1121401. [DOI] [PubMed] [Google Scholar]
- Kim DH, Lu NS, Ma R, Kim YS, Kim RH, Wang SD, Wu J, Won SM, Tao H, Islam A, Yu KJ, Kim TI, Chowdhury R, Ying M, Xu LZ, Li M, Chung HJ, Keum H, McCormick M, Liu P, Zhang YW, Omenetto FG, Huang YG, Coleman T, Rogers JA. Epidermal Electronics. Science. 2011;333:838–843. doi: 10.1126/science.1206157. [DOI] [PubMed] [Google Scholar]
- Kim DH, Song JZ, Choi WM, Kim HS, Kim RH, Liu ZJ, Huang YY, Hwang KC, Zhang YW, Rogers JA. Materials and noncoplanar mesh designs for integrated circuits with linear elastic responses to extreme mechanical deformations. Proceedings of the National Academy of Sciences of the United States of America. 2008;105:18675–18680. doi: 10.1073/pnas.0807476105. [DOI] [PMC free article] [PubMed] [Google Scholar]
- Kim S, Laschi C, Trimmer B. Soft robotics: a bioinspired evolution in robotics. Trends in Biotechnology. 2013;31:287–294. doi: 10.1016/j.tibtech.2013.03.002. [DOI] [PubMed] [Google Scholar]
- Komatsu K. Mechanical strength and viscoelastic response of the periodontal ligament in relation to structure. Journal of Dental Biomechanics. 2010;2010:502318. doi: 10.4061/2010/502318. [DOI] [PMC free article] [PubMed] [Google Scholar]
- Launey ME, Buehler MJ, Ritchie RO. On the Mechanistic Origins of Toughness in Bone. Annual Review of Materials Research. 2010;40:25–53. [Google Scholar]
- Lin AYM, Meyers MA. Interfacial shear strength in abalone nacre. Journal of the Mechanical Behavior of Biomedical Materials. 2009;2:607–612. doi: 10.1016/j.jmbbm.2009.04.003. [DOI] [PubMed] [Google Scholar]
- Lin KC, Lin CW. Finite deformation of 2-D laminated curved beams with variable curvatures. International Journal of Non-Linear Mechanics. 2011;46:1293–1304. [Google Scholar]
- Lu NS, Wang X, Suo ZG, Vlassak J. Metal films on polymer substrates stretched beyond 50% Applied Physics Letters. 2007;91:221909. [Google Scholar]
- Lu TJ, Chen C. Thermal transport and fire retardance properties of cellular aluminium alloys. Acta Materialia. 1999;47:1469–1485. [Google Scholar]
- Ma M, Guo L, Anderson DG, Langer R. Bio-inspired polymer composite actuator and generator driven by water gradient. Science. 2013;339:186–339. doi: 10.1126/science.1230262. [DOI] [PMC free article] [PubMed] [Google Scholar]
- Mayer G. Rigid biological systems as models for synthetic composites. Science. 2005;310:1144–1147. doi: 10.1126/science.1116994. [DOI] [PubMed] [Google Scholar]
- Meyers MA, McKittrick J, Chen PY. Structural Biological Materials: Critical Mechanics-Materials Connections. Science. 2013;339:773–779. doi: 10.1126/science.1220854. [DOI] [PubMed] [Google Scholar]
- Miserez A, Scott Wasko S, Carpenter CF, Waite JH. Non-entropic and reversible long-range deformation of an encapsulating bioelastomer. Nature Materials. 2009;8:910–916. doi: 10.1038/nmat2547. [DOI] [PubMed] [Google Scholar]
- Morin SA. Camouflage and display for soft machines. Science. 2012;337:828–832. doi: 10.1126/science.1222149. [DOI] [PubMed] [Google Scholar]
- Munch E, Launey ME, Alsem DH, Saiz E, Tomsia AP, Ritchie RO. Tough, Bio-Inspired Hybrid Materials. Science. 2008;322:1516–1520. doi: 10.1126/science.1164865. [DOI] [PubMed] [Google Scholar]
- Naik N, Caves J, Chaikof EL, Allen MG. Generation of spatially aligned collagen fiber networks through microtransfer molding. Advanced Healthcare Materials. 2014;3:367–374. doi: 10.1002/adhm.201300112. [DOI] [PMC free article] [PubMed] [Google Scholar]
- Onck PR, Andrews EW, Gibson LJ. Size effects in ductile cellular solids. Part I: modeling. International Journal of Mechanical Sciences. 2001;43:681–699. [Google Scholar]
- Ortiz C, Boyce MC. Materials science - Bioinspired structural materials. Science. 2008;319:1053–1054. doi: 10.1126/science.1154295. [DOI] [PubMed] [Google Scholar]
- Pokroy B, Kang SH, Mahadevan L, Aizenberg J. Self-organization of a mesoscale bristle into ordered, hierarchical helical assemblies. Science. 2009;323:237–240. doi: 10.1126/science.1165607. [DOI] [PubMed] [Google Scholar]
- Provenzano PP, Heisey D, Hayashi K, Lakes R, Vanderby R., Jr Subfailure damage in ligament: a structural and cellular evaluation. J Appl Physiol 1985. 2002;92:362–371. doi: 10.1152/jappl.2002.92.1.362. [DOI] [PubMed] [Google Scholar]
- Rogers JA, Someya T, Huang YG. Materials and Mechanics for Stretchable Electronics. Science. 2010;327:1603–1607. doi: 10.1126/science.1182383. [DOI] [PubMed] [Google Scholar]
- Sanchez C, Arribart H, Guille MMG. Biomimetism and bioinspiration as tools for the design of innovative materials and system. Nature Materials. 2005;4:227–288. doi: 10.1038/nmat1339. [DOI] [PubMed] [Google Scholar]
- Schaffer TE, IonescuZanetti C, Proksch R, Fritz M, Walters DA, Almqvist N, Zaremba CM, Belcher AM, Smith BL, Stucky GD, Morse DE, Hansma PK. Does abalone nacre form by heteroepitaxial nucleation or by growth through mineral bridges? Chemistry of Materials. 1997;9:1731–1740. [Google Scholar]
- Shergold OA, Fleck NA, Radford D. The uniaxial stress versus strain response of pig skin and silicone rubber at low and high strain rates. International Journal of Impact Engineering. 2006;32:1384–1402. [Google Scholar]
- Simmons AH, Michal CA, Jelinski LW. Molecular orientation and two-component nature of the crystalline fraction of spider dragline silk. Science. 1996;271:84–87. doi: 10.1126/science.271.5245.84. [DOI] [PubMed] [Google Scholar]
- Song F, Bai YL. Mineral bridges of nacre and its effects. Acta Mechanica Sinica. 2001;17:251–257. [Google Scholar]
- Tang Z, Kotov NA, Magonov S, Ozturk B. Nanostructured artificial nacre. Nature Materials. 2003;2:413–418. doi: 10.1038/nmat906. [DOI] [PubMed] [Google Scholar]
- Taylor M, Francesconi L, Gerendas M, Shanian A, Carson C, Bertoldi K. Low Porosity Metallic Periodic Structures with Negative Poisson's Ratio. Advanced Materials. 2014;26:2365–2370. doi: 10.1002/adma.201304464. [DOI] [PubMed] [Google Scholar]
- Timoshenko S, Gere J. Theory of Elastic Stability. New York: McGraw-Hill; 1961. [Google Scholar]
- Wang AJ, McDowell DL. In-plane stiffness and yield strength of periodic metal honeycombs. Journal of Engineering Materials and Technology-Transactions of the Asme. 2004;126:137–156. [Google Scholar]
- Wegst UGK, Bai H, Saiz E, Tomsia AP, Ritchie RO. Bioinspired structural materials. Nature Materials. 2015;14:23–36. doi: 10.1038/nmat4089. [DOI] [PubMed] [Google Scholar]
- Weiner S, Addadi L. Design strategies in mineralized biological materials. Journal of Materials Chemistry. 1997;7:689–702. [Google Scholar]
- Widlund T, Yang SX, Hsu YY, Lu NS. Stretchability and compliance of freestanding serpentine-shaped ribbons. International Journal of Solids and Structures. 2014;51:4026–4037. [Google Scholar]
- Wong TS. Bioinspired self-reparing slippery surfaces with pressure-stable omniphobicity. Nature. 2011;477:443–447. doi: 10.1038/nature10447. [DOI] [PubMed] [Google Scholar]
- Xu F, Zhu Y. Highly Conductive and Stretchable Silver Nanowire Conductors. Advanced Materials. 2012;24:5117–5122. doi: 10.1002/adma.201201886. [DOI] [PubMed] [Google Scholar]
- Xu S, Zhang YH, Jia L, Mathewson KE, Jang KI, Kim J, Fu HR, Huang X, Chava P, Wang RH, Bhole S, Wang LZ, Na YJ, Guan Y, Flavin M, Han ZS, Huang YG, Rogers JA. Soft Microfluidic Assemblies of Sensors, Circuits, and Radios for the Skin. Science. 2014;344:70–74. doi: 10.1126/science.1250169. [DOI] [PubMed] [Google Scholar]
- Yannas IV, Burke JF. DESIGN OF AN ARTIFICIAL SKIN .1. BASIC DESIGN PRINCIPLES. Journal of Biomedical Materials Research. 1980;14:65–81. doi: 10.1002/jbm.820140108. [DOI] [PubMed] [Google Scholar]
- Yao HM, Gao HJ. Multi-scale cohesive laws in hierarchical materials. International Journal of Solids and Structures. 2007;44:8177–8193. [Google Scholar]
- Yao SS, Zhu Y. Wearable multifunctional sensors using printed stretchable conductors made of silver nanowires. Nanoscale. 2014;6:2345–2352. doi: 10.1039/c3nr05496a. [DOI] [PubMed] [Google Scholar]
- Yao SS, Zhu Y. Nanomaterial-Enabled Stretchable Conductors: Strategies, Materials and Devices. Advanced Materials. 2015;27:1480–1511. doi: 10.1002/adma.201404446. [DOI] [PubMed] [Google Scholar]
- Zhang YH, Fu HR, Xu S, Fan JA, Hwang KC, Jiang JQ, Rogers JA, Huang YG. A hierarchical computational model for stretchable interconnects with fractal-inspired designs. Journal of the Mechanics and Physics of Solids. 2014;72:115–130. [Google Scholar]
- Zhang YH, Qu XM, Fang DN. Mechanical properties of two novel planar lattice structures. International Journal of Solids and Structures. 2008;45:3751–3768. [Google Scholar]
- Zhang YH, Xu S, Fu HR, Lee J, Su J, Hwang KC, Rogers JA, Huang Y. Buckling in serpentine microstructures and applications in elastomer-supported ultra-stretchable electronics with high areal coverage. Soft Matter. 2013;9:8062–8070. doi: 10.1039/C3SM51360B. [DOI] [PMC free article] [PubMed] [Google Scholar]
- Zhang ZQ, Liu B, Huang Y, Hwang KC, Gao H. Mechanical properties of unidirectional nanocomposites with non-uniformly or randomly staggered platelet distribution. Journal of the Mechanics and Physics of Solids. 2010;58:1646–1660. [Google Scholar]
- Zhang ZQ, Zhang YW, Gao HJ. On optimal hierarchy of load-bearing biological materials. Proceedings of the Royal Society B-Biological Sciences. 2011;278:519–525. doi: 10.1098/rspb.2010.1093. [DOI] [PMC free article] [PubMed] [Google Scholar]
Associated Data
This section collects any data citations, data availability statements, or supplementary materials included in this article.


