ABSTRACT
We attempted to clarify the storage iron metabolism from the change in the serum ferritin level. We assumed that the nonlinear decrease in serum ferritin was caused by serum ferritin increase in iron mobilization. Under this assumption, we determined both ferritin and hemosiderin iron levels by computer-assisted simulation of the row of decreasing assay-dots of serum ferritin in 11 patients with normal iron stores free of both iron deficiency and iron overload; chronic hepatitis C (CHC) and iron deficiency anemia after treatment, and 11 patients with iron overload; hereditary hemochromatosis (HH) and transfusion-dependent anemias (TD). We determined the iron removal rates of 20 and 17 mg/day by administering mean doses of deferasirox at 631 and 616 mg/day in 2 TD during the period of balance of iron addition and removal as indicated by the serum ferritin returned to the previous level. The ferritin-per-hemosiderin ratio was almost the same in both HH and CHC. This matched the localized hepatic hemosiderin deposition in CHC with normal iron stores. We detected the ferritin increased by utilizing the hemosiderin iron in iron removal and the ferritin reduced by transforming ferritin into hemosiderin in iron additions. The iron storing capacity of hemosiderin was limitless, while that of ferritin was suppressed when ferritin iron exceeded around 5 grams. We confirmed the pathway of iron from hemosiderin to ferritin in iron mobilization, and that from ferritin to hemosiderin in iron deposition. Thus, serum ferritin kinetics enabled us to be the first to clinically clarify storage iron metabolism.
Key Words: Serum ferritin kinetics, Determination of ferritin and hemosiderin, Iron overload, Chronic hepatitis C, Storage iron metabolism
INTRODUCTION
Since the human body lacks a function to excrete excessive iron, it is stored in the form of ferritin and hemosiderin to minimize the toxicity of iron. However, life expectancies1-3) are shortened if patients with iron overload are not treated. To remove the overload, phlebotomy has been performed on patients with iron overload without anemia. However, the iron removal from anemia patients has proved difficult even using the iron chelating agent desferrioxamine for intravenous use. After introducing a new iron chelating agent deferasirox for oral use, iron removal from patients with anemias noticeably improved.4-6)
Although ferritin and hemosiderin were studied experimentally by Shoden et al.7) using the chemical fractionation of liver and spleen samples, a satisfactory clinical method for determining ferritin and hemosiderin still remains to be developed. After around 2 decades, a radioimmunoassay method for serum ferritin was developed in 1972 by Addison et al.8), and in 1975 Jacobs et al.9) revealed that serum ferritin was an important indicator of iron stores clinically available for the diagnosis and therapy of iron deficiency anemia and iron overload. However, serum ferritin did not always accurately reflect total iron stores, because it originated from tissue ferritin, not hemosiderin. Therefore, we attempted to develop a clinical method for determining hemosiderin iron by assessing serum ferritin based on assumptions suggested by the close metabolic relationship between ferritin and hemosiderin.7,10)
Our paper reports a method for determining ferritin and hemosiderin using a computer-simulated serum ferritin decrease curve together with the storage iron metabolism in patients with normal iron stores and iron overload.
Criteria of the terms we used in this paper are shown in Table 1.
Table 1.
Classification of iron status according to the level of iron stores
A note on the criteria of our terminology: The term “Normal iron stores” in this study denotes the level of iron stores between iron deficiency and iron overload regardless of disease or iron distribution in the body. (Generally recognized iron stores in a normal male are 0.5 to 1.0 gram, while those in a female are 1/3 to 1/4 times those of a normal male.)
The distinction between the state of iron decrease within the normal iron stores and iron deficiency is clear-cut, whereas that between the state of iron increase within normal iron stores and iron overload is not; a transitional zone between normal iron increase and iron overload was allowed. Generally, symptoms of iron overload appear when the serum ferritin level is above 1000 ng/ml.
| Iron deficiency –/+ symptom | < | Normal iron stores | < | Iron overload –/+ symptom |
|---|---|---|---|---|
| Serum ferritin ng/ml | <12 | 250~500< | ||
| Iron stores g | <0.1 | 2.5~5.0< | ||
| Hemosiderin* | – | –/+ + | ++ +++ |
* Microscopically detectable.
MATERIALS AND METHODS
Materials
Patients
Iron overload: Eight patients (#1 to #511), #6, 712)) and #813) with HH, and 3 patients with transfusion-dependent anemias (TD); #9 with myelodysplastic syndrome (MDS) and myelofibrosis, #10 with aplastic anemia, and #11 with MDS.
Normal iron stores without iron deficiency or iron overload: Ten patients from #12 to #2114-16) with chronic hepatitis C (CHC) in a steady state without anemia, and patient #22 treated for iron deficiency anemia (TIDA) whose hemoglobin was normalized after intravenous iron infusion therapy.
Patients other than #22 with blood loss and an uncertain transfusion record were excluded from this study.
Serum ferritin assay kit
Products of Fujirebio Incorporated (Tokyo, Japan) and Denka Seiken (Tokyo, Japan) were used.
Iron chelating agent
Deferasirox (Exjade/ICL670), product of Novartis Pharma (Basel, Switzerland).
Computer
PC-LL750DS6C, product of NEC (Tokyo, Japan).
Methods
Blood loss
Detected by fecal immunochemical occult blood tests and macroscopic findings.
Serum ferritin
It was performed as determined by an enzyme-immunoassay using chemical luminescence at Nagoya University Hospital and by one using latex agglutination at the National Hospital Organization Nagoya Medical Center. For each different assay system, an inter-assay system correction was performed, except for the HH cases.
Initial serum ferritin before iron removal was obtained by extrapolating the serum ferritin decrease curve to zero time.
Iron removal rate
We detected the iron balance by the return of serum ferritin to its previous level as a zero-sum of iron addition, and its removal in the course of iron removal therapy. Iron removal rates were calculated from the amount of transfusional iron during the days of iron balance.
Iron stores
In HH and CHC, iron stores were determined by phlebotomy11-13,15-17) from the total amount of blood removed to the level of iron deficiency. In TD, iron stores were calculated from the iron content in the units of red cell transfusion. All the transfusional iron was thought to be stored in TD in a steady state, except in cases with blood loss.
Patients were recommended to take a diet low in iron to minimize the effect of dietary iron absorption.
Increasing component of serum ferritin
We assumed that tissue ferritin iron was increased by taking iron out of hemosiderin in iron mobilization, and further assumed that the values of serum ferritin increase were proportional to the difference between the values before and after iron mobilization. The assumptions described above were suggested by the iron density gradient in homeostasis.18)
Based on those assumptions, a formula for determining the increasing component of serum ferritin was made as follows.
Increasing component of serum ferritin = [initial serum ferritin – serum ferritin after each amount (gram) of iron removal] × constant
A series of serum ferritin values assayed in iron mobilization was composed of the sum of decreasing component and increasing component of serum ferritin for unit of time.
This formula was applicable to the condition in which serum ferritin decreased at a constant rate over a unit of time in iron mobilization. The formula was available for assessments of the reduction of serum ferritin in iron additions.
Process of computer simulation by spreadsheet application
The serum ferritin decrease curve was composed of two elements; one was a decreasing component and the other an increasing component, where the decreasing component was larger than the increasing component in the course of iron mobilization.
The amount of serum ferritin increase was determined by setting the computer program for iron mobilization by a small division of total iron stores.
For the assay data, serum ferritin decrease curves were produced using computer simulation by slightly changing the serum ferritin decrements and proportionality constants. Among those curves plotted on a graph, the one best fit to the actually assayed data was adopted.
The serum ferritin decreasing curve without increasing component was then obtained by subtracting serum ferritin increasing component from the serum ferritin decreasing curve.
Fig. 1 shows the two kinds of serum ferritin decreasing curves;
Fig. 1.
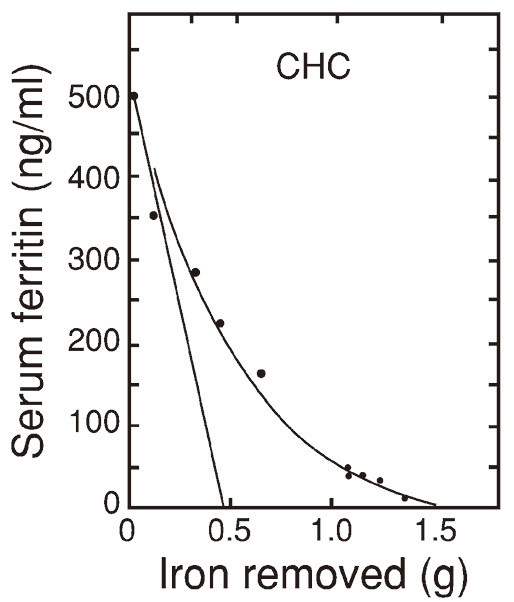
Concave serum ferritin decrease curve and straight serum ferritin decrease curve of those determined in patient #12 with chronic hepatitis C (CHC)
The concave serum ferritin decreasing curve indicates a curve of decreasing serum ferritin including increasing component, i.e. the sum of decreasing component and increasing component of serum ferritin.
The straight line indicates the curve of a net serum ferritin decreasing without increasing component.
The intersection of the straight line and the horizontal axis scaled for grams of iron indicates the sum of the tissue ferritin iron removed, excluding the tissue ferritin iron increased. The end point of the concave decrease curve on the horizontal axis indicates the total iron stores removed. The total hemosiderin iron removed is obtained by subtracting the sum of the tissue ferritin iron removed from the total iron stores removed.
RESULTS
The trend of serum ferritin decrease in 2 TD treated by 20 mg/kg/day of deferasirox continued at a steady pace for about one year. However, the serum ferritin began to increase (rebound) in patient #9 when deferasirox was interrupted 3 times at 28, 28 and 22 days due to gastrointestinal side effects in patient #9, and by reducing the dose and then increasing the blood transfusion in patient #10.
Iron balance in such cases was recognized from the serum ferritin returned to the previous level after the decrease and increase (rebound).
The iron removal rates by deferasirox determined in the period of iron balance in these cases are shown in Table 2. The iron removal rates of 32 and 27 mg/day by the dose converted to correspond to 1000 mg/day of deferasirox were comparable to the rate of 28 mg/day measured by phlebotomy, by which 15 grams of total iron stores were removed in 18 months in patient #3 with HH11).
Table 2.
Iron removal rate determined in the period of iron balance in 2 patients with transfusion-dependent anemia (TD)
Iron added by transfusion was removed by deferasirox during the period of iron balance.
According to the trend of dose-dependent effects of deferasirox, the iron removal rate by the mean dose converted to correspond to 1000 mg/day of deferasirox is shown in parentheses. *“Mean dose” denotes the average amount of deferasirox administered in the period of iron balance.
| Patient | Mean* dose | Iron added | Iron balanced | Iron removal rate | ||||
|---|---|---|---|---|---|---|---|---|
| Disease | No. | Sex | Age | Wt | mg/day | mg | day | mg/day |
| TD | 9 | F | 59 | 65 | 616 | 4000 | 203 | 19.7 (32.0) |
| TD | 10 | M | 51 | 61 | 631 | 3800 | 225 | 16.9 (26.8) |
Abbreviation: Wt, body weight (kg).
In all the cases examined, the sudden steep decrease of serum ferritin was observed soon after iron mobilization (Fig. 1 and Fig. 2). The serum ferritin decrease slowed thereafter according to the progress of iron mobilization.
Fig. 2.
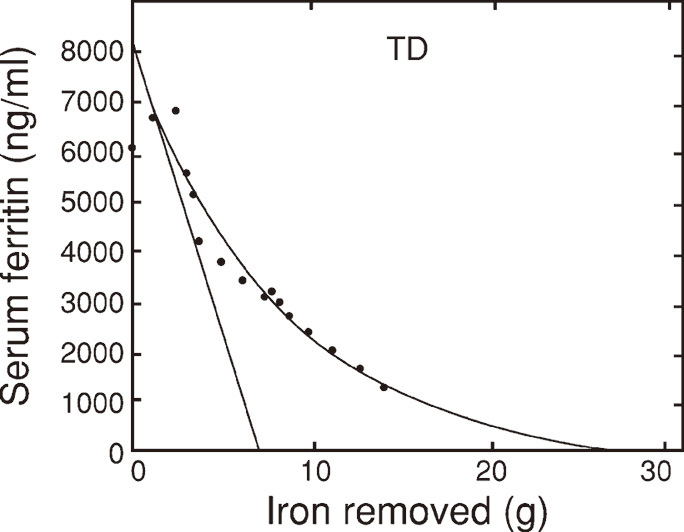
Concave serum ferritin decrease curve and straight serum ferritin decrease curve of those determined in patient #9 with transfusion-dependent anemia (TD)
The pattern of serum ferritin decreasing curves in patients with normal iron stores (TIDA and CHC) and that in patients with iron overload (HH and TD) showed similar trend. However, the inclination of the decrease curves at the left lower corner in Fig. 3a was smaller than that of the curves in Fig. 3b.
Fig. 3.
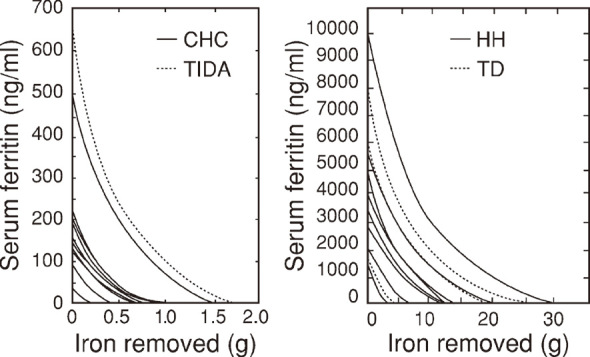
Curves obtained by computer simulation of the trend in serum ferritin decrease in patients with normal iron stores (Fig. 3a) and those with iron overload (Fig. 3b)
In Fig. 3a, solid curves indicate chronic hepatitis C (CHC) and dotted curve indicates treated iron deficiency anemia (TIDA).
In Fig. 3b, solid curves indicate hereditary hemochromatosis11-13) (HH) and dotted curves indicate transfusion-dependent anemia (TD).
A prompt increase in the serum ferritin level was observed soon after an intravenous iron infusion or blood transfusion. The increase slowed thereafter according to the progress of iron deposition.
The mean±SDs of the ferritin-per-hemosiderin iron ratios in HH of 14.4 g and CHC of 0.8 g of average total iron stores were 0.7±0.8 for HH and 0.7±0.7 for CHC as calculated from Table 3.
Table 3.
Initial serum ferritin, ferritin iron, hemosiderin iron and total iron stores in patients with hereditary hemochromatosis (HH), transfusion-dependent anemia (TD), or chronic hepatitis C (CHC) and treated iron deficiency anemia (TIDA)
| Patient | Initial serum ferritin | Ferritin iron | Hemosideriniron | Total iron stores | |||||||
|---|---|---|---|---|---|---|---|---|---|---|---|
| Disease | No. | Sex | ng/ml | g | (%) | g | (%) | g | (%) | ||
| HH | 1 | M | 10000 | 8 | (27) | 22 | (73) | 30 | (100) | ||
| HH | 2 | M | 6000 | 8 | (44) | 10 | (56) | 18 | (100) | ||
| HH | 3 | M | 5000 | 8 | (53) | 7 | (47) | 15 | (100) | ||
| HH | 4 | M | 3000 | 7.5 | (58) | 6.5 | (42) | 13 | (100) | ||
| HH | 5 | M | 4000 | 6 | (46) | 7 | (52) | 13 | (100) | ||
| HH | 6 | M | 1800 | 1 | (25) | 3 | (75) | 4 | (100) | ||
| HH | 7 | M | 4000 | 4 | (29) | 10 | (71) | 14 | (100) | ||
| HH | 8 | M | 2200 | 2 | (25) | 6 | (75) | 8 | (100) | ||
| TD | 9 | F | 8000 | 7 | (26) | 19 | (74) | 26 | (100) | ||
| TD | 10 | M | 1700 | 3.2 | (70) | 1.3 | (30) | 4.5 | (100) | ||
| TD | 11 | M | 5800 | 3.6 | (21) | 13.4 | (79) | 17 | (100) | ||
| CHC | 12 | M | 500 | 0.5 | (33) | 1.0 | (67) | 1.5 | (100) | ||
| CHC | 13 | M | 200 | 0.2 | (22) | 0.7 | (78) | 0.9 | (100) | ||
| CHC | 14 | M | 152 | 0.4 | (36) | 0.7 | (64) | 1.1 | (100) | ||
| CHC | 15 | M | 225 | 0.4 | (50) | 0.4 | (50) | 0.8 | (100) | ||
| CHC | 16 | M | 128 | 0.3 | (40) | 0.4 | (60) | 0.7 | (100) | ||
| CHC | 17 | M | 216 | 0.3 | (30) | 0.7 | (70) | 1.0 | (100) | ||
| CHC | 18 | M | 145 | 0.4 | (50) | 0.4 | (50) | 0.8 | (100) | ||
| CHC | 19 | M | 132 | 0.3 | (50) | 0.3 | (50) | 0.6 | (100) | ||
| CHC | 20 | M | 81 | 0.1 | (33) | 0.3 | (67) | 0.4 | (100) | ||
| CHC | 21 | M | 28 | 0.1 | (60) | 0.1 | (40) | 0.2 | (100) | ||
| TIDA | 22 | F | 700 | 0.5 | (29) | 1.2 | (71) | 1.7 | (100) | ||
The correlation curve between initial serum ferritin and iron stores in patients with normal iron stores (TIDA and CHC) was curvilinear (Fig. 4a). The curve converged toward the iron deficiency in the lower range of iron stores. The correlation curve in patients with iron overload did not show such bend (Fig. 4b).
Fig. 4.
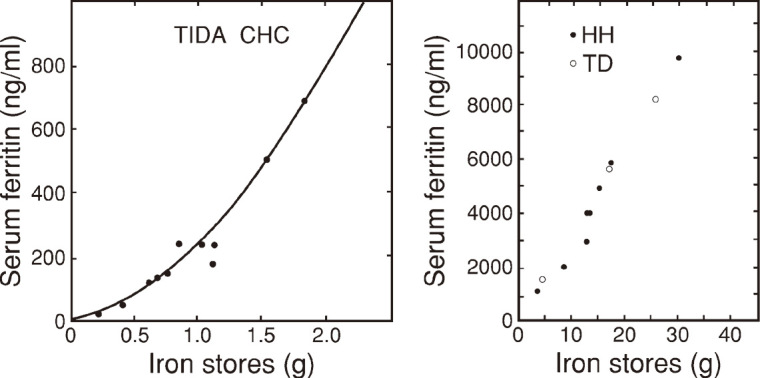
Correlation between initial serum ferritin and iron stores in patients with normal iron stores (Fig. 4a) and those with iron overload (Fig. 4b)
In Fig. 4a, black dots indicate both treated iron deficiency anemia (TIDA) and chronic hepatitis C (CHC).
In Fig. 4b, closed circles indicate hereditary hemochromatosis11-13) (HH) and open circles indicate transfusion-dependent anemia (TD).
Hemosiderin iron was detected even in the lower levels of normal iron stores (Fig. 5) and the amount of ferritin iron was comparable to that of hemosiderin below around 5 gram of ferritin iron.
Fig. 5.
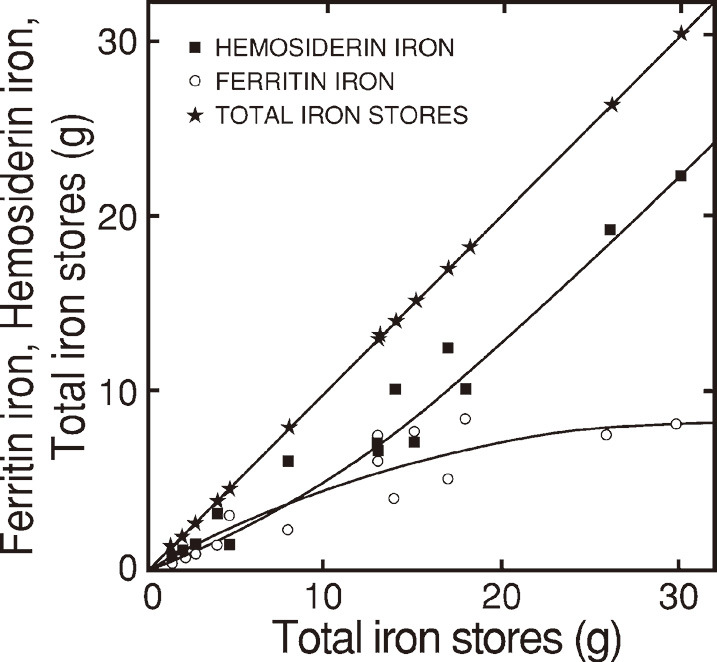
Hemosiderin iron (black squares), ferritin iron (open circles) in relation to total iron stores (black stars)
Total iron stores as the sum of ferritin iron and hemosiderin iron are plotted for both vertical and horizontal scales. Hemosiderin iron and ferritin iron are plotted vertically. Fig. 5 was composed of data in Table 3.
The increase of ferritin iron was reduced gradually above around 5 grams of ferritin iron, while that of hemosiderin iron was progressive in accordance with the increase of total iron stores (Fig. 5).
DISCUSSION
Methods for determining iron stores
Iron removal
Phlebotomy is the most effective method for removing iron for HH11-13) and CHC.15,16) It is also the most accurate clinically available method for determining total body iron stores.17) In addition, we determined the serum ferritin decreasing curve by using deferasirox as was done by phlebotomy. Novartis Pharma estimated the iron removal rate by deferasirox collecting excreta for 7 days without a recovery correction. This would result in an underestimation of the iron removal rate, because it took at least two weeks for the completion of an excretion of orally administered iron.19) Instead of using such a tedious method, we were able to measure the iron removal rate free from stool collection-related errors.
Magnetic resonance imaging (MRI)
Body surface monitoring methods other than MRI are not adopted for the clinical assessments of iron stores. Jensen et al.20) reported the correlation between serum ferritin and MRI liver iron. The latter appeared correlated with serum ferritin in a higher iron overload range. Although accuracy is needed for the early detection of iron overload, the correlation was not good in the lower iron overload range, which corresponds to the serum ferritin level below 1000 ng/ml. The limitations of MRI liver iron were also reported by Angelucci et al.21)
Serum ferritin
According to the report by Jacobs et al.9), a rate22) and a formula23) were proposed for the conversion from serum ferritin into iron stores. However, such conversion methods did not always reflect the amount of iron stores, because serum ferritin could not reflect hemosiderin iron. Serum ferritin may render a value higher than the actual storage iron level in patients with various inflammations, malignancies and hyperferritinemia cataract syndromes. Therefore, we excluded such suspected overestimation cases by clinical symptoms and examinations; such as c-reactive protein, transaminase and others. Despite such disadvantages, serum ferritin has been evaluated as an index superior to transferrin saturation24) and total iron-binding capacity25) not only for the differential diagnosis of iron deficiency anemia from other hypochromic anemias, but also for the diagnosis of iron overload. Therefore, serum ferritin has been widely4-6,9,11-16,21,22,26,27) used for routine clinical examination of iron metabolism in various diseases.
We regularly followed up serum ferritin decreases. This work should be done along with iron removal therapy. Although the follow-up period for iron removal therapy is lengthy, the process of serum ferritin assay and computer simulation are not time consuming. By using the serum ferritin decrease curve, we clinically determined the iron removal rates and the quantities of iron in ferritin and hemosiderin.
Storage iron metabolism
Ferritin and hemosiderin in CHC and HH
The inclinations of serum ferritin decreasing curves were milder (Fig. 3a) and the values of serum ferritin in the correlation curve (Fig. 4a) were smaller in the lower range than those in the higher range of iron stores. These results suggest that the ferritin synthesis in CHC was suppressed by iron insufficiency, since hemoglobin synthesis was limited by iron deficiency.28) Although iron stores in HH were 18 times higher than those in CHC and the majority of them were stored in the form of hemosiderin in HH, the ferritin-per-hemosiderin iron ratio of CHC to HH was almost the same. This finding matches the localized increase of hemosiderin iron deposition in the liver of CHC with normal iron stores.15,16)
Response of ferritin and hemosiderin to iron mobilization
Finch et al.29) reported that the iron release from hemosiderin granules would prove difficult if it were so large as to disturb cell function. However, iron mobilization, even from such hemosiderin, seemed complete after a long-term intensive iron removal to the state of iron deficiency,17) so that the total amount of removed iron seems appropriate as the correct amount of total body iron stores.
The initial rapid decrease of serum ferritin soon after iron removal indicated the prompt decrease of ferritin. The slow serum ferritin decrease thereafter seemed to reflect the ferritin increased by utilizing hemosiderin iron in iron mobilization. The pattern of serum ferritin decreases appeared to indicate that the response of ferritin to iron removal is faster than that of hemosiderin.
Shoden et al.7) proposed a question marked iron pathway from ferritin to hemosiderin in iron mobilization. Such a pathway seems unlikely because its direction is contrary to the iron flow in iron mobilization. They also proposed a pathway of direct iron mobilization from hemosiderin. However, such a pathway seems unlikely in the circumstance where the ferritin is actively synthesized by taking iron out of hemosiderin.
Both the transferrin-bound iron and non transferrin-bound iron that entered the cell became intracellular intermediate transitory non-storage iron known as a “labile iron pool (LIP)”.30,31) The recovery of tissue ferritin utilizing LIP in iron mobilization7) seems unlikely because the iron flows from ferritin to LIP in iron mobilization and because the increase of LIP utilizing ferritin iron in the negative iron balance was demonstrated by Konijn et al.31) Therefore, hemosiderin had to be the only iron source for the increase of ferritin in iron mobilization. The abovementioned evidence indicated the existence of an iron pathway from hemosiderin to ferritin in iron mobilization.
Response of ferritin and hemosiderin to iron deposition
Shoden et al.7 proposed a pathway from hemosiderin to ferritin in iron deposition. This seems unlikely because its direction is contrary to the iron flow in iron deposition. They also proposed a direct pathway from LIP to hemosiderin bypassing the ferritin synthesis in iron deposition. However, the detection of radio-iron in hemosiderin fractions separated from the tissue homogenate soon after a radio-iron addition does not always indicate direct radio-iron incorporation into hemosiderin, since it proved difficult to distinguish contamination (adhesion) from incorporation. Furthermore, such a pathway seems unlikely because intracellular iron must have been involved in the active ferritin synthesis as indicated by the prompt serum ferritin increase soon after an intravenous iron infusion into iron deficiency anemia.26,27)
A reduction of the increase in ferritin iron and the linear increase of hemosiderin iron according to the increase in iron deposition implied that the capacity for storing iron in the form of ferritin was suppressed, whereas that in the form of hemosiderin was limitless (Fig. 5). The same trends as those mentioned above were observed biochemically.7) The slow increase of serum ferritin after its initial rapid increase in iron depositions reflected the effect of reduction in tissue ferritin by the transformation of ferritin into hemosiderin as demonstrated by Matioli et al.32) and Miyazaki et al.33) The abovementioned evidence indicated the existence of an iron pathway from ferritin to hemosiderin in iron deposition.
Thus, we were able to confirm the iron pathways from hemosiderin to ferritin in iron mobilization and from ferritin to hemosiderin in iron deposition (Fig. 6).
Fig. 6.
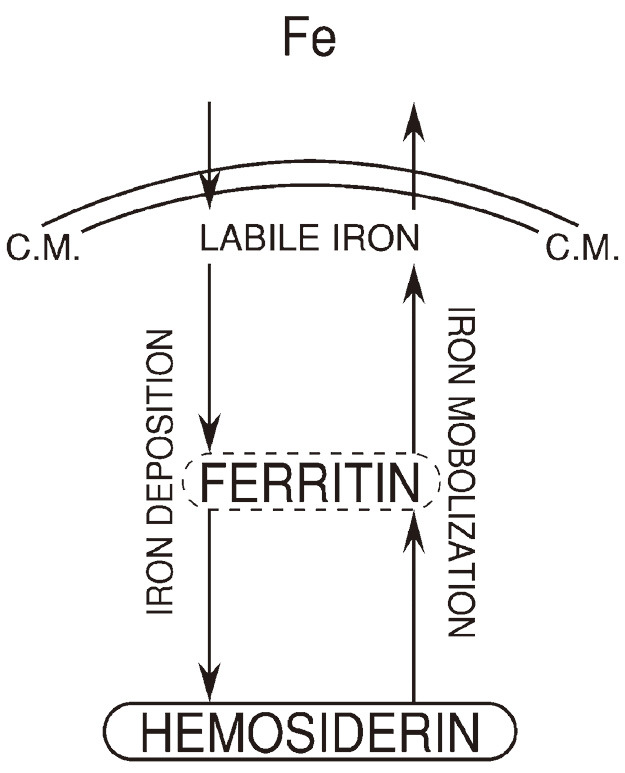
Pathways of storage iron metabolism confirmed
“Fe” in the extracellular space indicates both transferrin-bound iron and non transferrin-bound iron. “C.M.” indicates cell membrane.
ACKNOWLEDGMENTS
We sincerely wish to thank Mr. Kenji Utsumi of the former staff of Sony Corporation, for his kind assistance in the computer simulation, and Dr. Makoto Utsumi, vice president of the National Hospital Organization Nagoya Medical Center, for his valuable coordination with the staff members, and Dr. Thornton Sargent of the former staff of the Donner Laboratory, the University of California Berkeley for his gracious comments.
We also wish to express our cordial thanks for the permission to reuse figures granted by Wolters Kluwer Health, the copyright holder of Medicine,11) by Elsevier, that of Gastroenterology12) and by John Wiley & Sons, that of the American Journal of Hematology.13)
REFERENCES
- 1).Ambross G, Zweier JL, Jacobs WE, Weisfeld ML, Fluharty JL. Improvement of postischemic myocardial function and metabolism by administration of desferrioxamine at the time of reflow. The role of iron in the pathogenesis of reperfusion injury. Circulation, 1987; 76 (4): 906–915. [DOI] [PubMed]
- 2).Sullivan JL. The iron paradigm of ischemic heart disease. Am Heart J, 1989; 117 (5): 1177–1188. [DOI] [PubMed]
- 3).Stevens RG, Jones DY, Micozzi MS, Taylor PR. Body iron stores and the risk of cancer. New Engl J Med, 1988; 319 (16): 1047–1052. [DOI] [PubMed]
- 4).Olivieri NF, Brittenham GM. Iron-chelating therapy and the treatment of thalassemia. Blood, 1997; 89 (3): 739–761. [PubMed]
- 5).Cappellini MD, Cohen A, Piga A, Bejaoui M, Perrotta S, Agaoglu L, Aydinok Y, Kattamis A, Kilinc Y, Porter J, Capra M, Galanello R, Fattoum S, Drelichman G, Magnano C, Verissimo M, Athanassiou-Metaxa A, Giardina P, Kourakli-Symeonidis A, Janka-Schaub G, Coates T, Vermylen C, Olivieri N, Thuret I, Opitz H, Ressayre-Djaffer C, Marks P, Alberti D. A phase 3 study of deferasirox (ICL670), a once a daily oral iron chelator, in patients with β-thalassemia. Blood; 2006; 107 (9): 3455–3462. [DOI] [PubMed]
- 6).Miyazawa K, Ohyashiki K, Urabe A, Hatta T, Nakao S, Ozawa K, Ishikawa T, Kato J, Tatsumi Y, Mori H, Kondo M, Taniguchi J, Tanii H Rojkjaer L, Omine M. A safety, pharmacokinetic and pharmacodynamic investigation of deferasirox (Exjade, ICL670) in patients with transfusion-dependent anemias and iron-overload: a Phase I study in Japan. Int J Hematol, 2008; 88 (1): 73–81. [DOI] [PubMed]
- 7).Shoden A, Gabrio BW, Finch CA. The relationship between ferritin and hemosiderin in rabbits and man. J Biol Chem, 1953; 204 (2): 823–830. [PubMed]
- 8).Addison GM, Beamish MR, Hales CN, Hodgkins M, Jacobs A, Llewellin P. An immunoradiometric assay for ferritin in the serum of normal subjects and patients with iron deficiency and iron overload. J Clin Path, 1972; 25 (4): 326–329. [DOI] [PMC free article] [PubMed]
- 9).Jacobs A, Worwood M. Ferritin in serum: clinical and biochemical implications. New Engl J Med, 1975; 292 (18): 951–956. [DOI] [PubMed]
- 10).Saito H. Studies on storage iron; dynamic behavior of ferritin and hemosiderin under various experimental conditions. Nagoya J Med Sci, 1958; 21 (4): 288–300.
- 11).Milder MS, Cook JD, Finch CA. Idiopathic hemochromatosis: an interim report. Medicine, 1980; 59 (1): 34–49. [DOI] [PubMed]
- 12).Prieto J, Barry M, Sherlock S. Serum ferritin in patients with iron overload and with acute and chronic liver disease. Gastroenterology, 1975; 68 (3): 525–533. [PubMed]
- 13).van Oost BA, van den Beld B, van Asbeck BS, Marx JJM. Monitoring of intensive phlebotomy therapy in iron overload by serum ferritin assay. Am J Hematol, 1985; 18 (1): 7–12. [DOI] [PubMed]
- 14).Saito H. Serum ferritin. In the Clinical Disorders of Iron Metabolism-From Iron Deficiency to Iron Overload-, edited by H. Saito. pp. 92–94, 1999, Iyaku (Medicine & Drug) Journal Co., Ltd. (in Japanese), Osaka and Tokyo.
- 15).Hayashi H, Takikawa T, Nishimura N, Yano T, Isomura T, Sakamoto N. Improvement of serum aminotransferase levels after phlebotomy in patients with chronic active hepatitis C and excess iron. Am J Gastroenterology, 1994; 89 (7): 986–988. [PubMed]
- 16).Shiono Y, Hayashi H, Wakusawa S, Sanae F, Takikawa T, Yano M, Yoshioka K, Saito H. Body iron stores and iron restoration rate in Japanese patients with chronic hepatitis C as measured during therapeutic iron removal revealed neither increased body iron stores nor effects of C282Y and H63D mutations on iron indices. Nagoya J Med Sci, 2001; 64 (1-2): 51–57. [PubMed]
- 17).Haskins D, Stevens AR Jr, Finch SC, Finch CA. Iron metabolism; iron stores in man as measured by phlebotomy. J Clin Invest, 1952; 31(6): 543–547. [DOI] [PMC free article] [PubMed]
- 18).Fleming RE, Bacon BR. Perspective. Orchestration of iron homeostasis. N Engl J Med, 2005; 352 (17): 1741–1744. [DOI] [PubMed]
- 19).Saito H, Sargent T, Parker HG, Lawrence JH. Iron absorption in normal man. Proc. 9th Congress International Society of Haematology, September 6–15, 1962, Mexico City, 1962; 3: 511–522.
- 20).Jensen PD, Jensen FT, Christensen T, Ellegaard J. Non invasive assessment of tissue iron overload in the liver by magnetic resonance imaging. Brit J Haemat, 1994; 87 (1): 171–184. [DOI] [PubMed]
- 21).Angelucci E, Giovagnoni A, Valeri G, Paci E, Ripalti M, Muretto P, McLaren C, Brittenham GM, Lucarelli G. Limitation of magnetic resonance imaging in measurement of hepatic iron. Blood, 1997; 90 (12): 4736–4742. [PubMed]
- 22).Walters GO, Miller FM, Worwood M. Serum ferritin concentration and iron stores in normal subjects, J Clin Path, 1973; 26 (10):770–772. [DOI] [PMC free article] [PubMed]
- 23).Cook JD, Skikne BS, Lynch SR, Reusser ME. Estimates of iron sufficiency in the US population. Blood, 1986; 68 (3): 726–731. [PubMed]
- 24).Saito H. Clinical aspects on total iron-binding capacity (TIBC), unsaturated iron-binding capacity (UIBC) and serum iron (SI) Acta Haematol Jpn, 1978; 41 (6): 1277–1284. [PubMed]
- 25).Saito H and Hotta T. Iron-binding proteins for the diagnosis and therapy of iron deficiency states. Acta Haematol Jpn, 1986; 49 (8): 196–204. [PubMed]
- 26).Saito H, Kawamura Y. Storage iron decrease rates and their clinical significance in iron deficiency patients following intravenous iron therapy. Jpn J Clin Hematol (in Japanese), 1999; 40 (11): 112–118. [PubMed]
- 27).Saito H, Maeda H. Method for determining the amount of blood loss using the storage iron decrease rate as obtained from serum ferritin after intravenous iron therapy. Jpn J Clin Hematol (in Japanese), 2004; 45 (11): 1177–1180. [PubMed]
- 28).Finch S, Haskins D, Finch CA. Iron metabolism; hematopoiesis following phlebotomy; iron as a limiting factor. J Clin Invest, 1950; 29 (8): 1078–1086. [DOI] [PMC free article] [PubMed]
- 29).Finch CA, Hegsted M, Kinney TD, Thomas ED, Rath CE, Haskins D, Finch S, Fluharty RG. Iron metabolism; the pathophysiology of iron storage. Blood, 1950; 5 (11): 983–1008. [PubMed]
- 30).Jacobs A. Editorial Review: low molecular weight intracellular iron transport compounds. Blood, 1977; 50 (3): 433–439. [PubMed]
- 31).Konijn AM, Glickstein H, Vaisman B, Myron-Holze EG, Itzchak N, Slotki IN, Cabantchik ZI. The cellular labile iron pool and intracellular ferritin in K562 cells. Blood, 1999; 94 (6): 2128–2134. [PubMed]
- 32).Matioli GT, Baker RF. Denaturation of ferritin and its relationship with hemosiderin. J Ultrastruct Research, 1963; 8 (5-6): 477–490. [DOI] [PubMed]
- 33).Miyazaki E, Kato J, Kobune M, Okumura K, Nishitani N, Arosio P, Niitsu Y. Denatured H-ferritin subunit is a major constituent of haemosiderin in the liver of patients with iron overload. Gut, 2002; 50 (3): 413–419. [DOI] [PMC free article] [PubMed]


