Abstract
Gain-of-function IDH mutations are initiating events that define major clinical and prognostic classes of gliomas1,2. Mutant IDH protein produces a novel onco-metabolite, 2-hydroxyglutarate (2-HG), that interferes with iron-dependent hydroxylases, including the TET family of 5′-methylcytosine hydroxylases3–7. TET enzymes catalyze a key step in the removal of DNA methylation8,9. IDH mutant gliomas thus manifest a CpG island methylator phenotype (G-CIMP)10,11, though the functional significance of this altered epigenetic state remains unclear. Here we show that IDH mutant gliomas exhibit hyper-methylation at CTCF binding sites, compromising binding of this methylation-sensitive insulator protein. Reduced CTCF binding is associated with loss of insulation between topological domains and aberrant gene activation. We specifically demonstrate that loss of CTCF at a domain boundary permits a constitutive enhancer to aberrantly interact with the receptor tyrosine kinase gene PDGFRA, a prominent glioma oncogene. Treatment of IDH mutant gliomaspheres with demethylating agent partially restores insulator function and down-regulates PDGFRA. Conversely, CRISPR-mediated disruption of the CTCF motif in IDH wildtype gliomaspheres up-regulates PDGFRA and increases proliferation. Our study suggests that IDH mutations promote gliomagenesis by disrupting chromosomal topology and allowing aberrant regulatory interactions that induce oncogene expression.
The human genome is organized into topological domains that represent discrete structural and regulatory units12. Such domains are evident in genome-wide contact maps generated by HiC13, and have been termed ‘topologically-associated domains’ or ‘contact domains’14–16. Recent studies have solidified the role of the CTCF insulator protein in creating chromatin loops and boundaries that partition such domains15. Genomic alterations that remove CTCF-associated boundaries allow aberrant enhancer-gene interactions and alter gene expression17.
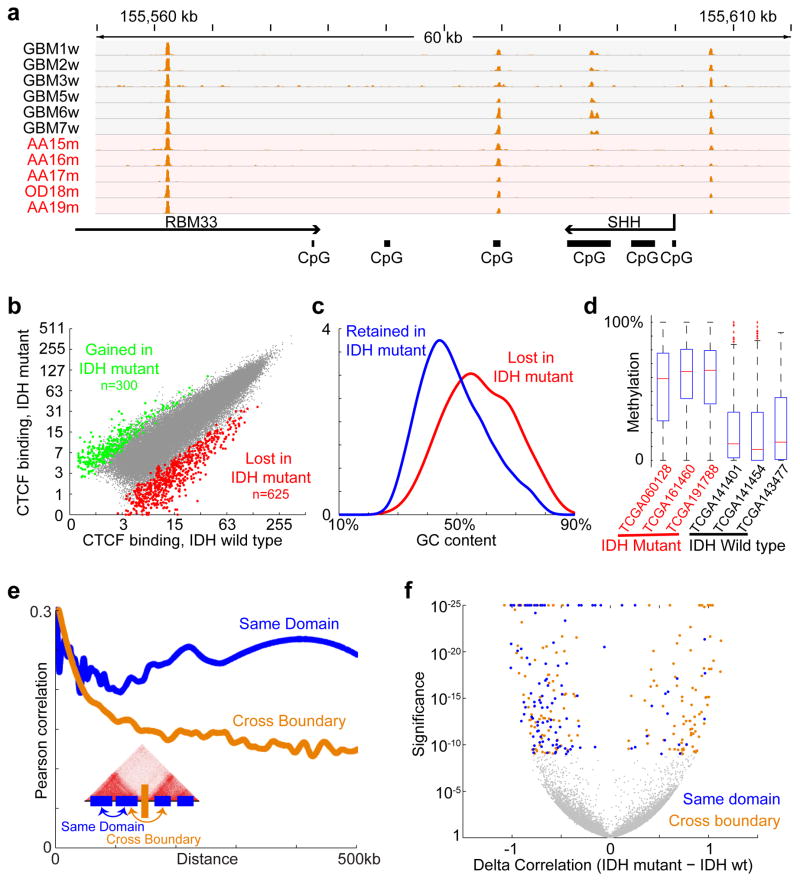
Since CTCF binding is methylation-sensitive18,19, its localization might be altered by DNA hyper-methylation in IDH mutant gliomas. We therefore used ChIP-seq to map CTCF binding genome-wide in eleven primary tumors and four glioma lines. Although CTCF binding patterns tend to be relatively stable, we detected highly overlapping subsets of CTCF sites lost in IDH mutants (Fig. 1a–b; see Methods). Significantly more sites were commonly lost than gained (625 vs 300, p<10−12). We used whole genome bisulfite sequencing data from the Cancer Genome Atlas (TCGA)10 to assess the methylation status of 625 loci with reduced CTCF binding in mutant tumors. We found that these loci have higher GC content, and exhibit significantly higher levels of DNA methylation in IDH mutant gliomas, relative to IDH wildtype (Fig. 1c–d).
Figure 1. CTCF binding and gene insulation compromised in IDH mutant gliomas.
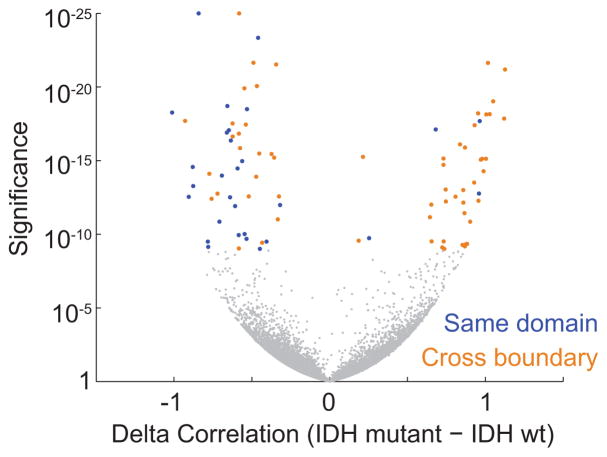
(a) Binding profiles for the methylation-sensitive insulator CTCF are shown for a representative locus in IDH1 mutant and wildtype tumors, normalized by average signal. (b) Scatterplot compares CTCF binding signals between IDH mutant (y-axis) and IDH1 wildtype gliomas (x-axis) for all detected CTCF sites. A larger fraction of sites is commonly lost in all IDH1 mutants (n=625) than gained (n=300). (c) Histogram compares GC content between CTCF sites that are lost or retained. (d) Box plots show DNA methylation levels over lost CTCF sites, as determined from whole genome bisulfite data for three IDH wildtype and three IDH mutant tumors. (e) Plot depicts average correlation between gene pairs as a function of distance across RNA-seq profiles for human brain20. Gene pairs separated by a constitutive CTCF-bound boundary per HiC15 have lower correlations. (f) Volcano plot depicts the significance (y-axis) of gene pairs that are more (or less) correlated in IDH mutant than IDH wildtype lower-grade gliomas. Gene pairs with significantly increased correlations in IDH mutants (right) tend to cross boundaries (orange), while those with decreased correlations (left) more likely reside in the same domain (blue). These data indicate that IDH mutant, G-CIMP gliomas have reduced CTCF binding and altered expression patterns suggestive of defective gene insulation.
We considered that altered DNA methylation and CTCF binding might disrupt topological domain boundaries and gene insulation in IDH mutant tumors. We collated a set of constitutive domain boundaries based on kilobase-resolution HiC maps15. We then examined published RNA-seq expression data for 357 normal brain tissue samples20. Consistent with prior studies16, we found that genes in the same domain correlate across samples, but that genes separated by a boundary show lower correlation (Fig. 1e). We next incorporated expression data for 230 IDH mutant and 56 wildtype lower-grade gliomas, generated by the Cancer Genome Atlas (TCGA)2. Here again we found that the presence of an intervening boundary reduces correlation between neighboring genes. We next scanned the genome for pairs of proximal genes separated by less than 180 kb (the average contact domain size15) that correlate much more strongly in IDH mutants than in wildtype gliomas (Fig. 1f; see Methods). Remarkably, the resulting set is strongly enriched for gene pairs that cross domain boundaries (90% vs 69% expected at random; p<10−4). Conversely, gene pairs that correlate less strongly in IDH mutants are more likely to reside in the same domain (52% vs 31% expected at random; p<10−5). Notably, CTCF knock-down has been shown to increase cross-boundary interactions and decrease intra-domain interactions21. Thus, altered expression patterns in IDH mutant gliomas may reflect reduced CTCF binding and consequent disruption of domain boundaries and topologies.
We next sought to pinpoint specific boundaries disrupted by IDH mutation. For all pairs of genes separated by <1 MB, we computed their correlation across IDH mutant gliomas and across wildtype gliomas. We then scanned for loci in which cross-boundary gene pairs correlate more strongly in mutant tumors (FDR<1%), while intra-domain gene pairs correlate less strongly (FDR<1%). This analysis highlighted 203 domain boundaries (Fig. 2a; Table S1; see Methods). The putatively disrupted boundaries exhibit higher DNA methylation and lower CTCF binding in IDH mutant tumors, relative to wildtype (Extended Data Fig. 1). These data suggest that the methylator phenotype disrupts CTCF binding and domain boundaries, thereby affecting gene expression in IDH mutant gliomas.
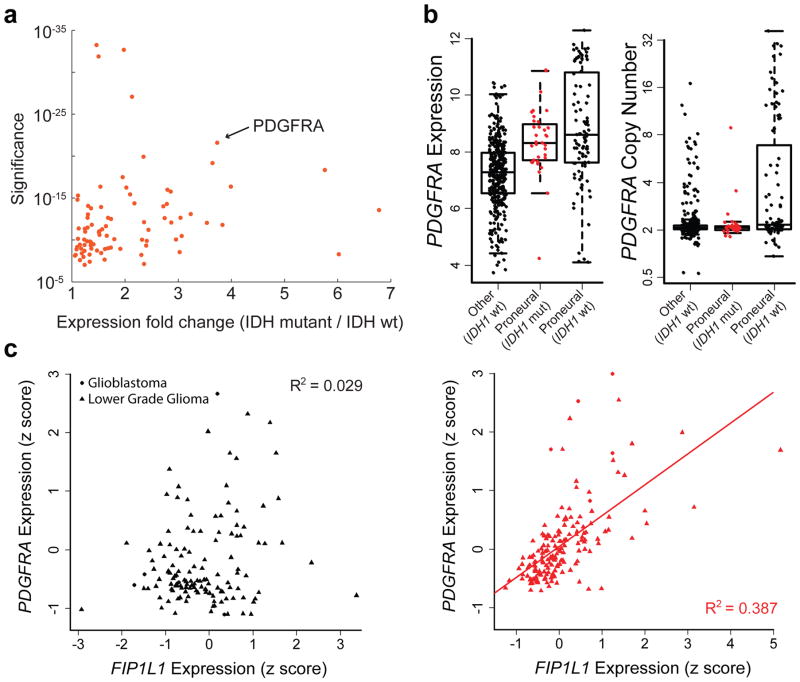
Figure 2. Topological domain boundaries disrupted in IDH1 mutant gliomas.
(a) Scatterplot depicts significance of deregulated boundaries in IDH mutant tumors (y-axis) against fold-change of most up-regulated gene in adjacent domains (x-axis). PDGFRA is adjacent to a significantly deregulated boundary and up-regulated in IDH mutants. (b) Boxplots compare PDGFRA expression (left) or copy number (right) for 443 glioblastoma tumors, classified by IDH status and expression subtype24. IDH mutants (red) have elevated PDGFRA expression, despite normal copy number. (c) Plots compare PDGFRA (y-axis) and FIP1L1 (x-axis) expression in IDH wildtype (left) and mutant (right) gliomas. The genes correlate specifically in IDH mutants, consistent with deregulation of the intervening boundary/insulator.
We hypothesized that altered domain topologies might contribute to gliomagenesis by activating oncogenes that are normally insulated by domain boundaries. We therefore scanned the domains adjacent to the disrupted boundaries for genes with higher expression in IDH mutant than wild-type gliomas (Figure 2a). Genes in top scoring domains include PDGFRA (p<10−21), an established glioma oncogene22, and other candidate regulators of gliomagenesis (Table S1).
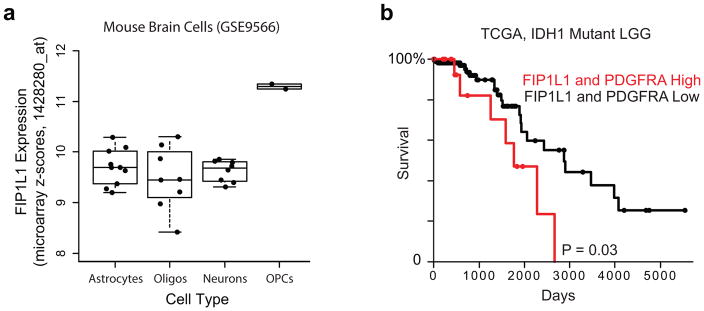
The identification of PDGFRA as a potential target of epigenetic deregulation in IDH mutants was of particular interest, given its prominence as a glioma oncogene and established roles for PDGFA signaling in normal brain. Although PDGFRA is a frequent target of genomic amplification and gain-of-function mutations in glioblastoma (15%), such alterations are rare in IDH mutant tumors23,24. Nonetheless, IDH mutant gliomas strongly express PDGFRA (Fig. 2b), and share the proneural transcriptional program characteristic of PDGFRA-amplified tumors23,24. Closer examination of expression patterns in IDH mutant gliomas reveals a striking correlation between PDGFRA and FIP1L1, despite an intervening boundary (Fig. 2c). FIP1L1 encodes an RNA processing protein that is constitutively expressed in neural tissues, and particularly active in oligodendrocyte precursors, a putative glioma cell-of-origin22 (Extended Data Fig. 2a). Moreover, combined expression of PDGFRA and FIP1L1 is associated with poorer outcome in IDH mutant lower-grade gliomas (Extended Data Fig. 2b). This suggests that an aberrant interaction with this constitutive locus may drive PDGFRA expression in IDH mutant tumors.
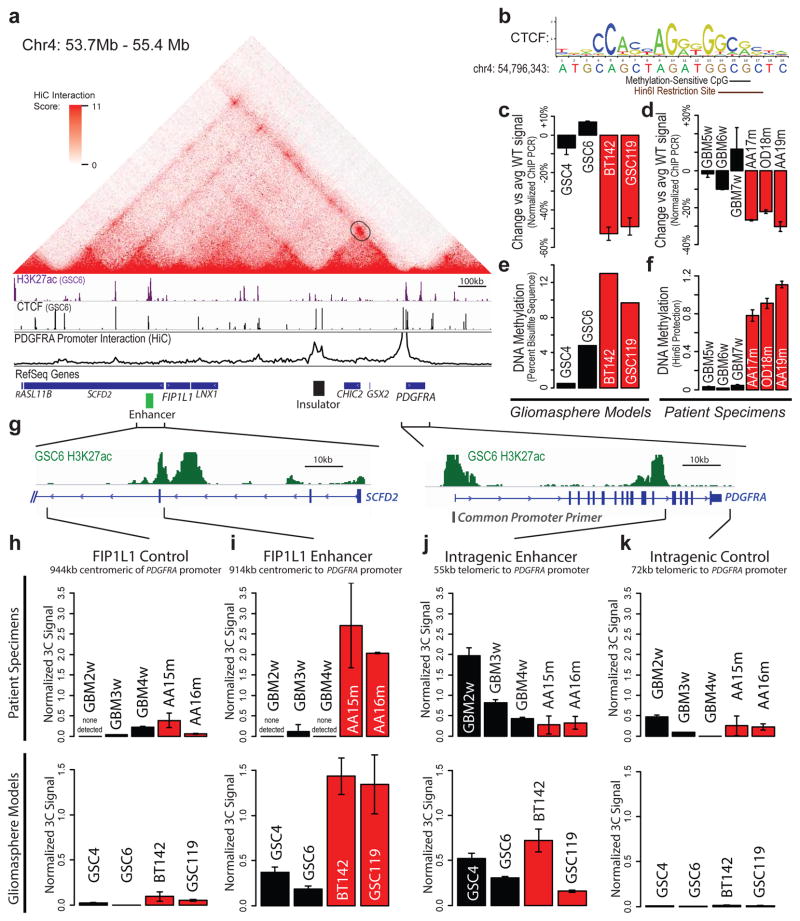
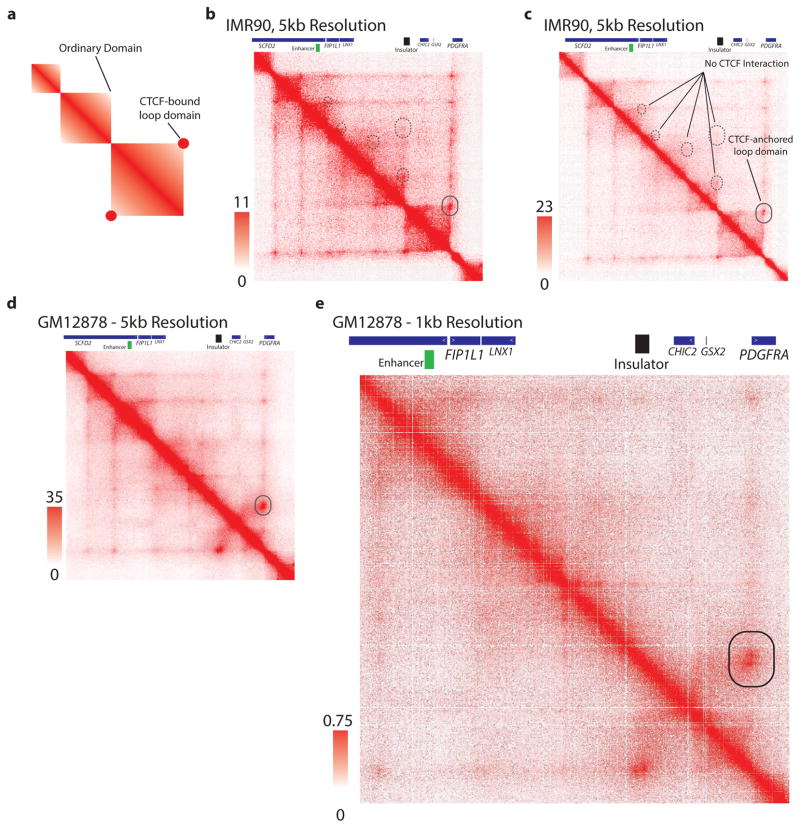
We therefore investigated the topology of the region using kilobase-resolution HiC data15. In all six cell types examined, PDGFRA and FIP1L1 reside in distinct domains, separated by one CTCF-anchored constitutive boundary (Fig. 3a, Extended Data Fig. 3). Our ChIP-seq data confirm that this boundary contains a strong CTCF binding site over a canonical CTCF motif with a CpG dinucleotide in a position previously linked to methylation-sensitivity25 (Fig. 3b). Quantitative ChIP-PCR reveals that CTCF occupancy at this site is reduced between 30% and 50% in IDH mutant tumors and gliomasphere models, relative to wildtype (Fig. 3c,d). Moreover, the CpG in this motif becomes highly methylated in IDH mutants (Fig. 3e,f). This suggests that reduced CTCF binding may compromise the boundary flanking PDGFRA in IDH mutant, hyper-methylated tumors.
Figure 3. Insulator loss allows PDGFRA to interact with a constitutive enhancer.
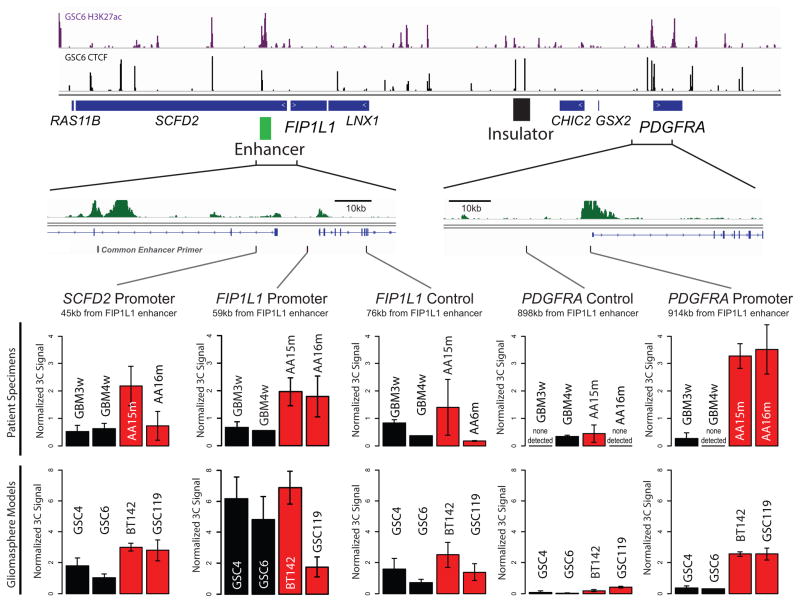
(a) Contact domain structure shown for a 1.7 MB region containing PDGFRA. Heat depicts HiC interaction scores between triangulated loci in IMR90 cells15. Domains are visible as triangle-shaped regions of high interaction scores. Convergent CTCF sites anchor a loop that separates PDGFRA and FIP1L (black circle). H3K27ac and CTCF profiles are aligned to the contact map. Interaction trace (below) depicts HiC signals between the PDGFRA promoter and all other positions in the region. Genes, FIP1L1 enhancer (per H3K27ac) and insulator (per HiC and CTCF binding) are indicated. (b) The right CTCF peak in the insulator contains a CTCF motif with a CpG at a methylation-sensitive position. (c,d) ChIP-qPCR data show that CTCF occupancy over the boundary is reduced in IDH mutant (red) gliomas and models, relative to wildtype (black). (e) Methylation levels of the CpG in the CTCF motif were measured in gliomaspheres by bisulfite sequencing, and plotted as percent of alleles protected from conversion. (f) Methylation levels of the CpG in the CTCF motif were measured in glioma specimens by methylation-sensitive restriction, and plotted as relative protection. (g) Expanded views of FIP1L1 enhancer locus and PDGFRA locus shown with H3K27ac tracks. Vertical black bars indicate the locations of the common PDGFRA promoter primer and four complementary primers tested in 3C. (h–k) Plots show normalized 3C interaction frequencies between PDGFRA promoter and indicated regions. A strong interaction between PDGFRA promoter and FIP1L1 enhancer is evident in IDH mutant tumors and models. (Error bars in all panels reflect standard deviations of triplicate observations).
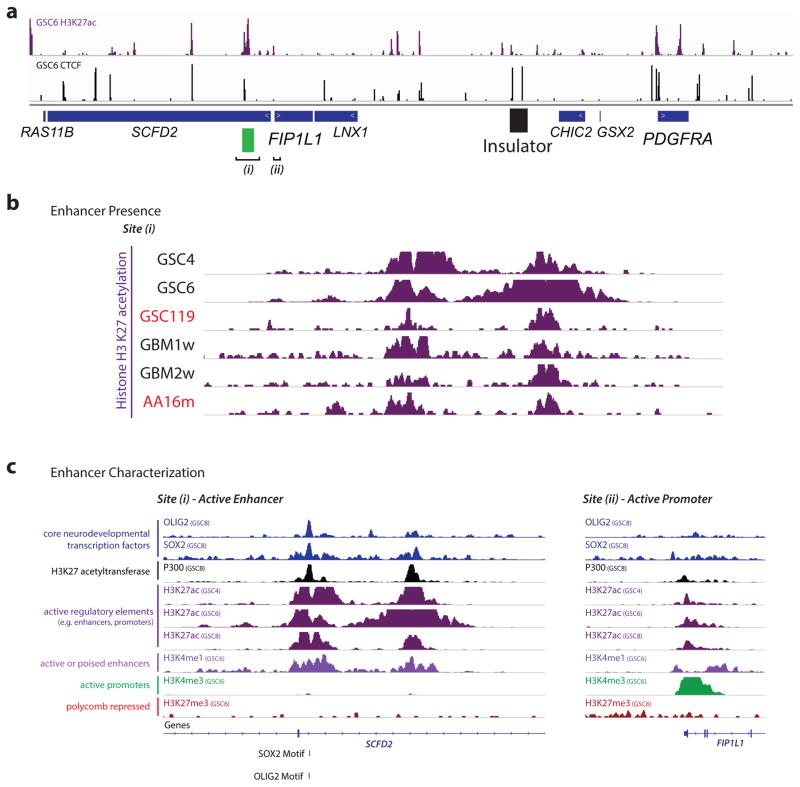
To identify regulatory elements that might underlie PDGFRA induction, we mapped the enhancer-associated histone modification, H3 lysine 27 acetylation (H3K27ac), in glioma specimens and models. We identified a large enhancer ~50 kb upstream of FIP1L1 with strong acetylation in wildtype and mutant tumors (Fig. 3a; Extended Data Fig. 4). In support of an enhancer identity, the element is enriched for H3 lysine 4 mono-methylation (H3K4me1), but lacks H3K4me3, and contains conserved motifs bound by the glioma master transcription factors, OLIG2 and SOX2. Although this enhancer is normally insulated from PDGFRA, we reasoned that disruption of the intervening boundary might allow it to interact with the oncogene in IDH mutant gliomas. To test this, we used chromosome conformation capture (3C) to query the relative frequencies with which the PDGFRA promoter interacts with the FIP1L1 enhancer, with an intragenic PDGFRA enhancer, or with nearby control sites (Fig. 3g). We fixed IDH mutant and wildtype glioma specimens and gliomaspheres, digested their chromatin with HinDIII, and performed proximity ligation to re-ligate physically interacting DNA sequences. We used qPCR to measure ligation frequencies between elements, normalizing against control ligations performed with bacterial artificial chromosome DNA.
In wildtype gliomas, 3C revealed a strong interaction between the PDGFRA promoter and its intragenic enhancer, which are ~50 kb apart (Fig. 3j,k). In contrast, the PDGFRA promoter does not interact with the FIP1L1 enhancer in wildtype tumors, consistent with retention of the intervening boundary (Fig 3h,i). However, the interaction patterns were markedly different in IDH mutant tumors. Here, 3C revealed a strong interaction between the PDGFRA promoter and the FIP1L1 enhancer, despite a separation of ~900 kb (Fig. 3i). For comparison, this interaction is ~5-fold stronger than that between PDGFRA promoter and its intragenic enhancer. To confirm this interaction, we designed and normalized reciprocal probe and primers to compare the relative strength with which the FIP1L1 enhancer interacts with nearby promoters and PDGFRA (Extended Data Fig. 5). Remarkably, we found that the FIP1L1 enhancer-PDGFRA promoter interaction is stronger than the FIP1L1 enhancer-FIP1L1 promoter interaction in IDH mutant tumors. This suggests that disruption of a boundary element by IDH mutation and hyper-methylation allows a potent constitutive enhancer to aberrantly interact with, and up-regulate PDGFRA.
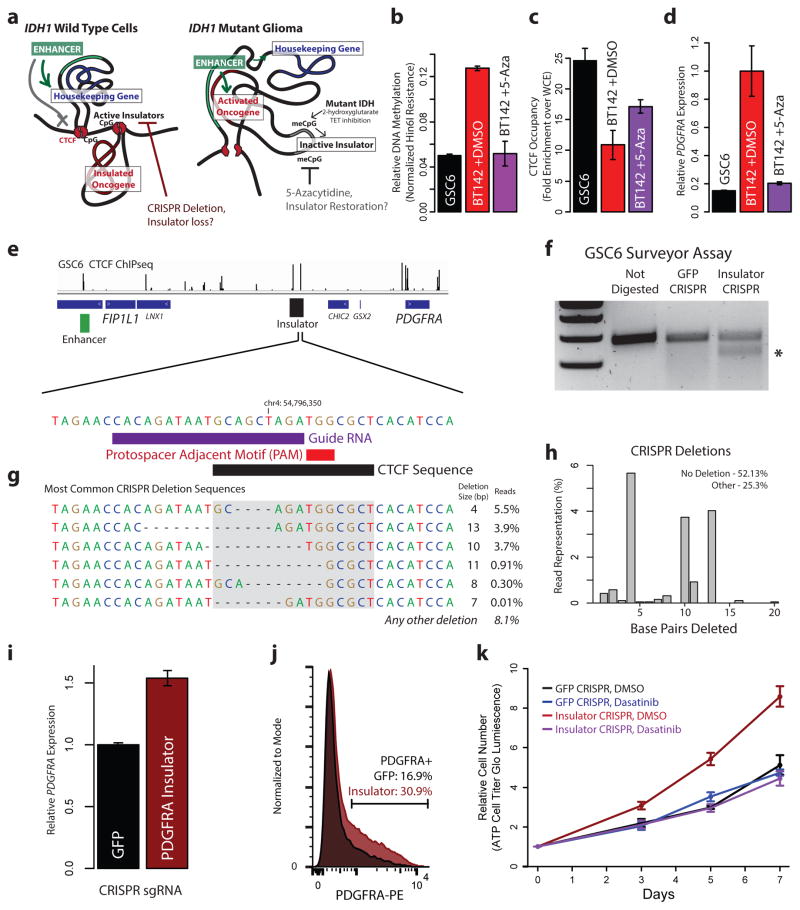
To test this model functionally, we considered whether perturbing the boundary alters PDGFRA expression in patient-derived gliomaspheres (Fig. 4a). First, we focused on the IDH1 mutant oligoastrocytoma model, BT142. In this mutant line, the CpG dinucleotide in the CTCF motif exhibits higher methylation than wildtype models (~13% vs ~2% per bisulfite sequencing), and CTCF binding is ~3-fold lower. Consistently, 3C reveals a strong interaction between FIP1L1 enhancer and PDGFRA promoter that is specific to the mutant line (Fig. 3i), and PDGFRA is highly expressed.
Figure 4. Boundary methylation and CTCF occupancy affect PDGFRA expression and proliferation.
(a) Schematic depicts chromatin loops and boundaries in the PDGFRA locus. In IDH wildtype cells (left), intact boundary insulates oncogene. Disruption of boundary by removing CTCF motif should activate the oncogene. In IDH mutant (right), hyper-methylation blocks CTCF, compromising boundary and allowing enhancer to activate oncogene. Demethylation should restore CTCF-mediated insulation. (b) Plot compares methylation of the CpG in the CTCF motif in IDH wildtype gliomaspheres (black), IDH mutant gliomaspheres (red) and IDH mutant gliomaspheres treated with 5μM 5-aza for 8 days (purple). (c) Plot compares CTCF occupancy over the boundary. (d) Plot compares PDGFRA expression. Demethylation restores PDGFRA insulation in IDH mutant gliomaspheres. (e) CTCF binding shown for the FIP1L1/PDGFRA region. Expanded view shows CTCF motif in the insulator targeted for CRISPR-based deletion. gRNA and protospacer adjacent motif (PAM) direct Cas9 nuclease to the motif. (f) Surveyor assay detects target site alterations in GSC6 gliomaspheres infected with Cas9 and sgRNA (but not in control cells infected with GFP-targeting sgRNA). (g) Sequencing of target site reveals the indicated deletions. CTCF motif disrupted on ~25% of alleles (compare to <0.01% in control). (h) Plot depicts fraction of reads in insulator CRISPR cells with a deletion of indicated size. (i) qPCR reveals increased PDGFRA expression in insulator CRISPR cells. (j) Flow cytometry reveals ~2-fold greater PDGFRa in insulator CRISPR cells. (k) Plot depicts gliomasphere growth. Insulator CRISPR cells exhibit ~2-fold increased proliferation, relative to control. This proliferation advantage is eliminated by PDGFRa inhibition. These results indicate that genetic or epigenetic disruption of the boundary compromises insulation of this oncogene. (Error bars in all panels reflect standard deviations of triplicate observations).
We reasoned that demethylating agent should reduce methylation at this CpG dinucleotide, allowing CTCF to bind and restore PDGFRA insulation. We therefore treated BT142 gliomaspheres with the DNA methyltransferase inhibitor 5-azacytidine (5-aza). 5-aza treatment reduced methylation of the CTCF motif by ~2.5-fold, increased CTCF occupancy by ~1.7-fold and down-regulated PDGFRA expression by ~5-fold (Fig. 4b–d). These results directly implicate DNA hyper-methylation in compromising CTCF binding, boundary function and oncogene insulation in IDH mutant tumors.
Finally, we investigated whether genetic disruption of the CTCF motif could induce PDGFRA expression in wildtype gliomaspheres with an intact boundary (Fig. 4a). Here we focused on GSC6, a patient-derived glioblastoma model that harbors an EGFR amplification, but is wildtype for IDH and PDGFRA. We sought to disrupt the CTCF site in the boundary by CRISPR-based genome engineering (Fig. 4e)26,27. We designed a short guide RNA (sgRNA) with a protospacer adjacent motif (PAM) within the CTCF motif. We used a single-vector lentiviral delivery system to infect GSC6 with a Cas9 expression construct containing this insulator sgRNA or a control sgRNA (targeting GFP). Surveyor assay confirmed target locus disruption in the insulator CRISPR condition (Fig. 4f). Direct sequencing of the target locus revealed that ~25% of alleles in the insulator CRISPR gliomaspheres contain a deletion within the CTCF motif expected to disrupt binding, compared to <0.1% in the GFP control (Fig. 4g,h).
We quantified PDGFRA expression in the genetically modified gliomaspheres. RT-PCR revealed a ~1.6-fold increase in PDGFRA mRNA in the insulator CRISPR cells, relative to control (Fig. 4i). Similarly, flow cytometry revealed a ~1.8-fold increase in the fraction of cells with PDGFRa surface expression (Fig. 4j). We conservatively estimate that CTCF motif disruption causes a ~3-fold increase in PDGFRA expression, given that DNA level analysis indicates that <50% of insulator CRISPR cells were successfully edited.
Finally, we considered whether CRISPR-mediated boundary disruption and PDGFRA induction affects gliomasphere fitness. In support, the insulator CRISPR gliomaspheres have a ~2-fold growth advantage over the control GFP CRISPR gliomaspheres (Fig. 4k). This growth advantage is dependent on PDGFRa signaling, as it is abrogated by treatment with PDGFR inhibitors, dasatinib or crenolanib (Fig. 4k, Extended Data Fig. 6). Notably, PDGFRA expression in insulator CRISPR gliomaspheres increased further after extended culture (to 2-fold over control), potentially due to selection of effectively edited clones. The observation that genetic disruption of this CTCF boundary element induces PDGFRA expression and enhances proliferation provides strong support for our model that epigenetic disruption of this element offers similar growth advantage to IDH mutant gliomas.
In conclusion, we present a novel epigenetic mechanism by which gain-of-function IDH mutations induce PDGFRA expression and thereby promote fitness in a subset of gliomas. We specifically find that, in addition to familiar effects on CpG islands, IDH mutations cause hyper-methylation of CTCF binding sites genome-wide. This is associated with reduced CTCF binding and a global deregulation of boundary elements that partition topological domains. Disruption of a specific boundary bordering PDGFRA allows a potent enhancer to aberrantly contact and activate this canonical glioma oncogene.
Although disruption of this single boundary confers a growth advantage, it is unlikely to be the only mediator of IDH mutations in gliomas. The widespread disruption of CTCF binding and boundary element function could provide many opportunities for oncogene deregulation, and subsequent selection of proliferative progeny that inherit the altered epigenetic state. Insulator dysfunction may also be accompanied by promoter silencing events28,29, and by alterations to other pathways affected by 2-HG7,30. Conversely, disruption of chromosomal topology and oncogene insulation may be more generally relevant to methylator phenotypes observed in colorectal and renal cell carcinomas, leukemia and other malignancies28.
Methods and Materials
Primary glioma specimens and gliomasphere models
Clinical samples GBM1w, GBM2w, GBM3w, GBM4w, GBM5w, GBM6w, GBM7w, AA15m, AA16m, AA17m, OD18m, and AA19m were obtained as frozen specimens from the Massachusetts General Hospital Pathology Tissue Bank or received directly after surgical resection and flash frozen (Extended Data Table 1). All samples were acquired with Institutional Review Board approval, and were deidentified prior to receipt. GBM1w was obtained at autopsy; the remaining samples were surgical resections. IDH1 status was determined for all clinical samples by SNaPshot multiplex PCR31. PDGFRA status was confirmed by FISH analysis. Tissue (200–500 μg) was mechanically minced with a sterile razor blade prior to further processing.
Gliomaspheres were maintained in culture as described32,33. Briefly, neurosphere cultures contain Neurobasal media supplemented with 20 ng/mL recombinant EGF (R and D Systems), 20ng/mL FGF2 (R and D Systems), 1X B27 supplement (Invitrogen), 0.5X N2 supplement (Invitrogen), 3mM L-glutamine, and penicillin/streptomycin. Cultures were confirmed to be mycoplasma-free via PCR methods. GSC4 and GSC6 gliomasphere lines were derived from IDH1 wildtype tumors resected at Massachusetts General Hospital, and have been previously described and characterized32–34. BT142 gliomasphere line (IDH1 mutant)35 was obtained from ATCC, and cultured as described above except 25% conditioned media was carried over each passage. BT142 G-CIMP status was confirmed by evaluating LINE methylation with the “Global DNA Methylation Assay – LINE-1″ kit (Active Motif), as described36, and by methylation-sensitive restriction digests. GSC119 was derived from an IDH1 mutant tumor (confirmed by SNaPsShot) resected at Massachusetts General Hospital. We confirmed IDH1 mutant status of GSC119 by RNA-seq (82 out of 148 reads overlapping the relevant position in the transcript correspond the mutant allele). The gliomasphere models were derived from tumors of the following type: GSC4, GSC6 – primary glioblastoma, BT142 – grade III oligoastrocytoma, GSC119 – secondary glioblastoma, G-CIMP. Clinical specimens and models used in this study are detailed in Extended Data Table 1.
Chromatin Immunoprecipitation
Chromatin Immunoprecipitation (ChIP) and sequencing (ChIP-Seq) was performed as described previously32. Briefly, cultured cells or minced tissue was fixed in 1% formaldehyde and snap frozen in liquid nitrogen and stored at −80°C for at least overnight. Sonication of tumor specimens and gliomaspheres was calibrated such that DNA was sheared to between 400bp and 2000bp. CTCF was immunoprecipitated with a monoclonal rabbit CTCF antibody, clone D31H2 (Cell Signaling 3418). H3K27ac was immunoprecipitated with an antibody from Active Motif (cat 39133). ChIP DNA was used to generate sequencing libraries by end repair (End-It DNA repair kit, Epicentre), 3′ A base overhang addition via Klenow fragment (NEB), and ligation of barcoded sequencing adapters. Barcoded fragments were amplified via PCR. Libraries were sequenced as 38 base paired-end reads on an Illumina NextSeq500 instrument or as 50 base single-end reads on a MiSeq instrument. Sequencing libraries are detailed in Extended Data Table 2. H3K27ac maps for GSC6 were previously published deposited to GEO as GSM1306340. Genomic data has been deposited into GEO as GSE70991.
For sequence analysis, identical reads were collapsed to a single paired-end read in order to avoid PCR duplicates. In order to avoid possible saturation, reads were downsampled to 5% reads collapsed as PCR duplicates, or 5 million fragments. Reads were aligned to hg19 using BWA, and peaks were called using HOMER. ChIP-seq tracks were visualized using Integrative Genomics Viewer (IGV, http://www.broadinstitute.org/igv/). To detect peaks lost in IDH mutants, we called signal over all peaks in a 100bp window centered on the peaks. To control for copy number changes, we first called copy number profiles from input sequencing data using CNVnator37. We then removed all regions where at least one sample had a strong deletion (<0.25), and normalized by copy number. To account for batch effects and difference in ChIP efficiency, we quantile normalized each dataset. Peaks were scored as lost or gained if the difference in signal between a given tumor and the average of the five wildtype tumors was at least 2-fold lower or higher, with a signal of at least 1 in all wildtype or all IDH mutant tumors. Fisher exact test confirmed that the overlap between peaks lost in the IDH mutant tumors is highly significant (p<10−100).
GC content over CTCF peaks lost (or retained) in the IDH1 mutant glioma specimens was averaged over 200bp windows centered on each peak lost in IDH mutant tumors. Methylation levels were quantified over these same regions for 3 IDH mutant and 3 IDH wildtype tumors, using TCGA data generated by whole genome bisulfite sequencing10. Briefly, methylation levels (%) based on proportion of reads with protected CpG were averaged over all CpG dinucleotides in these regions, treating each tumor separately.
Occupancy of the CTCF site in the boundary element adjacent to the PDGFRA locus was quantified by ChIP qPCR, using the following primers: PDGFRActcfF: 5′-GTC ACA GTA GAA CCA CAG AT -3′, PDGFRActcfR: 5′-TAA GTA TAC TGG TCC TCC TC -3′. Equal masses of ChIP or input (WCE) DNA were used as input for PCR, and CTCF occupancy was quantified as a ratio between ChIP and WCE, determined by 2^-deltaCT. CTCF peak intensity was further normalized as ratio to two invariant peaks, at PSMB1 and SPG11, using the following primers: PSMB1ctcfF – 5′-CCT TCC TAG TCA CTC AGT AA -3′, PSMB1ctcfR – 5′-CAG TGT TGA CTC ATC CAG -3′, SPG11ctcfF – 5′-CAG TAC CAG CCT CTC TAG -3′, SPG11ctcfR – 5′-CTA AGC TAG GCC TTC AAG -3′.
Cross-Boundary and Intra-Domain Gene Pair Correlation Analysis
RNA-seq data for 357 normal brain samples was downloaded from GTEx20. RNA-seq data and copy number profiles for lower grade gliomas were downloaded from TCGA23,24. Contact domains of IMR90, GM12878, K562 and NHEK cells were obtained from published HiC data15. Genes were assigned to the inner most domain their transcription start site fell within. Gene pairs were considered to be in the same domain if they were assigned to the same domain in both GM12878 and IMR90. Gene pairs were considered to span a boundary if they were assigned to different domains in both GM12878 and IMR90, and separated by a CTCF binding site in IDH wild type tumors. Gene pairs that did not fit either criterion were excluded from this analysis. The plot of correlation vs distance for brain GTEx samples is based on Pearson correlations for all relevant pairs, smoothed by locally weighted scatterplot smoothing with weighted linear least squares (LOESS). To assess the bias in correlation differences, we computed the difference of Pearson correlations between wild-type and IDH mutant gliomas for all gene pairs separated by <180 kb. In Figure 1e, this difference in correlations is plotted against the significance of this difference (estimated by Fisher z-transformation). For each gene pair, we omitted samples with a deletion or amplification of one of the genes at or above threshold of the minimal arm level deletion or amplification (to avoid copy number bias). To ensure robustness, we also repeated the analysis using boundaries defined from HiC data for K562 and NHEK. This yielded similar results: 84% pairs gaining correlation cross boundary vs. 71% expected (p<8*10−3), 54% pairs losing correlation are within the same domain vs. 29% expected (p<3*10−8). Repeating the analysis with only the 14,055 genes that have expressed over 1 TPM in at least half the samples also yielded similar results (Extended Data Fig. 7): 92% pairs gaining correlation cross boundary vs. 69% expected (p<2*10−3), 73% pairs losing correlation are within the same domain vs. 31% expected (p<8*10−4).
Genomic Scan for Deregulated Boundaries
To detect boundaries deregulated in IDH mutant gliomas, we scanned for gene pairs, separated by <1MB, with a significant difference in correlation between wild-type and IDH mutant tumors (Fisher z-transformation, FDR<1%). We omitted amplified or deleted samples as described above. To ensure robustness to noise from lowly expressed genes, we first filtered out 6,476 genes expressed < 1 TPM in more than half of the samples (keeping 14,055 genes). We considered all domains and boundaries scored in IMR90 HiC data13. Gene pairs crossing a CTCF peak and an IMR90 boundary (i.e. can be assigned to different domains) that were significantly more correlated in IDH mutant tumors were considered to support the loss of that boundary. Gene pairs not crossing a boundary (i.e. can be assigned to the same domain) that were significantly less correlated in IDH mutant tumors were considered to support the loss of a flanking boundary. We collated a set of deregulated boundaries, supported by at least one cross-boundary pair gaining correlation and at least one intra-domain pair losing correlation. Each was assigned a p-value equal to the product of both supporting pairs (best p-value was chosen if there were more supporting pairs). If both boundaries of a domain were deregulated, or if the same pair of gene pairs (one losing and one gaining correlations) were supporting more than one boundary due to overlapping domains the entries were merged (Supplemental Table 1). This definition allows every gene pair to be considered as potential support for a boundary loss. To quantify CTCF occupancy over these deregulated boundaries, we averaged the signal over all CTCF peaks located within a 1 kb window around the boundary, using copy number and quantile normalized CTCF signals. To quantify DNA methylation over the deregulated boundaries, we averaged DNA methylation signals from TCGA data in 200bp windows as above. Figure 2a depicts significance of disrupted domains and the fold-change of genes in them that are upregulated in IDH mutant tumors (compared to median expression in wild-type). In addition to PDGFRA, top ranking genes include CHD4 (p<10−32), a driver of glioblastoma tumor initiation38, L1CAM (p<10−8), a regulator of the glioma stem cells and tumor growth39, and other candidate regulators (Supplemental Table 1).
To ensure robustness to cell type-specific boundaries, we repeated the analysis with GM12878, K562 and NHEK defined boundaries. This yielded very similar results, and again highlighted PDGFRA as an over-expressed gene adjacent to a disrupted boundary.
TCGA Correlation and Outcome Analysis
For the correlation of FIP1L1 and PDGFRA expression, RNAseq data from the TCGA Lower Grade Glioma (LGG) and Glioblastoma (GBM) datasets2,24 were downloaded and segregated by IDH1 mutation status and subtype. Patients from the proneural subtype were divided by IDH mutation status, while patients from the mesenchymal, classical, or neural subtypes (which had no IDH mutations) were classified as “Other.” For correlation analysis, patients with copy number variation in either gene were excluded from the analysis to control for effects of co-amplification. For outcome analysis, LGG RNAseq data and corresponding patient survival data was obtained from TCGA. Patients with sum PDGFRA and FIP1L1 expression of at least one half of one standard deviation above the mean were classified as “high PDGFRA and FIP1L1 expression” (n=17) while all other patients were classified as “low PDGFRA and FIP1L1 expression” (n=201). Data were plotted as Kaplan-Meier curves and statistically analyzed via logrank test.
HiC Data Analysis and Visualization
HiC data15 was downloaded from GEO. 5 kb resolution intra-chromosomal contact scores for Chromosome 4 for the cell lines IMR90, NHEK, KBM7, K562, HUVEC, HMEC, and GM12878 were filtered to the region between 53,700kb and 55,400kb. The average interaction score at each coordinate pair for all cell lines was calculated and used to determine putative insulator elements as local maxima at the interaction point of two domain boundaries. In order to determine the interactions of the PDGFRA promoter, the interaction scores of all points in the region with the PDGFRA promoter (chr4:55,090,000) were plotted as a one-dimensional trace. In order to view the topological domain structure of the region, HiC interaction scores were visualized using Juicebox (http://www.aidenlab.org/juicebox/)15. Data shown is from the IMR90 cell line at 5kb resolution, normalized to coverage.
DNA Methylation Quantification
DNA methylation was analyzed in two ways. For gliomaspheres, genomic DNA was isolated via QiaAmp DNA minikit (Qiagen) and subjected to Bisulfite Conversion (EZ DNA Methylation Gold Kit – Zymo Research). Bisulfite converted DNA specific to the CTCF binding site (defined by JASPAR40) in the boundary adjacent to PDGFRA was amplified using the following primers F: 5′-GAA TTA TAG ATA ATG TAG TTA GAT GG -3′, R: 5′-AAA TAT ACT AAT CCT CCT CTC CCA AA -3′. Amplified DNA was used to prepare a sequencing library, which was sequenced as 38 base paired-end reads on a NextSeq500. For tumors, limiting DNA yields required an alternate strategy for methylation analysis. Tumor genomic DNA was isolated from minced frozen sections of tumors by QiaAmp DNA minikit (Qiagen). Genomic DNA was digested using the methylation-sensitive restriction enzyme Hin6I (Thermo) recognizing the restriction site GCGC, or subjected to mock digestion. Protected DNA was quantified by PCR using the following primer set: PDGFRAinsF: 5′-CGT GAG CTG AAT TGT GCC TG -3′, PDGFRAinsR: 5′-TGG GAG GAC AGT TTA GGG CT -3′, normalizing to mock digestion.
Chromatin Conformation Capture (3C)
3C analysis was performed using procedures as described previously41,42. Briefly, ~10 million cell equivalents from minced tumor specimens or gliomasphere cultures were fixed in 1% formaldehyde. Fixed samples were lysed in lysis buffer containing 0.2% PMSF using a Dounce Pestle. Following lysis, samples were digested with HinDIII (NEB) overnight on a thermomixer at 37°C rotating at 950 RPM. Diluted samples were ligated using T4 DNA ligase (NEB) at 16°C overnight, followed by RNase and Proteinase K treatment. DNA was extracted via phenol/chloroform/isoamyl alcohol (Invitrogen). DNA was analyzed via TaqMan PCR using ABI master mix. Primers and probe were synthesized by IDT with the following sequences: Common PDGFRA Promoter: 5′-GGT CGT GCC TTT GTT TT -3′, FIP1L1 Control: 5′-CAG GGA AGA GAG GAA GTT T -3′, FIP1L1 Enhancer: 5′-TTA AGT AAG CAG GTA AAC TAC AT -3′, Intragenic Enhancer: 5′-AGC CTT TGC CTC CTT TT -3′, Intragenic Control: 5′-CCA CAG GGA GAA GGA AAT -3′, Intact Promoter: 5′-CAA GGA ATT CGT AGG GTT C -3′, Probe: 5′-/56-FAM/TTG TAT GCG/ZEN/AGA TAG AAG CCA GGG CAA/3IABkFQ/-3′. For the reciprocal FIP1L1 enhancer interaction interrogation, the following primer sequences were used: Common Enhancer Primer – as FIP1L1 Enhancer Primer above (5′-TTA AGT AAG CAG GTA AAC TAC AT -3′), PDGFRA Promoter – as Common PDGFRA Promoter above (5′-GGT CGT GCC TTT GTT TT -3′), SCFD2 Promoter - 5′-AAT ACA TGG TCA TGA TGC TC -3′, FIP1L1 Promoter - 5′-AGG CAT TGC TTA AAC ATA AC -3′, FIP1L1 control - 5′-TTA TTT GTA GTA GAG GTT ACT GG -3′, PDGFRA control - 5′-ATG ATA ACA CCA CCA TTC AG -3′, FIP1L1 enhancer Probe - 5′-/56-FAM/TAT CCC AAC/ZEN/CAA ATA CAG GGC TTG G/3IABkFQ/-3′. In order to normalize primer signals, Bacterial Artificial Chromosome (BAC) clones CTD-2022B5 and RP11-626H4 were obtained from Invitrogen. BAC DNA was purified via BACMAX DNA Purification kit (Epicenter) and quantified using two primer sets specific to the Chloramphenicol resistance gene: 1F: 5′-TTC GTC TCA GCC AAT CCC TG -3′, 1R: 5′-TTT GCC CAT GGT GAA AAC GG -3′, 2F: GGT TCA TCA TGC CGT TTG TG -3′, 2R: 5′-CCA CTC ATC GCA GTA CTG TTG -3′. BAC DNA was subjected to a similar 3C protocol, omitting steps related to cell lysis, proteinase or RNase treatment. PCR signal from tumor and gliomasphere 3C was normalized to digestion efficiency and BAC primer signal.
Treatment with demethylating agent
BT142 cells were cultured in either 5μM 5-azacytidine or equivalent DMSO (1:10,000) for 8 days, with drug refreshed every 2 days.
CRISPR/Cas9 Insulator Disruption
The following CRISPR small guide RNAs were cloned into the LentiCRISPR vector obtained from the Zhang lab43: GFP: 5′-GAG CTG GAC GGC GAC GTA AA -3′, Insulator: 5′-GCC ACA GAT AAT GCA GCT AGA -3′. GSC6 gliomaspheres were mechanically dissociated and plated in 5 μg/mL EHS Laminin (Sigma) and allowed to adhere overnight and then infected with lentivirus containing either CRISPR vector for 48h. Cells were then selected in 1μg/mL puromycin for four days, with puromycin-containing media refreshed every two days. Genomic DNA was isolated and the region of interest was amplified using the PDGFRAins primer set described above. CRISPR-mediated disruption of this amplified DNA was confirmed via Surveyor Assay (Transgenomic), with amplified uninfected GSC6 genomic DNA being added to each annealing reaction as the unmodified control. In order to quantify the precise CRISPR alterations, genomic DNA from each construct was amplified using a set of primers closer to the putative deletion site as follows: F: 5′-TTT GCA ATG GGA CAC GGA GA -3′, R: 5′-AGA AAT GTG TGG ATG TGA GCG -3′. PCR product from these primers was used to prepare a library that was sequenced as 38 base paired-end reads on the Illumina NextSeq500.
PDGFRA Quantitative PCR
Total RNA was isolated from CRISPR-infected GSC6 gliomaspheres (Insulator or control GFP sgRNA) or BT142 gliomaspheres (5-aza treated or control condition) using the RNeasy minikit (Qiagen) and used to synthesize cDNA with the SuperScriptIII system (Invitrogen). cDNA was analyzed using SYBR mastermix (Applied Biosystems) on a 7500 Fast Real Time System (Applied Biosystems). PDGFRA expression was determined using the following primers: F: 5′-GCT CAG CCC TGT GAG AAG AC -3′, R: 5′-ATT GCG GAA TAA CAT CGG AG -3′, and was normalized to primers for Ribosomal Protein, large, P0 (RPLP0), as follows: F: 5′-TCC CAC TTG CTG AAA AGG TCA -3′, R: 5′-CCG ACT CTT CCT TGG CTT CA -3′. Normalization was also verified by β-actin, F: 5′-AGA AAA TCT GGC ACC ACA CC -3′, R: 5′-AGA GGC GTA CAG GGA TAG CA -3′.
PDGFRA Flow Cytometry
Cells were incubated with PE-conjugated anti-PDGFRA (CD140a) antibody (Biolegend, clone 16A1) for 30 minutes at room temperature at the dilution specified in the manufacturer’s protocol. Data was analyzed and visualized with FlowJo software. Single live cells were selected for analysis via side and forward scatter, and viable cells were selected by lack of an unstained channel (APC) autofluorescence.
Cell Growth Assay
For the cell growth assay, 2,500 dissociated viable GSC6 cells expressing CRISPR and either GFP or Insulator targeting sgRNA (see above) were plated in 100μL of media in an opaque-walled tissue culture 96 well plate, in 1μM Dasatinib, 500nM Crenolanib, or equivalent DMSO (1:10,000) as a vehicle control. Cell growth was analyzed at days 3, 5, and 7 for Dasatinib, or days 3, 7, and 10 for Crenolanib, using CellTiter-Glo reagent (Promega) following the manufacturer’s protocol. Data was normalized across days using an ATP standard curve.
Extended Data
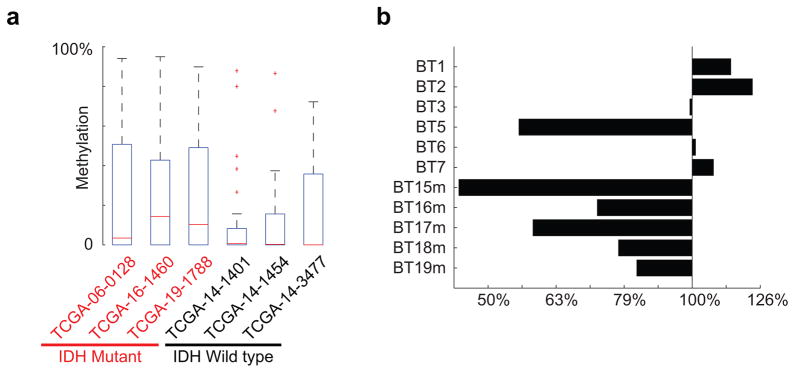
Extended Data Figure 1. DNA methylation and CTCF binding at deregulated boundaries.
(a) Box plots show DNA methylation levels over CTCF sites (200 bp window centered on the peak) within boundaries predicted by gene pair correlation analysis to be disrupted. All CTCF sites located within a 1 kb window centered on a disrupted boundary were considered. Methylation levels were determined from whole genome bisulfite data for three IDH mutant (red labels) and three IDH wildtype (black labels) tumors. (b) Bars show average normalized ChIP-seq signal over all CTCF sites located inside a 1 kb window centered on a disrupted boundary.
Extended Data Figure 2. Expression of FIP1L1 in mouse brain cells and survival effects of PDGFRA and FIP1L1.
(a) Expression of FIP1L1 in isolated mouse brain cell types44. (b) Kaplan-Meier Plot based on TCGA data3 indicates that combined FIP1L1 and PDGFRA expression is a negative prognostic factor in IDH1 mutant lower-grade gliomas. Multivariate analysis including the known prognostic factor 1p/19q deletion diminished this effect into non-significance, suggesting that other predictors of survival may also play a role in this model.
Extended Data Figure 3. CTCF anchored loop in the PDGFRA region.
(a) Schematic depiction of a HiC interaction signature of a CTCF-anchored loop domain, compared to an ordinary domain, as described by Rao et al., Cell 2014. CTCF-anchored loop domains are characterized by an increased interaction score at the apex of the domain, representing a CTCF-CTCF dimeric interaction. (b) IMR90 HiC contact matrix for the PDGFRA/FIP1L1 locus, as presented in Figure 3a. Solid circle indicates CTCF dimer interaction point. Dashed circles indicate lack of CTCF dimeric anchor signature. (c) IMR90 HiC contact matrix as in (b), but with expanded heatmap scale, more clearly conveys the CTCF-anchored loop that insulates PDGFRA. (d,e) HiC contact matrix for GM12878 cells for the same region confirms a single CTCF-anchored loop (solid circle) between PDGFRA and FIP1L1. These data support the significance of this specific boundary in locus topology and PDGFRA insulation.
Extended Data Figure 4. Characterization of the FIP1L1 enhancer.
(a) H3K27ac ChIP-seq track for GSC6 gliomaspheres reveals strong enrichment over the FIP1L1 enhancer. CTCF ChIP-seq track reveals location of the boundary element insulator (as in Figure 3a). FIP1L1 enhancer (i) and promoter (ii) are indicated. (b) H3K27ac ChIP-seq tracks for IDH mutant and wild-type gliomaspheres and glioma specimens reveal enrichment over the FIP1L1 enhancer. (c) ChIP-seq tracks for glioma master transcription factors and other histone modifications support the enhancer identity of the element (H3K27ac, H3K4me1, SOX2, OLIG2; lacks H3K4me3, lacks H3K27me3). In contrast, the FIP1L1 promoter has a distinct ‘promoter-like’ chromatin state.
Extended Data Figure 5. Interaction of the FIP1L1 enhancer with nearby promoters and PDGFRA quantified by reciprocal chromatin conformation capture (3C).
(top) The H3K27ac, CTCF and genetic architecture of the FIP1L1/PDGFRA locus is indicated, highlighting the 3C strategy. (bottom) Plots indicate the interaction signal of the indicated sites (black lines) with the common enhancer primer. The FIP1L1 enhancer interacts with local promoters in wild-type and mutant tumors and models. In IDH wild-type gliomas, it shows essentially no interaction with the PDGFRA promoter. In IDH mutant gliomas, it interacts with the PDGFRA promoter with comparable strength to the local interactions, despite the much larger intervening distance (900 kb). Error bars reflect standard deviations.
Extended Data Figure 6. Crenolanib reverses the increased growth of PDGFRA insulator disrupted cells.
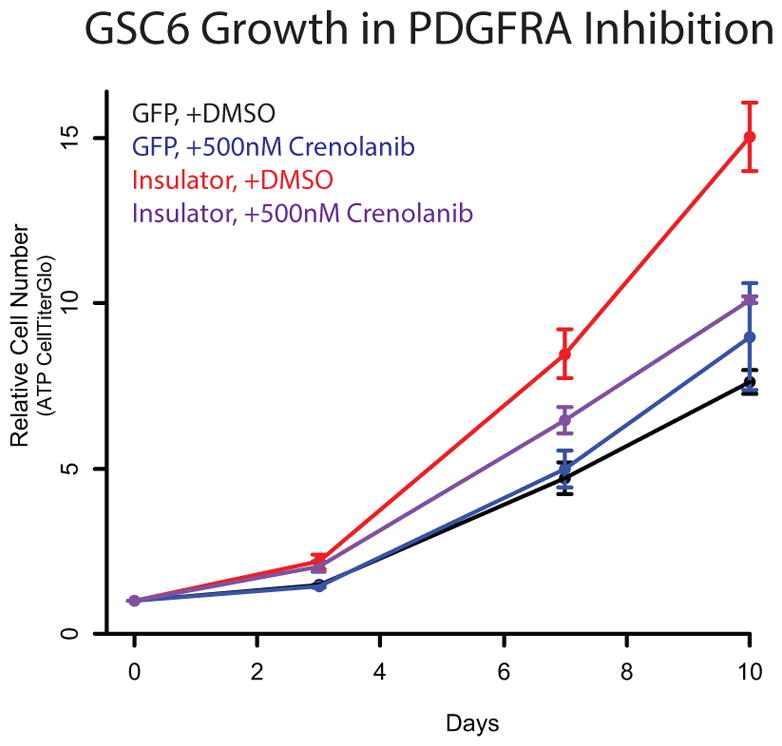
Insulator CRISPR-infected gliomaspheres exhibit a roughly 2-fold increase in proliferation rate, compared to control sgRNA infected gliomaspheres. This proliferative advantage is eliminated by treatment with the PDGFRα inhibitor Crenolanib. Crenolanib and Dasatinib both inhibit PDGFRα, but their other targets are non-overlapping. Hence, this sensitivity provides further support that PDGFRA induction drives the increased proliferation of the insulator CRISPR gliomaspheres. (Error bars reflect standard deviations).
Extended Data Figure 7. Signature of boundary deregulation in IDH mutant gliomas is robust.
Volcano plot depicts the significance (y-axis) of gene pairs that are either more or less correlated in IDH mutant than IDH wild-type gliomas. This plot was generated by repeating the analysis in the main text and shown in Figure 1f, except that here the statistics were performed using only the 14,055 genes expressed at >1 TPM in at least half the samples. This indicates that the boundary deregulation signature in IDH mutant gliomas is not sensitive to noise from lowly expressed genes.
Extended Data Table 1.
Clinical specimens and tumor models.Clinical information for glioma specimens and gliomasphere models is shown.
| Glioma | Tissue Type | Tissue Source | Source | IDH1 Status | PDGFRA Status | 1p/19q Status | Grade | Disease |
|---|---|---|---|---|---|---|---|---|
| GBM1w | Autopsy Specimen | Banked | MGH | Wild Type | Amplified | Not tested | IV | Glioblastoma |
| GBM2w | Surgical Specimen | Banked | MGH | Wild Type | Wild Type | Not tested | IV | Glioblastoma |
| GBM3w | Surgical Specimen | Banked | MGH | Wild Type | Wild Type | Not tested | IV | Glioblastoma |
| GBM4w | Surgical Specimen | Banked | MGH | Wild Type | Wild Type | Not tested | IV | Glioblastoma |
| GBM5w | Surgical Specimen | Fresh | MGH | Wild Type | Wild Type | Not tested | IV | Glioblastoma |
| GBM6w | Surgical Specimen | Fresh | MGH | Wild Type | Wild Type | Not tested | IV | Glioblastoma |
| GBM7w | Surgical Specimen | Fresh | MGH | Wild Type | Wild Type | Not tested | IV | Glioblastoma |
| AA15m | Surgical Specimen | Banked | MGH | R132H | Wild Type | Intact | III | Anaplastic Astrocytoma |
| AA16m | Surgical Specimen | Banked | MGH | R132H | Wild Type | Intact | III | Anaplastic Astrocytoma |
| AA17m | Surgical Specimen | Fresh | MGH | R132H | Wild Type | Intact | III | Anaplastic Astrocytoma |
| OD18m | Surgical Specimen | Fresh | MGH | R132H | Wild Type | Lost | II | Oligodendroglioma |
| AA19m | Surgical Specimen | Fresh | MGH | R132H | Wild Type | Intact | III | Anaplastic Astrocytoma |
| GSC4 | Gliomasphere | - | MGH | Wild Type | Wild Type | Intact | IV | Glioblastoma |
| GSC6 | Gliomasphere | - | MGH | Wild Type | Wild Type | Intact | IV | Glioblastoma |
| BT142 | Gliomasphere | - | ATCC | R132H | Wild Type | Intact | III | Anaplastic Oligoastrocytoma |
| GSC119 | Gliomasphere | - | MGH | R132H | Wild Type | Intact | IV | Secondary Glioblastoma |
Extended Data Table 2.
Sequenced Libraries Characteristics.Pertinent statistics are listed for ChIP, genomic DNA, and bisulfite-converted sequencing libraries.
| Sample Name | Experiment | Sequencing Depth | Sequencing Format | Sequencing Instrument | Total read number (millions) |
|---|---|---|---|---|---|
| GBM1w - CTCF | CTCF ChIP-seq | 38 base pairs | Paired end | Illumina NextSeq 500 | 19.3 |
| GBM2w - CTCF | CTCF ChIP-seq | 38 base pairs | Paired end | Illumina NextSeq 500 | 17.6 |
| GBM3w - CTCF | CTCF ChIP-seq | 38 base pairs | Paired end | Illumina NextSeq 500 | 20.2 |
| GBM5w - CTCF | CTCF ChIP-seq | 38 base pairs | Paired end | Illumina NextSeq 500 | 30 |
| GBM6w - CTCF | CTCF ChIP-seq | 38 base pairs | Paired end | Illumina NextSeq 500 | 35.1 |
| GBM7w - CTCF | CTCF ChIP-seq | 38 base pairs | Paired end | Illumina NextSeq 500 | 36 |
| AA15m - CTCF | CTCF ChIP-seq | 38 base pairs | Paired end | Illumina NextSeq 500 | 8.7 |
| AA16m - CTCF | CTCF ChIP-seq | 38 base pairs | Paired end | Illumina NextSeq 500 | 23.7 |
| AA17m - CTCF | CTCF ChIP-seq | 38 base pairs | Paired end | Illumina NextSeq 500 | 16.3 |
| OD18m - CTCF | CTCF ChIP-seq | 38 base pairs | Paired end | Illumina NextSeq 500 | 9.2 |
| AA19m - CTCF | CTCF ChIP-seq | 38 base pairs | Paired end | Illumina NextSeq 500 | 33 |
| GSC4 - CTCF | CTCF ChIP-seq | 38 base pairs | Paired end | Illumina NextSeq 500 | 19.9 |
| GSC6 - CTCF | CTCF ChIP-seq | 38 base pairs | Paired end | Illumina NextSeq 500 Illumina | 21.9 |
| BT142 - CTCF | CTCF ChIP-seq | 38 base pairs | Paired end | Illumina NextSeq 500 | 16 |
| GSC119 - CTCF | CTCF ChIP-seq | 50 base pairs | Single end | Illumina Miseq | 6.39 |
| GBM1w - H3K27ac | H3K27ac ChIP-seq | 38 base pairs | Paired end | Illumina NextSeq 500 | 12.7 |
| GBM2w - H3K27ac | H3K27ac ChIP-seq | 38 base pairs | Paired end | Illumina NextSeq 500 | 10.8 |
| AA15m - H3K27ac | H3K27ac ChIP-seq | 38 base pairs | Paired end | Illumina NextSeq 500 | 11.8 |
| GSC4 - H3K27ac | H3K27ac ChIP-seq | 38 base pairs | Paired end | Illumina NextSeq 500 | 9.7 |
| GSC6 - H3K27ac | H3K27ac ChIP-seq | 36 base pairs | Single end | Illumina Hiseq 2500 | 10.5 |
| GSC119 - H3K27ac | H3K27ac ChIP-seq | 38 base pairs | Paired end | Illumina NextSeq 500 | 9 |
| GSC6 CRISPR - GFP sgRNA | Locus Sequencing | 50 base pairs | Single end | Illumina Miseq | 0.539 |
| GSC6 CRISPR -insulator sgRNA | Locus Sequencing | 50 base pairs | Single end | Illumina Miseq | 0.639 |
| GSC4 bisulfite | Bisulfite Sequncing | 38 base pairs | Paired end | Illumina NextSeq 500 | 0.149 |
| GSC6 bisulfite | Bisulfite Sequncing | 38 base pairs | Paired end | Illumina NextSeq 500 | 0.149 |
| BT142 bisulfite | Bisulfite Sequncing | 38 base pairs | Paired end | Illumina NextSeq 500 | 0.149 |
| GSC119 bisulfite | Bisulfite Sequncing | 38 base pairs | Paired end | Illumina NextSeq 500 | 0.156 |
Supplementary Material
Acknowledgments
We thank James Kim, the MGH Neuro Oncology Tissue Repository, and the MGH Pathology Flow Cytometry Core for assistance with clinical samples and analysis. W.A.F. is supported by a basic research fellowship from the American Brain Tumor Association. B.B.L. is supported by a Jane Coffin Childs fellowship. B.E.B. is an American Cancer Society Research Professor. This research was supported by funds from Howard Hughes Medical Institute, the National Brain Tumor Society and the National Human Genome Research Institute.
Footnotes
Conception and experimental design: W.A.F., Y.D., B.B.L., S.M.G., M.L.S., and B.E.B. Methodology and data acquisition: W.A.F., Y.D., B.B.L., S.M.G., A.S.V., A.O.S-R., M.L.S., and B.E.B. Analysis and interpretation of data: W.A.F., Y.D., and B.E.B. Manuscript writing: W.A.F., Y.D., and B.E.B. W.A.F., and Y.D. contributed equally to this report.
The authors declare no competing interests.
Data generated for this study are available through GEO accession number GSE70991.
References
- 1.Parsons DW, et al. An integrated genomic analysis of human glioblastoma multiforme. Science. 2008;321:1807–1812. doi: 10.1126/science.1164382. [DOI] [PMC free article] [PubMed] [Google Scholar]
- 2.Cancer Genome Atlas Research N. Comprehensive, Integrative Genomic Analysis of Diffuse Lower-Grade Gliomas. The New England journal of medicine. 2015;372:2481–2498. doi: 10.1056/NEJMoa1402121. [DOI] [PMC free article] [PubMed] [Google Scholar]
- 3.Dang L, et al. Cancer-associated IDH1 mutations produce 2-hydroxyglutarate. Nature. 2009;462:739–744. doi: 10.1038/nature08617. [DOI] [PMC free article] [PubMed] [Google Scholar]
- 4.Figueroa ME, et al. Leukemic IDH1 and IDH2 mutations result in a hypermethylation phenotype, disrupt TET2 function, and impair hematopoietic differentiation. Cancer cell. 2010;18:553–567. doi: 10.1016/j.ccr.2010.11.015. [DOI] [PMC free article] [PubMed] [Google Scholar]
- 5.Xu W, et al. Oncometabolite 2-hydroxyglutarate is a competitive inhibitor of alpha-ketoglutarate-dependent dioxygenases. Cancer cell. 2011;19:17–30. doi: 10.1016/j.ccr.2010.12.014. [DOI] [PMC free article] [PubMed] [Google Scholar]
- 6.Lu C, et al. IDH mutation impairs histone demethylation and results in a block to cell differentiation. Nature. 2012;483:474–478. doi: 10.1038/nature10860. [DOI] [PMC free article] [PubMed] [Google Scholar]
- 7.Cairns RA, Mak TW. Oncogenic isocitrate dehydrogenase mutations: mechanisms, models, and clinical opportunities. Cancer discovery. 2013;3:730–741. doi: 10.1158/2159-8290.CD-13-0083. [DOI] [PubMed] [Google Scholar]
- 8.Pastor WA, Aravind L, Rao A. TETonic shift: biological roles of TET proteins in DNA demethylation and transcription. Nature reviews. Molecular cell biology. 2013;14:341–356. doi: 10.1038/nrm3589. [DOI] [PMC free article] [PubMed] [Google Scholar]
- 9.Kohli RM, Zhang Y. TET enzymes, TDG and the dynamics of DNA demethylation. Nature. 2013;502:472–479. doi: 10.1038/nature12750. [DOI] [PMC free article] [PubMed] [Google Scholar]
- 10.Noushmehr H, et al. Identification of a CpG island methylator phenotype that defines a distinct subgroup of glioma. Cancer cell. 2010;17:510–522. doi: 10.1016/j.ccr.2010.03.017. [DOI] [PMC free article] [PubMed] [Google Scholar]
- 11.Turcan S, et al. IDH1 mutation is sufficient to establish the glioma hypermethylator phenotype. Nature. 2012;483:479–483. doi: 10.1038/nature10866. [DOI] [PMC free article] [PubMed] [Google Scholar]
- 12.Bickmore WA, van Steensel B. Genome architecture: domain organization of interphase chromosomes. Cell. 2013;152:1270–1284. doi: 10.1016/j.cell.2013.02.001. [DOI] [PubMed] [Google Scholar]
- 13.Lieberman-Aiden E, et al. Comprehensive mapping of long-range interactions reveals folding principles of the human genome. Science. 2009;326:289–293. doi: 10.1126/science.1181369. [DOI] [PMC free article] [PubMed] [Google Scholar]
- 14.Dixon JR, et al. Topological domains in mammalian genomes identified by analysis of chromatin interactions. Nature. 2012;485:376–380. doi: 10.1038/nature11082. [DOI] [PMC free article] [PubMed] [Google Scholar]
- 15.Rao SS, et al. A 3D map of the human genome at kilobase resolution reveals principles of chromatin looping. Cell. 2014;159:1665–1680. doi: 10.1016/j.cell.2014.11.021. [DOI] [PMC free article] [PubMed] [Google Scholar]
- 16.Nora EP, et al. Spatial partitioning of the regulatory landscape of the X-inactivation centre. Nature. 2012;485:381–385. doi: 10.1038/nature11049. [DOI] [PMC free article] [PubMed] [Google Scholar]
- 17.Lupianez DG, et al. Disruptions of topological chromatin domains cause pathogenic rewiring of gene-enhancer interactions. Cell. 2015;161:1012–1025. doi: 10.1016/j.cell.2015.04.004. [DOI] [PMC free article] [PubMed] [Google Scholar]
- 18.Bell AC, Felsenfeld G. Methylation of a CTCF-dependent boundary controls imprinted expression of the Igf2 gene. Nature. 2000;405:482–485. doi: 10.1038/35013100. [DOI] [PubMed] [Google Scholar]
- 19.Hark AT, et al. CTCF mediates methylation-sensitive enhancer-blocking activity at the H19/Igf2 locus. Nature. 2000;405:486–489. doi: 10.1038/35013106. [DOI] [PubMed] [Google Scholar]
- 20.Consortium, G. T. Human genomics. The Genotype-Tissue Expression (GTEx) pilot analysis: multitissue gene regulation in humans. Science. 2015;348:648–660. doi: 10.1126/science.1262110. [DOI] [PMC free article] [PubMed] [Google Scholar]
- 21.Zuin J, et al. Cohesin and CTCF differentially affect chromatin architecture and gene expression in human cells. Proceedings of the National Academy of Sciences of the United States of America. 2014;111:996–1001. doi: 10.1073/pnas.1317788111. [DOI] [PMC free article] [PubMed] [Google Scholar]
- 22.Sturm D, et al. Paediatric and adult glioblastoma: multiform (epi)genomic culprits emerge. Nature reviews. Cancer. 2014;14:92–107. doi: 10.1038/nrc3655. [DOI] [PMC free article] [PubMed] [Google Scholar]
- 23.Brennan CW, et al. The somatic genomic landscape of glioblastoma. Cell. 2013;155:462–477. doi: 10.1016/j.cell.2013.09.034. [DOI] [PMC free article] [PubMed] [Google Scholar]
- 24.Verhaak RG, et al. Integrated genomic analysis identifies clinically relevant subtypes of glioblastoma characterized by abnormalities in PDGFRA, IDH1, EGFR, and NF1. Cancer cell. 2010;17:98–110. doi: 10.1016/j.ccr.2009.12.020. [DOI] [PMC free article] [PubMed] [Google Scholar]
- 25.Wang H, et al. Widespread plasticity in CTCF occupancy linked to DNA methylation. Genome research. 2012;22:1680–1688. doi: 10.1101/gr.136101.111. [DOI] [PMC free article] [PubMed] [Google Scholar]
- 26.Hsu PD, Lander ES, Zhang F. Development and applications of CRISPR-Cas9 for genome engineering. Cell. 2014;157:1262–1278. doi: 10.1016/j.cell.2014.05.010. [DOI] [PMC free article] [PubMed] [Google Scholar]
- 27.Sander JD, Joung JK. CRISPR-Cas systems for editing, regulating and targeting genomes. Nature biotechnology. 2014;32:347–355. doi: 10.1038/nbt.2842. [DOI] [PMC free article] [PubMed] [Google Scholar]
- 28.Baylin SB, Jones PA. A decade of exploring the cancer epigenome - biological and translational implications. Nature reviews. Cancer. 2011;11:726–734. doi: 10.1038/nrc3130. [DOI] [PMC free article] [PubMed] [Google Scholar]
- 29.Costello JF, Berger MS, Huang HS, Cavenee WK. Silencing of p16/CDKN2 expression in human gliomas by methylation and chromatin condensation. Cancer research. 1996;56:2405–2410. [PubMed] [Google Scholar]
- 30.Koivunen P, et al. Transformation by the (R)-enantiomer of 2-hydroxyglutarate linked to EGLN activation. Nature. 2012;483:484–488. doi: 10.1038/nature10898. [DOI] [PMC free article] [PubMed] [Google Scholar]
- 31.Chi AS, et al. Prospective, high-throughput molecular profiling of human gliomas. Journal of neuro-oncology. 2012;110:89–98. doi: 10.1007/s11060-012-0938-9. [DOI] [PMC free article] [PubMed] [Google Scholar]
- 32.Rheinbay E, et al. An aberrant transcription factor network essential for Wnt signaling and stem cell maintenance in glioblastoma. Cell reports. 2013;3:1567–1579. doi: 10.1016/j.celrep.2013.04.021. [DOI] [PMC free article] [PubMed] [Google Scholar]
- 33.Suva ML, et al. Reconstructing and reprogramming the tumor-propagating potential of glioblastoma stem-like cells. Cell. 2014;157:580–594. doi: 10.1016/j.cell.2014.02.030. [DOI] [PMC free article] [PubMed] [Google Scholar]
- 34.Wakimoto H, et al. Maintenance of primary tumor phenotype and genotype in glioblastoma stem cells. Neuro-oncology. 2012;14:132–144. doi: 10.1093/neuonc/nor195. [DOI] [PMC free article] [PubMed] [Google Scholar]
- 35.Luchman HA, et al. An in vivo patient-derived model of endogenous IDH1-mutant glioma. Neuro-oncology. 2012;14:184–191. doi: 10.1093/neuonc/nor207. [DOI] [PMC free article] [PubMed] [Google Scholar]
- 36.Lai RK, et al. Genome-wide methylation analyses in glioblastoma multiforme. PloS one. 2014;9:e89376. doi: 10.1371/journal.pone.0089376. [DOI] [PMC free article] [PubMed] [Google Scholar]
- 37.Abyzov A, Urban AE, Snyder M, Gerstein M. CNVnator: an approach to discover, genotype, and characterize typical and atypical CNVs from family and population genome sequencing. Genome research. 2011;21:974–984. doi: 10.1101/gr.114876.110. [DOI] [PMC free article] [PubMed] [Google Scholar]
- 38.Chudnovsky Y, et al. ZFHX4 interacts with the NuRD core member CHD4 and regulates the glioblastoma tumor-initiating cell state. Cell reports. 2014;6:313–324. doi: 10.1016/j.celrep.2013.12.032. [DOI] [PMC free article] [PubMed] [Google Scholar]
- 39.Bao S, et al. Targeting cancer stem cells through L1CAM suppresses glioma growth. Cancer research. 2008;68:6043–6048. doi: 10.1158/0008-5472.CAN-08-1079. [DOI] [PMC free article] [PubMed] [Google Scholar]
- 40.Sandelin A, Alkema W, Engstrom P, Wasserman WW, Lenhard B. JASPAR: an open-access database for eukaryotic transcription factor binding profiles. Nucleic acids research. 2004;32:D91–94. doi: 10.1093/nar/gkh012. [DOI] [PMC free article] [PubMed] [Google Scholar]
- 41.de Laat W, Dekker J. 3C-based technologies to study the shape of the genome. Methods. 2012;58:189–191. doi: 10.1016/j.ymeth.2012.11.005. [DOI] [PMC free article] [PubMed] [Google Scholar]
- 42.Hagege H, et al. Quantitative analysis of chromosome conformation capture assays (3C-qPCR) Nature protocols. 2007;2:1722–1733. doi: 10.1038/nprot.2007.243. [DOI] [PubMed] [Google Scholar]
- 43.Cong L, et al. Multiplex genome engineering using CRISPR/Cas systems. Science. 2013;339:819–823. doi: 10.1126/science.1231143. [DOI] [PMC free article] [PubMed] [Google Scholar]
- 44.Cahoy JD, et al. A transcriptome database for astrocytes, neurons, and oligodendrocytes: a new resource for understanding brain development and function. The Journal of neuroscience: the official journal of the Society for Neuroscience. 2008;28:264–278. doi: 10.1523/JNEUROSCI.4178-07.2008. [DOI] [PMC free article] [PubMed] [Google Scholar]
Associated Data
This section collects any data citations, data availability statements, or supplementary materials included in this article.


