

Abstract
We investigated the effects of dietary whey protein on food intake, body fat, and body weight gain in rats. Adult (11–12 week) male Sprague–Dawley rats were divided into three dietary treatment groups for a 10-week study: control. Whey protein (HP-W), or high-protein content control (HP-S). Albumin was used as the basic protein source for all three diets. HP-W and HP-S diets contained an additional 24% (wt/wt) whey or isoflavone-free soy protein, respectively. Food intake, body weight, body fat, respiratory quotient (RQ), plasma cholecystokinin (CCK), glucagon like peptide-1 (GLP-1), peptide YY (PYY), and leptin were measured during and/or at the end of the study. The results showed that body fat and body weight gain were lower (P < 0.05) at the end of study in rats fed HP-W or HP-S vs. control diet. The cumulative food intake measured over the 10-week study period was lower in the HP-W vs. control and HP-S groups (P < 0.01). Further, HP-W fed rats exhibited lower N2 free RQ values than did control and HP-S groups (P < 0.01). Plasma concentrations of total GLP-1 were higher in HP-W and HP-S vs. control group (P < 0.05), whereas plasma CCK, PYY, and leptin did not differ among the three groups. In conclusion, although dietary HP-W and HP-S each decrease body fat accumulation and body weight gain, the mechanism(s) involved appear to be different. HP-S fed rats exhibit increased fat oxidation, whereas HP-W fed rats show decreased food intake and increased fat oxidation, which may contribute to the effects of whey protein on body fat.
INTRODUCTION
Whey protein is an abundant byproduct in cheese production (10 liter of milk produces about 9 liter of whey during cheese manufacture (1). Because it contains all essential amino acids and can rapidly increase plasma amino acid concentrations, whey protein is considered to be a high quality protein (2,3), and is thus commonly used for maintaining healthy body weight in humans (4–6). Although, in general, a high-protein diet decreases food intake (7–10), whey protein shows greater suppression of appetite in the next hour of feeding than do egg-albumin, soy protein, and casein (5,11,12). Whey protein is also more effective than red meat in reducing body weight gain and increasing insulin sensitivity (6). These studies indicate that HP-W may have unique properties in maintaining healthy body weight. However, most studies on whey protein suppression of appetite in humans have been short- term, with food intake or satiation measured several hours after consumption of a single whey protein meal. The results are also contradictory because the duration to the next meal and composition of the test meals were varied in these studies (5,11–13). Thus, longer term studies and use of carefully matched dietary components for test and control diets are needed to clarify the role of whey protein on food intake and body weight.
In this study, we used a rat model and carefully designed control diets to examine the longer term effects of dietary whey protein on body fat and food intake. During a 10 week study period, food intake, body fat, body weight gain, and metabolic rate (respiratory quotient (RQ)) were measured in rats fed whey protein or two different control diets. There is consider- able interest in whether whey protein affects satiety and food intake via alterations in the secretion or action(s) of the gut secreted anorectic hormones, glucagon like peptide-1 (GLP-1), peptide YY (PYY), and cholecystokinin (CCK) (14–16). Thus, we measured plasma concentrations of GLP-1, PYY, and CCK. Leptin, another important hormone in regulation of food intake and body fat, was also measured.
Two control diets were used in this study: one had the protein content of the AIN-93M based rodent diet (14%), whereas the other had the same higher protein content (38%) as the whey protein diet, although another source of protein was used. This study design allowed us to examine the effects of dietary whey protein vs. high dietary protein in general, on food intake and body fat.
METHODS AND PROCEDURES
Animals and housing conditions
Thirty healthy adult male Sprague–Dawley rats (11–12 week old) were purchased from Harlan Industries (Indianapolis, IN). After quarantine, the rats were single housed in suspended wire-bottom cages in a humidity and temperature controlled room (22 ± 2 °C, 65–67% humidity) on a 12:12 h light:dark cycle with free access to food and water. Wire-bottom cages were used to measure food spillage. All rats were fed semipurified powder diets prepared in our laboratory. Rats were fed the AIN-93M based rodent control diet and acclimated to experimental conditions until their body weights were stable (about 2 weeks). The protocol was approved by the Pennington Biomedical Research Center’s Animal Care and Use Committee.
Diets
The regular control (control) diet was prepared based on the AIN-93M formula for laboratory rodents (17) and egg albumin was used as the protein source. The components of the whey protein (HP-W) diet were the same as those of the control diet, except that half the starch in the diet was replaced by whey protein. The high-protein content control (HP-S) diet had the same protein content as the HP-W diet, although the whey protein was replaced by isoflavone-free soy protein. This HP-S diet was designed to compare whey protein with a non-milk protein source. Isoflavone-free soy protein was used to avoid the reported bioactivities of isoflavones that are naturally associated with soy protein. The total protein contents were 14% for Control diet, 38% for HP-W diet (14% egg albumin plus 24% HP-W), and 38% for HP-S diet (14% egg albumin plus 24% isoflavone-free soy protein). The detailed compositions of the three experimental diets are listed in Table 1.
Table 1.
Experimental diets components
| Ingredients (g) | Control diet | HP-W diet | HP-S diet |
|---|---|---|---|
| Albumin (egg white) | 140 | 140 | 140 |
| Whey protein concentrate 80 | 0 | 300 | 0 |
| Soy protein | 0 | 0 | 353.74 |
| Starch | 612.5 | 312.5 | 258.8 |
| Sucrose | 100 | 100 | 100 |
| Soybean oil | 40 | 40 | 40 |
| Cellulose | 50 | 50 | 50 |
| Mineral mix for egg white protein | 35 | 35 | 35 |
| Vitamin mix | 10 | 10 | 10 |
| Choline chloride | 2.5 | 2.5 | 2.5 |
| Biotin/Sucrose Premix | 10 | 10 | 10 |
| Total (g) | 1,000 | 1,000 | 1,000 |
| BHT(in oil) | 0.008 | 0.008 | 0.008 |
| Total protein content (%) | 14 | 38 | 38 |
| Total fat content (%) | 4 | 4 | 4 |
| Total carbohydrate content (%) | 82 | 58 | 58 |
Experimental protocol
After acclimatization to the experimental conditions (powder diet and wire cages), rats were divided into three dietary treatment groups for a 10 week study. Each group had a similar average body weight and body fat at the beginning of the study. Fresh food was provided to each rat three times per week by changing the food jar of each rat. Food intake was recorded by weighing the food jar before it was placed into the cage with fresh diet (full jar weight) and when it was taken out of the cage (empty jar weight) 2 or 3 days later. Food spillage was also recorded by carefully weighing the spillage under the wire cage for each rat. Because all three diets were powder diets, there were no differences in diet consistency that would have made the spillage of one diet harder to measure than that of the other diets. The food intake was calculated by subtracting the weights of the empty food jars and spillage from the weights of the full food jars for each rat. Body weight was also measured three times per week when food intake was measured. During the first 6 weeks of the study period, rats were undisturbed except for food intake and body weight measurements. At the 6th week of the study, body composition was measured by nuclear magnetic resonance (NMR) in all rats. On the 7th and 8th weeks of the study, rats were placed in metabolic chambers for measurement of respiratory exchange ratios (RQ’s). Body weight gain was calculated as the body weight on the day of measurement minus the body weight recorded at the beginning of study (daymeasurement−day0). All rats were killed by decapitation at the end of the study. Trunk blood was collected from each rat for measurements of GLP-1, PYY, CCK, and leptin.
Body fat and lean body mass measurements during the study
Body fat and lean body mass were measured during the study by NMR (Bruker minispec Live Rats Analyzer model mq7.5, LF90; Bruker Optics, Woodlands, TX) (18). Each rat was weighed before it was placed in the Control for body composition calculation. For each rat, the measurements were repeated twice and the difference of % fat for each rat was <3%. If not, a third measurement was obtained and the two closer values (within 3% difference) were averaged and used for calculation of body fat and lean body mass. The % total body fat or % lean body mass was calculated as the fat mass or lean body mass divided by body weight.
Body fat measurement at the end of experiment
Total abdominal fat pads (retroperitoneal, perirenal, and epididymal) were removed and wet weights were measured on an analytical balance. Body weight was recorded before the fat dissection was performed. The total abdominal fat was considered to be the sum of three fat pads, and % body fat was calculated as total abdominal fat divided by body weight.
Indirect calorimetry
Rats were placed in metabolic chambers (Oxymax; Columbus Instruments, Columbus, OH) at room temperature (23 °C) for 6 days. The first 3 days served as an adaptation period. Oxygen consumption (VO2), carbon dioxide expiration (VCO2), and respiratory exchange rate (RQ: VCO2/VO2) were recorded continuously during the last 3 days. Data collected from the last 2 days of the 3 day data collection period were used for analysis. Because the HP-W diet and HP diet had significantly higher amounts of dietary protein than did the control diet, (38% vs. 14%), N-free RQ was calculated (19) and used as the indicator of metabolic rate.
GLP-1, PYY, ccK, and leptin measurements
At the end of the study, trunk blood from each rat was collected in EDTA tubes and centrifuged at 4,000g for 20 min to extract plasma. Plasma total GLP-1, PYY, CCK, and leptin were measured by radioimmunoassay with kits from Linco Research (St Louis, MO). The intra-assay coefficients of variations were within 9.7% for GLP-1, 7.8% for PYY, 5.5% for CCK, and 9.4% for leptin. The interassay coefficient of variation is not applicable because each hormone was measured within a single assay.
Statistical analysis
Data are presented as mean values ± s.e.m. One-way ANOVA followed by an F-protected least significant difference method was used to analyze all data. Body weight gain data were compared within the same day for the three groups of rats. For the cumulative food intake, data were analyzed using repeated measures ANOVA with diet as the independent variable. Food intake at the start of the experiment was used as a covariate in the analysis. Post-hoc comparisons of treatment means at different time points were examined by t-test and the significance levels reported were unadjusted for multiple comparisons. For all tests described above, a P < 0.05 was considered significant. SAS (SAS for Windows, Release 9.2; SAS Institute, Cary, NC) was used for data analysis.
RESULTS
Body weight
Body weight gain during the experimental period is shown in Figure 1. Both the HP-W group and HP-S group had lower body weight gains than did the control group at the end of the experiment (P < 0.05).
Figure 1.

Body weight gain for rats fed control, HP-S, or HP-W diets. Data represent mean values ± s.e.m. (n = 10–11 per group). Letters below the lines indicate significant differences (P < 0.05), as shown. (a) HP-W group is lower than both control and HP-S groups. (b) HP-W is lower than control, and HP-S is between the HP-W and control but not different from either of them. (c) Both HP-W and HP-S are lower than control. HP-S, high-protein content control; HP-W, whey protein.
Food intake
Cumulative food intake is shown in Figure 2. The cumulative food intake in HP-W fed rats was significantly lower than in both control and HP-S groups from week 5 until the end of the study (P < 0.01).
Figure 2.

Cumulative food intake for rats fed control, HP-S, or HP-W diets for 10 weeks. Data represent mean values ± s.e.m. (n = 10–11 per group). *Indicates significant difference (P < 0.01) compared with control or HP-S groups. HP-S, high-protein content control; HP-W, whey protein.
Body fat and lean body mass
Body fat measured by NMR during the 6th week of the study (Figure 3a) was lower in the HP-W fed rats than in the HP-S diet group (P < 0.05). Body fat of control diet fed rats was intermediate between, and did not differ significantly from that of either the HP-W or HP-S groups. There was no significant difference for lean body mass among three groups, determined from the same NMR measurement (data not shown). At the end of the study, body fat in the two high-protein diet groups was lower than that of the control diet fed rats (P < 0.05, Figure 3b).
Figure 3.

Body fat measured at (a) week 6 by nuclear magnetic resonance and (b) at the end of study by dissection for rats fed control, HP-S, or HP-W diets. (a) Body fat (%) was calculated as total body fat divided by body weight (b) or the sum of abdominal fat pads divided by body weight. Data represent mean values ± s.e.m. (n = 9–11 per group). Letters above the columns indicate significant differences (P < 0.05).
HP-S, high-protein content control; HP-W, whey protein.
Metabolic rate
The N-free RQ values differed significantly (P < 0.01) among all three treatment groups (Figure 4), with the lowest values in the HP-W group, intermediate values in the HP-S group, and the highest values in the control group.
Figure 4.
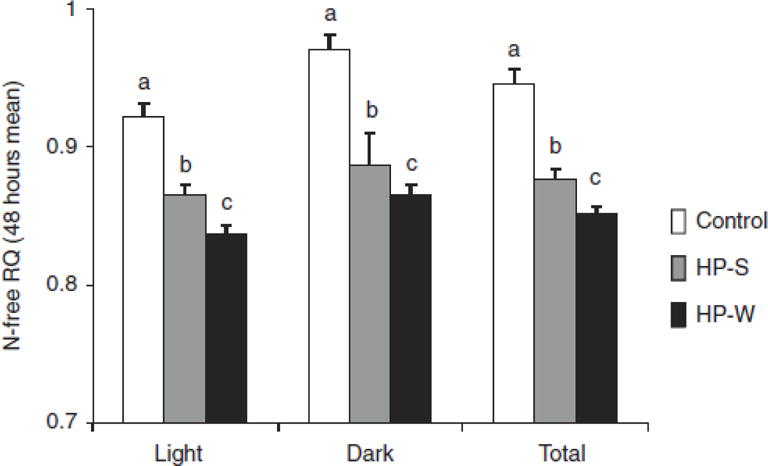
N-free respiratory quotient (light cycle, dark cycle, total light + dark cycle) of rats fed control, HP-S, or HP-W diets for 7–8 weeks. The detailed calculation method is described in the manuscript. Data represent mean values ± s.e.m. (n = 10–11 per group). Letters above the columns indicate significant differences within the time period (P < 0.01). HP-S, high-protein content control; HP-W, whey protein.
Hormone measurements
Hormones were measured in the plasma collected at the end of the study (Figure 5). Plasma total GLP-1 concentrations were higher in the HP-S and HP-W groups compared with the control diet group (P < 0.01). There were no significant differences in leptin, CCK, and PYY concentrations among the three groups.
Figure 5.
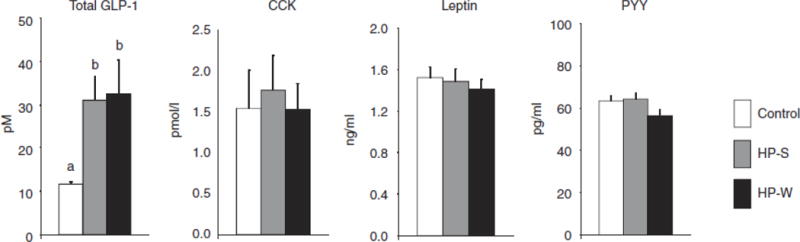
Plasma hormones measured by radioimmunoassay at the end of study for rats fed control, HP-S, or HP-W diets. Data represent mean values ± s.e.m. (n = 9–11 per group). Different letters above the column indicate significant differences (P < 0.01). CCK, cholecystokinin; HP-S, high- protein content control; HP-W, whey protein; GLP-1, glucagon like peptide-1; PPY, peptide YY.
DISCUSSION
The purpose of this study was to compare the effects of whey protein with non–whey protein on food intake and body fat. We chose isoflavone-free soy protein as the comparable protein source, as it is a non-milk based protein source and is widely used in maintaining health body weight. In addition, we used isoflavone-free soy protein to eliminate the potential effects of estrogenic activity of soy (20) on food intake (21). Our results demonstrate that a high-protein diet (38% protein content) using either whey or isoflavone-free soy protein reduces body weight gain, body fat and N-free RQ in rats compared to the control diet. However, the mechanisms involved may differ, based on the dietary protein used. The reduction of N-free RQ was greater in HP-W vs. HP-S fed rats, and the reduction of cumulative food intake was only observed in HP-W fed rats.
The appetite suppressive effect of HP-W is controversial based on previous publications. In several short-term human studies (11,12,22–26), a whey protein meal was compared with control meals that had lower protein content and other meals that had similar protein content as the whey meal. The proto- cols of those studies were similar. Several hours after ingestion of a single meal (either whey or other test meal), the subject was provided with a standard meal, and the appetite suppressive effect was judged by measuring intake of the subsequent meal. These protocols were designed to examine changes in postprandial satiety hormone secretion. Thus, the subsequent measurements for food intake were short-term. Those studies consistently demonstrated the appetite suppressive effect of whey, compared with a control meal. But results varied when the whey meal was compared with test meals that had equal protein content. None of those studies reported 24 h or longer term food intake. The effect of whey protein on food intake has also been compared with test meals of equal protein content at two different total dietary protein levels: 10% or 25%. Whey protein suppressed subsequent food intake of the next meal at low protein concentration (10% of dietary energy), but not at the higher protein concentration (25% of dietary energy) (27). In animal models, dietary whey protein suppressed food intake more than did soy or gluten during a 7 day period (28). In contrast, dietary whey protein did not significantly reduce average daily food intake in high fat induced obese rats in an 8 week study (29). There are two major differences when comparing this study with those cited above. First, we did not investigate hourly or daily food intake alterations after whey protein ingestion. Secondly, the food intake was reported as cumulative food intake over the entire study period. The cumulative food intake in HP-W fed rats was consistently lower than that in control and HP-S groups. This small reduction reached statistical significance at the 5th week of the study and continued to the end of the study. We used cumulative food intake as the indicator of food intake, as it represents a small, but consistent, change in food intake over a long period of time. Such data are difficult to obtain accurately in human studies.
This mild, but consistent, reduction of food intake suggests that whey protein regulates food intake via a distinctly different mechanism than in HP-S fed rats. The high-protein con- tent and alteration in GLP-1 are unlikely associated with this unique mechanism directly, as the HP-S group exhibited the same changes in anorectic hormone profile as the HP-W group, but did not show any reduction of food intake. The unique amino acid composition in whey protein might be involved in the mechanism of food intake reduction. Whey protein, com- pared to the other protein sources, contains the highest con- centration of branched-chain amino acids, especially L-leucine (30). Leucine can enter the brain from the blood more rapidly than other amino acids (31). We have reported that leucine is important in controlling food intake and can decrease 24 h food intake in rats. This hypothalamic action is related to regulation of mRNA expression of agouti-related peptide, a long term regulator of food intake (32). Therefore, dietary whey protein might decrease food intake through its special amino acid profile, especially leucine, and altering neuropeptide synthesis in the hypothalamus, an important site for controlling food intake at the brain. In this study, the three experimental diets had different protein contents that might have affected urinary N loss. Thus, N-free RQ was used for calculation of metabolic rates for rats in three different dietary groups. We detected a decreased RQ in both the HP-S and HP-W groups compared with the regular control group. This decrease in RQ is in agreement with the decreased body fat and body weight gain in rats fed both HP-S and HP-W diets, and might have resulted from general effects of the high-protein content in the diet. However, rats in the HP-W protein group had a lower RQ than did rats in the HP-S group. Our result is consistent with the observation from a recently published human study wherein whey protein showed a decreased RQ compared to soy protein (13). Thus, it is possible that whey protein is more effective than soy protein in decreasing RQ in rats. One limitation of this study is that the exact total lean and fat mass of rats were not known when indirect calorimetry was conducted, or at the end of study. Thus, we could not specify the relative contribution of muscle vs. fat mass to decreased RQ for HP-S and HP-W fed rats.
Although protein in general, and whey protein in particular, can stimulate postprandial GLP-1, PYY, and CCK secretion in humans (11,33), we detected no significant differences in plasma concentrations of PYY, and CCK among the three dietary treatment groups of rats. Of note, we are interested in longer term, rather than the meal effects, of whey protein on gut hormone secretion. Thus, we did not measure the post- prandial levels of those hormones. Blood samples were collected in the morning, and most food intake occurred during the previous evening (around 6 PM when lights were turned off). As a result, hormone levels in the morning were affected less by the meal related fluctuation. This may explain the difference observed between this study and previously reported human studies (11,33). Similarly, elevated levels of total GLP-1 in both HP-W protein and HP-S groups are likely independent of the postprandial effect of diets. The mechanism for the increased GLP-1 remains to be clarified.
Although total GLP-1 was increased in the HP-W group, it is unlikely to have influenced food intake in our study. First, the HP-S group exhibited similarly elevated GLP-1 values, and food intake was not decreased in this group. Second, recent publications suggest that GLP-1 participates more in glucose control than in reduction of food intake (34,35). Nevertheless, the elevated plasma GLP-1 is associated with higher dietary protein content and lower N-free RQ in the HP-W and HP-S vs. control groups. It has been suggested that fasting plasma GLP-1 levels are directly related to an increased fat oxidation rate in humans (36,37). Thus, stimulation of GLP-1 secretion might be involved in body fat reduction by a high-protein diet in general in this study.
In conclusion, rats fed high-protein diets enriched with whey protein or isoflavone-free soy protein for ten weeks exhibited lower body fat and body weight gains than did control rats. HP-S fed rats exhibited increased fat oxidation, whereas HP-W fed rats had decreased food intake and a greater increase in fat oxidation, which may have contributed to the effects of whey protein on body fat.
Acknowledgments
This study was supported by a National Dairy Council contract (number: 1446) to Drs. J.Z. and R.M. This paper was approved for publication by the Director of the Louisiana Agricultural Experiment Station as manuscript number 2010-239-9617.
Footnotes
DISCLOSURE
The authors declared no conflict of interest.
References
- 1.Manso MA, Lopez-Fandino R. κCasein macropeptides from cheese whey: physicochemical, biological, nutritional, and technological features for possible uses. Food Rev Int. 2004;20:329–356. [Google Scholar]
- 2.Ha E, Zemel MB. Functional properties of whey, whey components, and essential amino acids: mechanisms underlying health benefits for active people (review) J Nutr Biochem. 2003;14:251–258. doi: 10.1016/s0955-2863(03)00030-5. [DOI] [PubMed] [Google Scholar]
- 3.Hoffman JR, Falvo MJ. Protein-Which is best? J Sports Sci Med. 2004;3:118–130. [PMC free article] [PubMed] [Google Scholar]
- 4.Marshall K. Therapeutic applications of whey protein. Altern Med Rev. 2004;9:136–156. [PubMed] [Google Scholar]
- 5.Bowen J, Noakes M, Trenerry C, Clifton PM. Energy intake, ghrelin, and cholecystokinin after different carbohydrate and protein preloads in overweight men. J Clin Endocrinol Metab. 2006;91:1477–1483. doi: 10.1210/jc.2005-1856. [DOI] [PubMed] [Google Scholar]
- 6.Belobrajdic DP, McIntosh GH, Owens JA. A high-whey-protein diet reduces body weight gain and alters insulin sensitivity relative to red meat in wistar rats. J Nutr. 2004;134:1454–1458. doi: 10.1093/jn/134.6.1454. [DOI] [PubMed] [Google Scholar]
- 7.Halton TL, Hu FB. The effects of high protein diets on thermogenesis, satiety and weight loss: a critical review. J Am Coll Nutr. 2004;23:373–385. doi: 10.1080/07315724.2004.10719381. [DOI] [PubMed] [Google Scholar]
- 8.Weigle DS, Breen PA, Matthys CC, et al. A high-protein diet induces sustained reductions in appetite, ad libitum caloric intake, and body weight despite compensatory changes in diurnal plasma leptin and ghrelin concentrations. Am J Clin Nutr. 2005;82:41–48. doi: 10.1093/ajcn.82.1.41. [DOI] [PubMed] [Google Scholar]
- 9.Moran LJ, Luscombe-Marsh ND, Noakes M, et al. The satiating effect of dietary protein is unrelated to postprandial ghrelin secretion. J Clin Endocrinol Metab. 2005;90:5205–5211. doi: 10.1210/jc.2005-0701. [DOI] [PubMed] [Google Scholar]
- 10.Anderson GH, Moore SE. Dietary proteins in the regulation of food intake and body weight in humans. J Nutr. 2004;134:974S–979S. doi: 10.1093/jn/134.4.974S. [DOI] [PubMed] [Google Scholar]
- 11.Hall WL, Millward DJ, Long SJ, Morgan LM. Casein and whey exert different effects on plasma amino acid profiles, gastrointestinal hormone secretion and appetite. Br J Nutr. 2003;89:239–248. doi: 10.1079/BJN2002760. [DOI] [PubMed] [Google Scholar]
- 12.Anderson GH, Tecimer SN, Shah D, Zafar TA. Protein source, quantity, and time of consumption determine the effect of proteins on short-term food intake in young men. J Nutr. 2004;134:3011–3015. doi: 10.1093/jn/134.11.3011. [DOI] [PubMed] [Google Scholar]
- 13.Alfenas Rde C, Bressan J, Paiva AC. Effects of protein quality on appetite and energy metabolism in normal weight subjects. Arq Bras Endocrinol Metabol. 2010;54:45–51. doi: 10.1590/s0004-27302010000100008. [DOI] [PubMed] [Google Scholar]
- 14.Drucker DJ. The biology of incretin hormones. Cell Metab. 2006;3:153–165. doi: 10.1016/j.cmet.2006.01.004. [DOI] [PubMed] [Google Scholar]
- 15.Batterham RL, Cowley MA, Small CJ, et al. Gut hormone PYY(3–36) physiologically inhibits food intake. Nature. 2002;418:650–654. doi: 10.1038/nature00887. [DOI] [PubMed] [Google Scholar]
- 16.Moran TH. Gut peptides in the control of food intake. Int J Obes (Lond) 2009;33(Suppl 1):S7–10. doi: 10.1038/ijo.2009.9. [DOI] [PubMed] [Google Scholar]
- 17.Reeves PG, Nielsen FH, Fahey GC., Jr AIN-93 purified diets for laboratory rodents: final report of the American Institute of Nutrition ad hoc writing committee on the reformulation of the AIN-76A rodent diet. J Nutr. 1993;123:1939–1951. doi: 10.1093/jn/123.11.1939. [DOI] [PubMed] [Google Scholar]
- 18.Taicher GZ, Tinsley FC, Reiderman A, Heiman ML. Quantitative magnetic resonance (QMR) method for bone and whole-body-composition analysis. Anal Bioanal Chem. 2003;377:990–1002. doi: 10.1007/s00216-003-2224-3. [DOI] [PubMed] [Google Scholar]
- 19.Kleiber M. The Fire of Life: An Introduction to Animal Energetics. Wiley & Sons; New York: 1961. [Google Scholar]
- 20.de Lima Toccafondo Vieira M, Duarte RF, Campos LM, Nunan Ede A. Comparison of the estrogenic potencies of standardized soy extracts by immature rat uterotrophic bioassay. Phytomedicine. 2008;15:31–37. doi: 10.1016/j.phymed.2007.06.006. [DOI] [PubMed] [Google Scholar]
- 21.Butera PC. Estradiol and the control of food intake. Physiol Behav. 2010;99:175–180. doi: 10.1016/j.physbeh.2009.06.010. [DOI] [PMC free article] [PubMed] [Google Scholar]
- 22.Bowen J, Noakes M, Clifton PM. Appetite regulatory hormone responses to various dietary proteins differ by body mass index status despite similar reductions in ad libitum energy intake. J Clin Endocrinol Metab. 2006;91:2913–2919. doi: 10.1210/jc.2006-0609. [DOI] [PubMed] [Google Scholar]
- 23.Astbury NM, Stevenson EJ, Morris P, Taylor MA, Macdonald IA. Dose- response effect of a whey protein preload on within-day energy intake in lean subjects. Br J Nutr. 2010;104:1858–1867. doi: 10.1017/S000711451000293X. [DOI] [PubMed] [Google Scholar]
- 24.Burton-Freeman BM. Glycomacropeptide (GMP) is not critical to whey- induced satiety, but may have a unique role in energy intake regulation through cholecystokinin (CCK) Physiol Behav. 2008;93:379–387. doi: 10.1016/j.physbeh.2007.09.010. [DOI] [PubMed] [Google Scholar]
- 25.Akhavan T, Luhovyy BL, Anderson GH. Effect of drinking compared with eating sugars or whey protein on short-term appetite and food intake. Int J Obes (Lond) 2010 doi: 10.1038/ijo.2010.163. e-pub ahead of print 24 August 2010. [DOI] [PubMed] [Google Scholar]
- 26.Pal S, Ellis V. The acute effects of four protein meals on insulin, glucose, appetite and energy intake in lean men. Br J Nutr. 2010;104:1241–1248. doi: 10.1017/S0007114510001911. [DOI] [PubMed] [Google Scholar]
- 27.Veldhorst MA, Nieuwenhuizen AG, Hochstenbach-Waelen A, et al. Dose-dependent satiating effect of whey relative to casein or soy. Physiol Behav. 2009;96:675–682. doi: 10.1016/j.physbeh.2009.01.004. [DOI] [PubMed] [Google Scholar]
- 28.Yu Y, South T, Huang XF. Inter-meal interval is increased in mice fed a high whey, as opposed to soy and gluten, protein diets. Appetite. 2009;52:372–379. doi: 10.1016/j.appet.2008.11.011. [DOI] [PubMed] [Google Scholar]
- 29.Eller LK, Reimer RA. Dairy protein attenuates weight gain in obese rats better than whey or casein alone. Obesity (Silver Spring) 2010;18:704–711. doi: 10.1038/oby.2009.300. [DOI] [PubMed] [Google Scholar]
- 30.Walzem RL, Dillard CJ, German JB. Whey components: millennia of evolution create functionalities for mammalian nutrition: what we know and what we may be overlooking. Crit Rev Food Sci Nutr. 2002;42:353–375. doi: 10.1080/10408690290825574. [DOI] [PubMed] [Google Scholar]
- 31.Yudkoff M, Daikhin Y, Nissim I, et al. Brain amino acid requirements and toxicity: the example of leucine. J Nutr. 2005;135:1531S–1538S. doi: 10.1093/jn/135.6.1531S. [DOI] [PubMed] [Google Scholar]
- 32.Morrison CD, Xi X, White CL, Ye J, Martin RJ. Amino acids inhibit AgRP gene expression via an mTOR-dependent mechanism. Am J Physiol Endocrinol Metab. 2007;293:E165–E171. doi: 10.1152/ajpendo.00675.2006.. [DOI] [PMC free article] [PubMed] [Google Scholar]
- 33.Calbet JA, Holst JJ. Gastric emptying, gastric secretion and enterogastrone response after administration of milk proteins or their peptide hydrolysates in humans. Eur J Nutr. 2004;43:127–139. doi: 10.1007/s00394-004-0448-4. [DOI] [PubMed] [Google Scholar]
- 34.Sandoval DA, Bagnol D, Woods SC, D’Alessio DA, Seeley RJ. Arcuate glucagon-like peptide 1 receptors regulate glucose homeostasis but not food intake. Diabetes. 2008;57:2046–2054. doi: 10.2337/db07-1824. [DOI] [PMC free article] [PubMed] [Google Scholar]
- 35.Veldhorst MA, Nieuwenhuizen AG, Hochstenbach-Waelen A, et al. Effects of complete whey-protein breakfasts versus whey without GMP-breakfasts on energy intake and satiety. Appetite. 2009;52:388–395. doi: 10.1016/j.appet.2008.11.014. [DOI] [PubMed] [Google Scholar]
- 36.Pannacciulli N, Bunt JC, Koska J, Bogardus C, Krakoff J. Higher fasting plasma concentrations of glucagon-like peptide 1 are associated with higher resting energy expenditure and fat oxidation rates in humans. Am J Clin Nutr. 2006;84:556–560. doi: 10.1093/ajcn/84.3.556. [DOI] [PubMed] [Google Scholar]
- 37.Lejeune MP, Westerterp KR, Adam TC, Luscombe-Marsh ND, Westerterp- Plantenga MS. Ghrelin and glucagon-like peptide 1 concentrations, 24-h satiety, and energy and substrate metabolism during a high-protein diet and measured in a respiration chamber. Am J Clin Nutr. 2006;83:89–94. doi: 10.1093/ajcn/83.1.89. [DOI] [PubMed] [Google Scholar]