Abstract
The left superior temporal sulcus (STS) has been shown in numerous functional imaging studies to be a critical region for language processing, as it is reliably activated when language comprehension is compared with acoustically matched control conditions. Studies in non‐human primates have demonstrated several subdivisions in the STS, yet the precise region(s) within the STS that are important for language remain unclear, in large part because the presence of draining veins in the sulcus makes it difficult to determine whether neural activity is localized to the dorsal or ventral bank of the sulcus. We used functional MRI to localize language regions, and then acquired several additional sequences in order to account for the impact of vascular factors. A breath‐holding task was used to induce hypercapnia in order to normalize voxel‐wise differences in blood oxygen level‐dependent (BOLD) responsivity, and veins were identified on susceptibility‐weighted and T2*‐weighted BOLD images, and masked out. We found that the precise locations of language areas in individual participants were strongly influenced by vascular factors, but that these vascular effects could be ameliorated by hypercapnic normalization and vein masking. After these corrections were applied, the majority of regions activated by language processing were localized to the dorsal bank of the STS. Hum Brain Mapp 35:4049–4063, 2014. © 2014 Wiley Periodicals, Inc.
Keywords: language, superior temporal sulcus, veins, functional MRI, susceptibility‐weighted imaging, hypercapnic normalization
INTRODUCTION
The neural substrates of language processing have been investigated in many fMRI and PET studies that have contrasted comprehension of sentences or narratives to acoustically matched control conditions such as reversed speech [Crinion et al., 2003; Takeichi et al., 2010], spectrally rotated speech [Awad et al., 2007; Friederici et al., 2010; Scott et al., 2000, 2006; Spitsyna et al., 2006], reversed and rotated speech [Narain et al., 2003; Okada et al., 2010], foreign languages [Mazoyer et al., 1993; Schlosser et al., 1998], or degraded speech with reduced intelligibility [Davis and Johnsrude, 2003; Obleser et al., 2007]. These studies have consistently shown that regions in and around the left superior temporal sulcus (STS) are differentially activated for language comprehension relative to acoustically matched control conditions.
A role for left superior temporal cortex in language processing was first proposed by Wernicke [1874], who postulated that the posterior superior temporal gyrus (STG) stores acoustic images of words, serving as a link to broadly distributed semantic representations [Wernicke, 1886]. However neither Wernicke's cases, nor the vast majority of cases reported in subsequent lesion‐symptom mapping studies [e.g. Bates et al., 2003; Naeser and Hayward, 1978] had sufficiently circumscribed lesions to support precise anatomical localization. Therefore based on imaging studies such as those cited above, many researchers have proposed that it is the STS specifically, rather than the adjacent STG, that plays a critical role in language processing [e.g. Awad et al., 2007; Okada et al., 2010; Scott et al., 2000, 2006; Spitsyna et al., 2006].
Activation of the STS for language processing has not only been consistently reported in group studies, but is also reliably observed in individual participants [Ahmad et al., 2003; Fedorenko et al., 2010]. Our experience in pre‐surgical functional mapping of language areas has shown that comparing language comprehension to an acoustic control condition is a highly reliable method of identifying left temporal language areas, and that these areas are invariably localized to the STS specifically [Wilson and Khan, unpublished observations].
The STS is a deep sulcus and a great deal of cortical tissue is buried within it (Fig. 1a). Studies in non‐human primates have shown that the STS contains numerous subdivisions with distinct cytoarchitectonic properties and connectivity profiles [Jones and Powell, 1970; Seltzer and Pandya, 1978]. It is therefore of great interest to determine the precise location of activations for language processing. In particular, an essential first question is whether these activations are located on the dorsal or ventral bank, or both, of the sulcus (Fig. 1a). The overall goal of the present study was to attempt to address this question.
Figure 1.
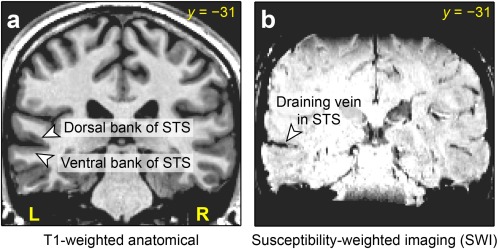
Anatomy of the superior temporal sulcus (STS). (a) The dorsal and ventral banks of the sulcus, shown on a coronal slice of a T1‐weighted structural image. (b) A typical medium‐sized draining vein running through the STS, shown on susceptibility‐weighted imaging (SWI) of the same slice. [Color figure can be viewed in the online issue, which is available at http://wileyonlinelibrary.com.]
Localizing neural activity to one side or the other of a sulcus is surprisingly challenging. With PET, the relatively limited spatial resolution, and the necessity of averaging across participants, have made it impossible to determine which bank of the STS is activated [Scott et al., 2000]. While fMRI has greater spatial resolution and produces robust findings in individual participants, there is another barrier to fine localization: medium‐sized draining veins run through the STS (Fig. 1b). Veins such as these run through all sulci: venules emerge from the gray matter, combining to form pial veins, which form a two‐dimensional network on the folded cortical surface [Duvernoy, 1999]. Veins are particular prominent in sulci, not only because both banks of the sulcus must be drained, but also because veins on the exposed cortical surface are often co‐localized with surface indentations of sulci.
Veins limit the spatial resolution of fMRI because the blood oxygen level‐dependent (BOLD) contrast that is the basis of most fMRI studies is much stronger in draining veins than in gray matter itself [Bandettini and Wong, 1997; Lai et al., 1993; Menon et al., 1993]. BOLD contrast is due to the paramagnetism of deoxyhemoglobin, and is therefore strongly dependent on resting cerebral blood volume (CBV). Voxels that contain draining veins have a much higher resting CBV than those containing gray matter. If veins are large enough or voxels are small enough, voxels may even have 100% blood volume. Therefore attempting to localize neural activity in sulci generally results in activations that are centered on the veins located in the sulci themselves. Because these draining veins are downstream from the location(s) where neural activity is occurring, the BOLD contrast in the veins does not provide precise information about the location of neural activity [Turner, 2002].
There have been two general approaches to reducing the preponderance of macrovascular BOLD signals. The first approach is to use specific acquisition techniques that can reduce macrovascular signal, including spin‐echo imaging [Bandettini et al., 1994], diffusion gradients [Song et al., 1996], or post‐processing methods that combine the phase and magnitude of the signal [Menon, 2002; Rowe and Logan, 2004]. However none of these methods have been more than partially successful in alleviating the problem [Cohen et al., 2004; Menon, 2012; Nencka and Rowe, 2007].
The second approach is to normalize task‐related BOLD signal with respect to a global hypercapnia‐induced BOLD signal, to correct for intrinsic differences between voxels in their capacity to mount a BOLD response [Bandettini and Wong, 1997; Cohen et al., 2004; Handwerker et al., 2007; Murphy et al., 2011; Thomason et al., 2007]. Hypercapnia refers to increased levels of blood CO2. Hypercapnia results in vasodilation and a global increase in cerebral blood flow (CBF) that is not accompanied by a significant increase in cerebral metabolic rate of O2 [Kety and Schmidt, 1948]. This leads to a global BOLD signal increase, as the increased CBF flushes out paramagnetic deoxyhemoglobin from capillaries, venules and veins [Kastrup et al., 1998; Rostrup et al., 1994; Stillman et al., 1995].
Hypercapnia can be induced either by having participants breathe a mixture with a fixed concentration of CO2 (generally 4–7%), or by simply having participants hold their breath. These two techniques quantify cerebrovascular reactivity and BOLD responsivity similarly [Kastrup et al., 2001; Tancredi and Hoge, 2013], and hypercapnic normalization has been effective in studies using either CO2 inhalation [Bandettini and Wong, 1997; Cohen et al., 2004] or breath‐holding [Handwerker et al., 2007; Murphy et al., 2011; Thomason et al., 2007]. Hypercapnic normalization is carried out by dividing task‐related BOLD signal changes by hypercapnia‐induced BOLD signal changes at each voxel, resulting in a relative measure of BOLD signal change that should be insensitive to factors such as CBV, vessel size or vessel orientation [Bandettini and Wong, 1997; Cohen et al., 2004; Handwerker et al., 2007; Murphy et al., 2011; Thomason et al., 2007]. In this study, we used hypercapnic normalization based on a breath‐holding task to correct for voxel‐wise differences in the capacity for a BOLD response.
While this approach has been shown to reduce estimates of signal change in draining veins, and to shift activation foci from veins to cortical areas [Bandettini and Wong, 1997; Cohen et al., 2004], signal from veins is nevertheless still present in the normalized images. Our goal was to more precisely localizing language regions in the STS, therefore we wanted not just to attenuate signal in the veins, but to actually remove it entirely, since it contributes no information regarding whether activations relate to neural activity on the dorsal or ventral bank of the sulcus. Therefore after performing hypercapnic normalization, we also masked out veins as identified on sequences where they are readily visible: susceptibility‐weighted imaging (SWI) [Haacke et al., 2004; Reichenbach et al., 1997], and the T2*‐weighted BOLD images themselves.
Our study had three specific aims. The first was to determine to what extent the specific locations of language regions in individual participants are influenced by vascular factors, especially the presence of draining veins in the STS. The second goal was to investigate the effectiveness of hypercapnic normalization and masking of veins in reducing the impact of vascular factors. The third goal was to determine whether language regions could be localized to the dorsal or ventral bank of the STS after these corrections were applied. We scanned four healthy participants, acquiring anatomical images, high‐resolution BOLD fMRI of a narrative comprehension task to map language regions and a breath‐holding task to induce hypercapnia, and susceptibility‐weighted images to identify veins.
METHODS
Participants
Four healthy participants took part in the study (mean age = 30 years; range = 23–35 years; one female; one left‐hander). No participant reported any history of neurological disorders. All participants gave written informed consent, and the study was approved by the Institutional Review Board at the University of Arizona.
Neuroimaging Protocol
Images were acquired on a Siemens Skyra 3 T scanner with a 32‐channel head coil at the University of Arizona.
For anatomical reference, a T1‐weighted three‐dimensional magnetization‐prepared rapid acquisition gradient echo (MPRAGE) sequence was acquired with the following parameters: 160 sagittal slices; slice thickness = 0.9 mm; field of view = 240 × 240 mm; matrix = 256 × 256; repetition time (TR) = 2300 ms; echo time (TE) = 2.98 ms; flip angle = 9°; GRAPPA acceleration factor = 2; voxel size = 0.94 × 0.94 × 0.90 mm.
Language mapping was carried out with a sparse sampling paradigm. There were two runs. In each run, 41 T2*‐weighted BOLD echo‐planar images were acquired with the following parameters: 29 axial slices aligned with the axis of the temporal lobe; acquired in ascending order; slice thickness = 1.7 mm plus 0.26 mm gap; field of view = 220 × 206.25 mm; matrix = 128 × 120 interpolated with zero filling to 256 × 256; TR = 9,500 ms; acquisition time (TA) = 2,300 ms; TE = 30 ms; flip angle = 90°; GRAPPA acceleration factor = 2; acquired voxel size = 1.72 × 1.72 × 1.96 mm; reconstructed voxel size = 0.86 × 0.86 × 1.96 mm. The difference between the TR and TA was 7,200 ms, so that auditory stimuli could be presented without interference from scanner noise. Note that the field of view included most of the temporal lobe, in particular, we ensured that the Sylvian fissure, STG, STS, and middle temporal gyrus (MTG) were covered in their entirety.
For the hypercapnia study, acquisition parameters were the same as for the language mapping study, except that 128 volumes were acquired, slices were acquired in interleaved order, and the TR was 2,300 ms; there were no silent gaps between volumes. An additional two volumes were acquired initially and discarded to allow for T1 magnetization to reach steady state.
To identify veins, an SWI image was acquired with the following parameters: 80 axial slices; slice thickness = 1.2 mm; field of view = 220 × 192.5 mm; matrix = 384 × 336; TR = 28 ms; TE = 20 ms; flip angle = 15°; GRAPPA acceleration factor = 2; voxel size = 0.57 × 0.57 × 1.20 mm.
Auditory stimuli were presented using insert earphones (S14, Sensimetrics, Malden, MA) padded with foam to attenuate scanner noise and reduce head movement. Visual stimuli were presented on a 24″ MRI‐compatible LCD monitor (BOLDscreen, Cambridge Research Systems, Rochester, UK) positioned at the end of the bore, which participants viewed through a mirror mounted to the head coil. Auditory and visual stimuli were controlled with the Psychophysics Toolbox version 3.0.10 [Brainard, 1997; Pelli, 1997] running under MATLAB R2012b (Mathworks, Natick, MA) on a Lenovo S30 workstation.
Coregistration and Normalization to Standard Space
All images were coregistered to the T1‐weighted anatomical image using SPM5 [Friston et al., 2007]. The anatomical image was segmented into gray matter, white matter and CSF and warped to MNI space using the Unified Segmentation procedure in SPM5. All coregistered images were warped to MNI space using the same parameters and resampled with 1 mm3 isotropic voxels. In general, analyses of the narrative comprehension fMRI, hypercapnia fMRI, and SWI images were carried out in native space as far as possible, then written in MNI space when data needed to be integrated across multiple modalities.
Language Mapping Paradigm
Each participant completed two language mapping runs (Fig. 2a). There were three conditions: listening to a narrative, listening to the same narrative in reverse, and listening to silence. Participants were familiarized with the stimuli before entering the scanner. The backwards narrative was described as “strange sounds that are not language,” and participants were instructed to simply listen to the narrative and to the strange sounds.
Figure 2.
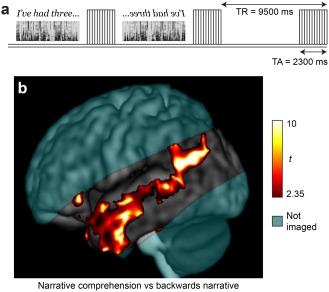
Language localization paradigm. (a) Sparse sampling experimental design. Segments of narrative, segments of backwards narrative, and silence were presented in the silent periods between the acquisition of functional images. See text for details. (b) Group activation map for narrative comprehension versus backwards narrative. Random effects t statistics for four participants; voxel‐wise P < 0.05; cluster size > 5,000 mm3. Coverage was partial, with axial slices aligned to the axis of the temporal lobes; cyan shading indicates areas not included in the field of view.
The narrative was the beginning of an audiobook recording of the novel Hope Was Here by Joan Bauer, read by Jenna Lamua [Bauer, 2004]. The narrative was split into segments at pauses such that each segment was as long as possible up to 7 s (occasionally, slightly longer segments were extracted, then reduced to 7 s by shortening internal pauses). The mean length of the segments was 5,656 ms ± 1,012 (SD) ms. The audio volume was adjusted to a comfortable level for each participant.
Each run comprised 15 segments of narrative, the same 15 segments in reverse, and 10 silences. One initial image was acquired, and then one image was acquired after each stimulus (or silence), for a total of 41 images. As described above, the TR was 9,500 ms and the TA was 2,300 ms, leaving 7,200 ms silence between images. The narrative or backwards narrative segments were centered in these silent intervals, such that the peak of a typical HRF to each segment would coincide with acquisition of the subsequent image. The narrative, backwards narrative, and silence segments were presented in a pseudorandom order, but always arranged in blocks with three narrative segments in a row, three backwards narrative segments in a row, or two silences in a row.
After the scanning session, each participant confirmed that they had heard and comprehended the narrative.
Analysis of Language Mapping Paradigm
The data were first preprocessed with tools from AFNI version 2011‐06‐22 [Cox, 1996]. Head motion was corrected, with six translation and rotation parameters saved for use as covariates, then the data were detrended with a Legendre polynomial of degree 2. No spatial smoothing was performed. Next, independent component analysis (ICA) was performed using the fsl tool melodic version 3.13 [Beckmann and Smith, 2004]. Noise components were manually identified with reference to the criteria of Kelly et al. [2010] and removed using fsl_regfilt.
A general linear model was fit with the program fmrilm from the FMRISTAT package [Worsley et al., 2002]. The six motion parameters were included as covariates, as were time‐series from white matter and CSF regions of interest and three cubic spline temporal trends. No HRF was modeled; instead, each volume was assumed to reflect the BOLD response to neural activity relating to the immediately preceding segment. After coregistration and warping to MNI space, the two runs were combined in a fixed effects model using the FMRISTAT program multistat.
The primary contrast of interest was narrative comprehension versus backwards narrative.
A group analysis was also performed in which each participant's data were smoothed with a Gaussian kernel (FWHM = 8 mm) during preprocessing; all other steps were carried out as just described. Effect size images from the four participants were combined in a random effects model using SPM5.
Hypercapnia Task
Breath‐holds and paced breathing between breath‐holds were cued by a visual display (Fig. 3a). A ball moved along a waveform, cueing the participant to breathe in when it went up, and to breathe out when it went down. The ball stayed in the same horizontal position, with the waveform scrolling across the screen from right to left. The visual display allowed participants to see upcoming breath‐holds, and while they were holding their breath, they were able to see how long it would be before they could resume paced breathing.
Figure 3.
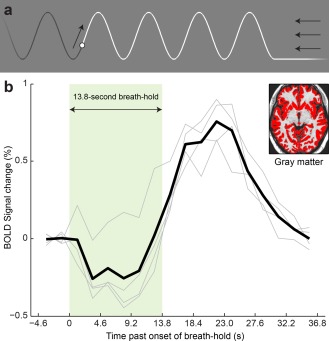
Breath‐holding task to induce hypercapnia. (a) The visual stimulus used to cue breathing and breath‐holds. The ball moved along the waveform, cueing participants to breathe in as it went up, and out as it went down. To indicate a breath‐hold, the ball stayed down (see right‐hand side of figure). The ball stayed in the same horizontal location, with the wave‐form scrolling to the left. The arrows indicate motion of the stimulus, and were not part of the visual display seen by the participants. (b) BOLD signal change to breath‐holds. The mean signal change in segmented gray matter (inset) is shown. Each light gray line shows an individual participant's data, and the heavy black line shows the mean across participants. There was an initial dip followed by a delayed peak. [Color figure can be viewed in the online issue, which is available at http://wileyonlinelibrary.com.]
Paced breathing was cued with a period of 4.6 s (2 TRs), i.e. 13.04 breaths per minute. The run started with 46 s of paced breathing at this rate. Cue‐paced rather than self‐paced breathing was used, because this avoids idiosyncratic breathing patterns before and after breath‐holds, and has been shown to result in stronger and less variable BOLD responses to breath‐holds [Scouten and Schwarzbauer, 2008].
To cue a breath‐hold, the waveform (and the ball) stayed low, thus cueing breath‐holds after exhalation. The beginning of a breath‐hold can be seen on the right of Figure 3a. There were six repetitions of a 13.8‐s breath‐hold (6 TRs), each followed by 27.6 s of paced breathing (6 breaths, 12 TRs). A breath‐hold of 10 or more seconds is sufficient to derive a robust BOLD response [Liu et al., 2002]. Participants were cued to hold their breath after exhalation, rather than after inhalation, because the BOLD response to breath‐holding after inhalation is complicated by a sequence of processes that relate to the inhalation itself [Kastrup et al., 1998; Li et al., 1999; Murphy et al., 2011; Thomason et al., 2005], and because post‐inhalation breath‐holds have been reported to result in more head movement [Handwerker et al., 2007].
Hypercapnic Normalization
The time course of the BOLD response to hypercapnia cannot be estimated simply by convolving a standard HRF with the period of the breath‐hold. The main reason for this is thought to be that blood CO2 concentration increases over the period of the breath‐hold; a better approach is to convolve a sawtooth model of increasing CO2 concentration with an HRF [Murphy et al., 2011].
However in this study we took an empirical approach to estimating the shape of the BOLD response to hypercapnia. After preprocessing as described above, the imaging data were deconvolved relative to the six breath‐holds using fmrilm, in order to estimate the mean shape of the BOLD response to hypercapnia at each voxel. Six motion regressors and three cubic spline temporal trends were included as covariates, and the first 14 volumes were excluded because participants may have been “settling in” and adjusting their breathing to the pacing cues during that time (32.2 s). The deconvolved signal was then averaged across all voxels that had been segmented as gray matter with at least 70% probability in the anatomical image. This mean gray matter signal was then scaled to have a peak of 1, and taken to represent the canonical shape of the BOLD response to breath‐hold in gray matter in each individual. A new explanatory variable was then created by convolving this estimated shape of the BOLD response to breath‐hold with the timing of the six breath‐holds. A second model based on this new variable was then fit to the data with fmrilm, including the same covariates described above, and excluding the first 14 volumes as above. The resulting images showed percent BOLD signal change to breath‐hold in each voxel.
Hypercapnic normalization was performed by dividing voxel‐wise images of language‐related BOLD percent signal change by the images of BOLD percent signal change to breath‐hold, thus expressing task‐related BOLD signal change as a percentage of the BOLD response to breath‐hold, which is expected to normalize for differences between voxels in resting CBV and other vascular factors [Bandettini and Wong, 1997; Cohen et al., 2004; Handwerker et al., 2007; Murphy et al., 2011; Thomason et al., 2007]. This calculation was performed only for voxels where the BOLD signal change to breath‐hold was at least 0.5%. Voxels where the BOLD signal change to breath‐hold was less than 0.5% were masked out, because otherwise the normalized image would contain spurious high values due to low denominators from the breath‐hold signal change image. Note that because of the global gray matter response to hypercapnia, essentially all gray matter voxels had a BOLD signal change to breath‐hold of at least 0.5%, therefore few, if any, genuinely activated voxels were excluded.
Identification and Masking of Veins
Veins were identified quantitatively based on SWI images and T2*‐weighted BOLD images. The BOLD image used was the mean (after motion correction) of the 128 images acquired in the hypercapnia study. Veins appear hypointense on both SWI and BOLD images because of the paramagnetism of deoxygenated hemoglobin.
Potential veins were identified as voxels that were hypointense relative to their neighbors, using the following novel procedure. To derive relative intensity, the SWI and BOLD images were first smoothed with a Gaussian kernel (FWHM = 6 mm), applied only within a brain mask (to avoid spurious low values around the edge of the brain). Next, these smoothed images were subtracted from the original images. The resulting images reflect the intensity of voxels relative to their neighbors. Then a binary map was created to identify voxels where signal in the original images was lower than signal in the smoothed images by at least 12% of the mean signal intensity in the brain. A minimum cluster size was applied of 10 voxels (3.9 mm3) for the SWI images, and 5 voxels (7.2 mm3) for the BOLD images. Finally, the vein maps were warped and resampled to MNI space with 1 mm3 voxels with trilinear interpolation, and binarized at 0.3, which slightly dilated the identified veins. The specific numerical values used in this procedure were chosen by trial and error so as to best identify all visible veins in both types of images while minimizing false positives in gray matter and white matter.
Finally, voxels that were identified as veins on either the SWI or the BOLD images were masked out of the language maps.
Thresholding
The group analysis was thresholded at P < 0.05 (t > 2.35), with a minimum cluster size of 5,000 mm3.
Raw images of BOLD signal change for narrative comprehension versus backwards speech (i.e. before hypercapnic normalization) were divided by the mean of the gray matter response to breath‐holding, so that their units would be at least somewhat comparable to the corrected images that were subsequently calculated. These images were thresholded at 40% of the mean gray matter breath‐hold response, and the contrast was required to be statistically significant at voxel‐wise P < 0.05, with a minimum cluster size of 20 mm3.
Corrected images of BOLD signal change for narrative comprehension versus backwards speech (i.e. after hypercapnic normalization) were thresholded at 40% of the voxel‐wise breath‐hold response, and also at voxel‐wise P < 0.05, with clusters ≥ 20 mm3.
For the purposes of anatomical localization, these images were later thresholded at 80% of the voxel‐wise breath‐hold response, P < 0.05, clusters ≥ 20 mm3, in order to make the manual identification of anatomical locations more tractable.
Note that the minimum cluster sizes applied were not intended to be sufficiently large to properly correct for multiple comparisons. In the group analysis, whole brain statistical significance was not a concern, since activation of the left STS for language comprehension has already been firmly established [e.g. Crinion et al., 2003; Okada et al., 2010; Scott et al., 2000]. In the individual participants' activation maps, almost all activations occurred in the vicinity of the STS, rather than in the other regions included in the field of view, suggesting that most of the activations were true positives. However we were willing to tolerate some likely false positives in order to examine the specific locations of small activations.
RESULTS
A standard group analysis was first carried out, comparing narrative comprehension to backwards speech. This yielded a characteristic activation map with prominent activity in and around the left STS (Fig. 2b). However, fine localization of neural activity is not possible on a group statistical parametric map such as this.
We therefore looked at language activations in each individual participant. Anatomical reference images for each participant are shown in Figure 4a. Activations for the contrast of narrative comprehension to backwards narrative are shown in Figure 4b. All participants showed activations in the left STS as expected. Most of these activations were centered on the sulcus itself; it was not possible to determine whether they reflected activity on the dorsal or ventral bank of the sulcus.
Figure 4.
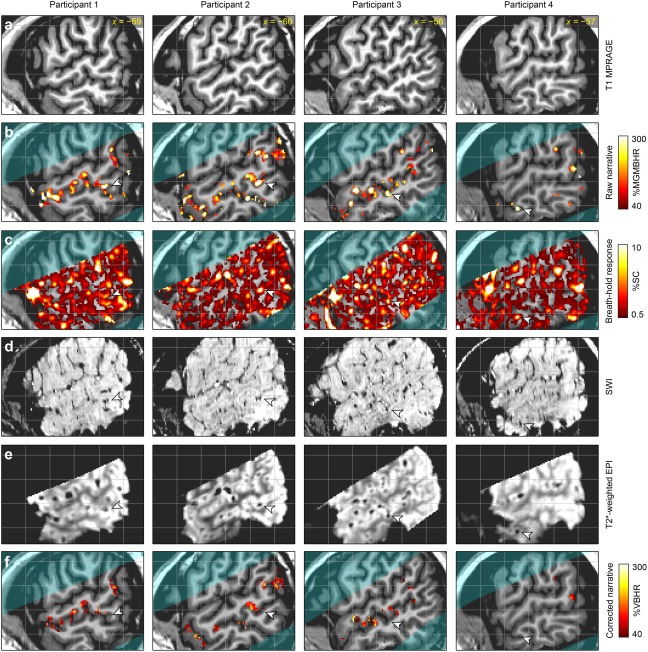
The impact of vascular factors on language localization. The four columns correspond to the four participants, and for each participant, the same slice is shown for each of the six rows. (a) T1‐weighted structural image for anatomical reference. (b) Narrative comprehension versus backwards narrative. This is a “raw” activation map before hypercapnic normalization or vein masking. %MGMBHR: percentage of the mean gray matter breath‐holding response. (c) BOLD response to breath‐holding. %SC: percent signal change. (d) Susceptibility‐weighted imaging (SWI) to identify veins, which are hypointense. (e) BOLD images to identify veins, which are hypointense. (f) Narrative comprehension versus backwards narrative. This is a “corrected” activation map, showing the effect of hypercapnic normalization and vein masking. %VBHR: percentage of voxel‐wise breath‐holding response. The arrowheads show example regions in each participant that were activated in the raw language comprehension contrast image, but showed high BOLD signal change to breath‐holding and visible veins on SWI and BOLD images, and were effectively removed from the corrected language comprehension contrast image.
The breath‐holding task was used to quantify voxel‐wise differences in the capacity to mount a BOLD response. The mean deconvolved BOLD responses to breath‐holding in gray matter in each of the four participants, and the mean response across the four individuals, are shown in Figure 3b. All participants showed similar responses, which peaked after the breath‐hold was complete. In three of the four participants, there was a clear initial dip with an amplitude about one third of the later peak amplitude. These individual responses were used to derive maps of BOLD response to breath‐hold, shown in Figure 4c. As expected, the voxels that were responsive to breath‐hold were predominantly located in gray matter or draining veins, with much stronger responses in draining veins than in gray matter. Comparing Figure 4b,c, it can be seen that many, but not all, of the activations for language comprehension were regions that also showed large BOLD responses for breath‐holding. The arrowheads show one example for each participant of an activation for language comprehension that also showed a strong response to breath‐holding.
SWI and BOLD images of veins are shown in Figure 4d,e, respectively. Most veins were visible in both images, though some were more prominent in one than the other. Many of the regions with the largest signal change to breath‐holding corresponded to draining veins. In particular, the example regions indicated with the arrowheads all reflected visible veins.
Veins were algorithmically identified on SWI and BOLD images (Fig. 5). In the BOLD images but not the SWI images, hypointensities extended into the extravascular space around veins, due to the magnetic field gradient generated by the paramagnetic deoxyhemoglobin. Most veins visible to the eye on SWI and/or BOLD images were successfully identified by the algorithm (e.g. arrowheads in Fig. 5). Some veins were identified in only one of the two modalities. For instance, the vein indicated with the filled arrowhead is visible to the eye on both SWI and BOLD images, but was picked up by the algorithm only on the SWI image. There were numerous false positives in CSF due to its low signal intensity, around the brain due to imperfect masking, and in the globus pallidus due to iron deposition. These false positives were of little concern because functional activation cannot occur in CSF or outside the brain, and the globus pallidus was not a region of interest in this study.
Figure 5.
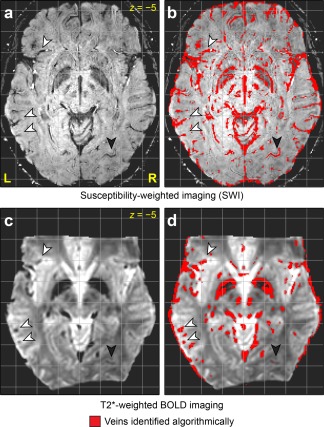
Vein identification algorithm. (a) Susceptibility‐weighted imaging (SWI). (b) Veins identified based on SWI. (c) T2*‐weighted BOLD image. (d) Veins identified based on BOLD image. The arrowheads indicate examples of veins that were successfully identified on both sequences. The filled arrowheads indicate a vein that was identified on SWI but was missed (i.e. a false negative) on BOLD.
The language maps were corrected based on the hypercapnia scan, and veins were masked out. Activation maps after hypercapnic normalization and vein masking are shown in Figure 4f. In general there was much less activation, since many activations were reduced or eliminated due to being co‐localized with veins. In particular, the example activations indicated with arrowheads were all eliminated, since they reflected draining veins. The activations that remained were no longer centered on the sulcus itself, but were now localized to the banks of the sulcus.
To determine the specific locations of language regions, the threshold was raised to 80% of the voxel‐wise breath‐hold response, i.e. voxels were only retained where the BOLD signal change for narrative comprehension relative to backwards speech was at least 80% as large as the BOLD signal change for breath‐holding in that voxel. The threshold was raised so that it would be more tractable to manually characterize the precise anatomical location of each activation. Activations were examined in the STG, the STS including its ascending posterior segment and horizontal posterior segment, the MTG, and the angular gyrus, with a requirement that the center of mass be anterior to MNI y = −65.
The majority of activations were located in these regions of interest (ROIs) (Table 1, Fig. 10). All participants showed a greater number of activations in left hemisphere ROIs (15.3 ± 4.6) than in right hemisphere ROIs (5.3 ± 3.4), and a greater total number of activated voxels in left hemisphere ROIs (863 ± 511) than in right hemisphere ROIs (221 ± 205). The activations that fell outside of left or right hemisphere ROIs were generally smaller, and many likely represented false positives, except for some ventral temporal activations that were not examined further.
Table 1.
Activations for language comprehension
| Participant | ||||
|---|---|---|---|---|
| 1 | 2 | 3 | 4 | |
| Clusters in left hemisphere ROIs | 20 | 18 | 13 | 10 |
| Voxels in left hemisphere ROIs | 1135 | 1438 | 541 | 338 |
| Clusters in right hemisphere ROIs | 10 | 5 | 4 | 2 |
| Voxels in right hemisphere ROIs | 516 | 204 | 87 | 75 |
| Clusters elsewhere | 24 | 17 | 5 | 15 |
| Voxels elsewhere | 903 | 522 | 175 | 388 |
| Clusters in dorsal bank of STS | 10 | 4 | 4 | 3 |
| Voxels in dorsal bank of STS | 722 | 717 | 223 | 163 |
| Clusters in ventral bank of STS | 1 | 3 | 3 | 1 |
| Voxels in ventral bank of STS | 28 | 98 | 97 | 21 |
Figure 10.
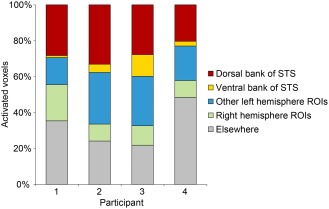
Distribution of locations of activated voxels. Note that “Other left hemisphere ROIs” includes voxels in the STG, MTG and angular gyrus, as well as some voxels located in the STS (activations in the fundus, activations where the bank could not be determined, and activations in the horizontal posterior segment).
All of the activated regions in left hemisphere ROIs for each of the four participants are characterized in Figures 6 to 9. More activations were located in the dorsal bank of the STS, including the anterior bank of its ascending posterior segment (5.3 ± 3.2 clusters) than in the ventral bank of the STS, including the posterior bank of the ascending posterior segment (2.0 ± 1.2 clusters). The total number of activated voxels was larger in dorsal bank activations (456 ± 305 voxels) than in ventral bank activations (61 ± 42 voxels) (Table 1, Fig. 10). All activations in the STS larger than 100 mm3 were located in the dorsal bank, and none were located in the ventral bank. For the purpose of these comparisons, activations located in the fundus of the sulcus or those where the bank was unclear were not counted. Also not counted were activations located in the horizontal posterior segment of the STS, because it is essentially a different sulcus; language‐related activations typically follow the ascending posterior segment.
Figure 6.
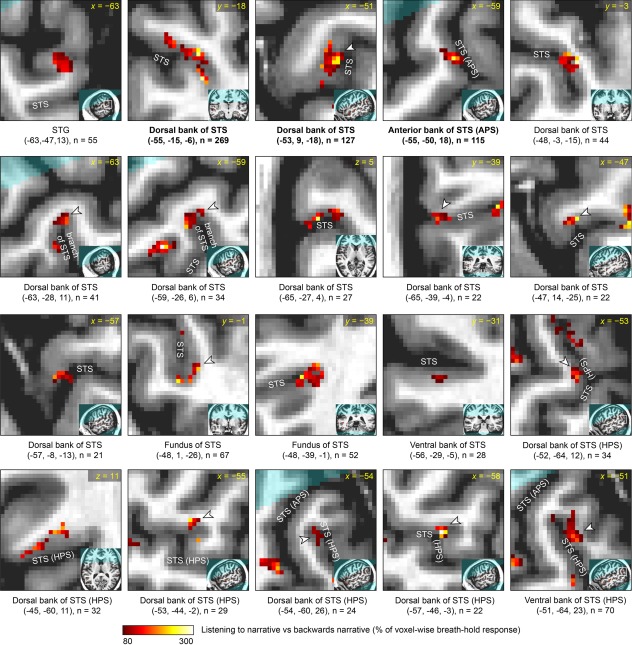
Detailed characterization of corrected narrative comprehension activation data in participant 1. Each panel focuses on a single activation, which is shown in the center of the zoomed image and indicated with an arrowhead unless it is the only activation visible. The broader location of the zoomed image is shown in the inset. Beneath each panel, the MNI coordinates of the center of mass are shown, along with the size of the cluster. All activations in left temporal regions of interest are shown. The regions are presented in the following order, which essentially reflects distance from primary auditory cortex: (1) superior temporal gyrus (STG) and the anterior part of the angular gyrus that is contiguous with the STG; (2) dorsal bank of superior temporal sulcus (STS) and anterior bank of the ascending posterior segment (APS) of the STS; (3) fundus of STS, including its APS; (4) activations within the STS where the bank is unclear; (5) ventral bank of STS and posterior bank of the APS of the STS; (6) middle temporal gyrus (MTG) and the posterior part of the angular gyrus that is contiguous with the MTG; (7) dorsal bank of the horizontal posterior segment (HPS) of the STS; (8) ventral bank of the HPS of the STS. Within these regions of interest, activations are presented in descending order of cluster extent. Participant 1 was left‐handed, however there was no indication that his language lateralization was abnormal as a consequence of this.
Figure 9.
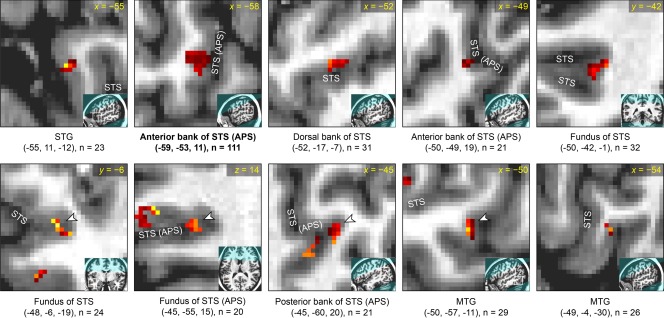
Detailed characterization of corrected narrative comprehension activation data in participant 4. See caption of Figure 6 for details. Participant 4 was female.
Figure 7.
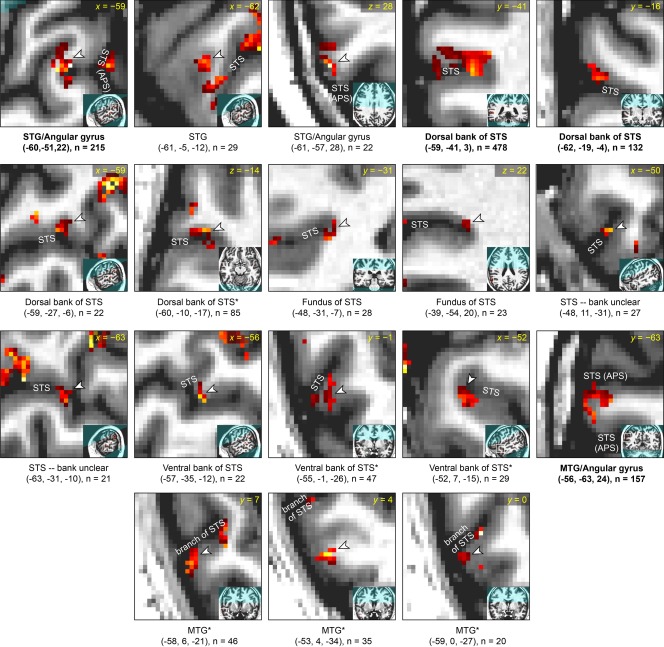
Detailed characterization of corrected narrative comprehension activation data in participant 2. See caption of Figure 6 for details. *Anatomical characterization uncertain due to unusual sulcal anatomy.
Figure 8.
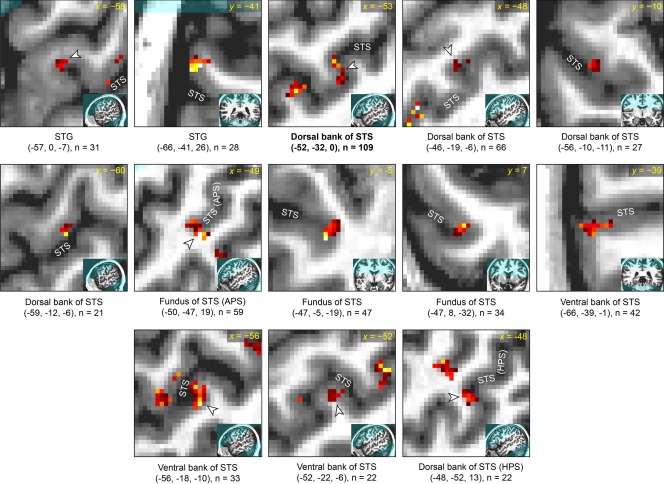
Detailed characterization of corrected narrative comprehension activation data in participant 3. See caption of Figure 6 for details.
DISCUSSION
The results of this study showed that language regions in individual participants, as identified by a narrative comprehension task, are strongly influenced by venous anatomy and voxel‐wise variability in BOLD responsivity. Specifically, many of the activations are co‐localized with draining veins that run through the STS, and thus provide no information as to whether neural activity is localized to the dorsal or ventral bank of the sulcus. We corrected these activation maps by normalizing with respect to a global hypercapnia‐induced BOLD response, and masking out draining veins identified on SWI and BOLD images. We then examined the corrected activations and found that more activations were located on the dorsal bank than the ventral bank of the STS, suggesting that critical temporal lobe language regions are located mostly on the dorsal bank of the STS.
Localization of language regions to the dorsal bank of the STS would be consistent with anatomical findings in non‐human primates. The subdivisions of the STS with connectivity to auditory cortex (TAa) or multimodal connectivity (TPO and the caudal division of PGa) are all located on the dorsal bank of the sulcus [Seltzer and Pandya, 1978]. In contrast, the subdivisions on the ventral bank (TEa, OA, OAa) are connected primarily to visual regions [Seltzer and Pandya, 1978]. Several researchers who have used neuroimaging to identify regions important for language [Crinion et al., 2006] or voice [Belin et al., 2000] processing in the STS have assumed that the relevant regions are located in the dorsal bank. By accounting for the vascular factors that are impediments to precise localization, the current study provides support for this position.
While most language regions were localized to the dorsal bank of the STS, the activations observed for language processing were punctate and their precise locations differed between individuals. These findings are consistent with the results of cortical stimulation mapping studies, which have likewise suggested that areas essential for language are small, have sharp boundaries, and vary in location between individuals [Ojemann et al., 1989]. Cortical stimulation studies have not identified language regions in the STS, since only sites on the cortical surface are amenable to stimulation. Further research is necessary to evaluate the reproducibility of the specificity of the sites activated for language processing in each individual participant.
There are several notable limitations to our study. First and most importantly, even after hypercapnic normalization and vein masking, a considerable fraction of the surviving activated voxels in the corrected images were in the vicinity of veins that had been masked out. Some of these surviving activations may still reflect vascular effects, because the static field inhomogeneities induced by the deoxyhemoglobin in large vessels extend beyond the vessels themselves [Ogawa and Lee, 1990]. The use of BOLD images in addition to SWI images for vein identification mitigated this problem to some extent, because signal loss due to venous deoxyhemoglobin on BOLD images extends beyond the vessels themselves, so masking out the veins identified this way should have masked out some of the problematic extravascular signals. However it remains likely that some of the corrected activations still reflected venous signals. While this is a significant limitation, it does not call into question the finding that the majority of activations were in the dorsal rather than ventral bank of the STS, since any extravascular effects resulting from draining veins running through the STS should be equally observable on either bank of the sulcus.
Second, this study depended on accurate registration of structural images, SWI and BOLD images. While all registrations were manually checked and appeared highly accurate, perfect registration is not possible even in principle due to different spatial distortions in the different imaging modalities. The anatomical localization of activations was performed with reference to the T1‐MPRAGE structural images, and if there were any inaccuracies in the registration of the functional images with these, it could affect the ability to judge which bank of the sulcus an activation lay on.
Third, although breath‐holding was clearly effective for hypercapnic normalization in this study as in several previous studies [Handwerker et al., 2007; Murphy et al., 2011; Thomason et al., 2007], breath‐holding is relatively unconstrained in that participants may differ in the depth and accuracy of their paced breathing and breath‐holds. No participants had any difficulty performing the task outside of the scanner, but respiratory data to quantify breathing patterns were not acquired. It is noteworthy that in three of four participants, an initial decrease in BOLD signal for breath‐holding was observed, followed by a later BOLD signal increase. This is consistent with one study in which signal from a single representative participant was plotted [Handwerker et al., 2007], but not consistent with other previous studies that have reported an initial decrease after post‐inhalation breath‐holds due to a transient increase in intrathoracic pressure resulting in a decrease in CBF after inhalation, but no initial decrease after post‐exhalation breath‐holds [Kastrup et al., 1998; Li et al., 1999; Murphy et al., 2011; Thomason et al., 2005]. The physiological explanation for the observed initial dips is not clear. One possibility is that participants may have performed larger‐than‐normal inhalations on the last inhalations before breath‐holds, which could have transiently increased intrathoracic pressure and decreased CBF. Another source of variability is that there are individual differences in the extent to which arterial CO2 concentration changes due to breath‐holding [Murphy et al., 2011; Sasse et al., 1996]. These various concerns are relatively minor given that the breath‐holding task was used primarily to account for variability between voxels within each participant, rather than to account for variability between participants [Handwerker et al., 2007; Murphy et al., 2011; Thomason et al., 2007], and that individually deconvolved BOLD response functions were used to map voxel‐wise differences in percent signal change to breath‐hold.
Additional research is required to confirm the predominant localization of language regions to the dorsal bank of the STS. One approach would be to use arterial spin labeling (ASL), which maps cerebral blood flow rather than blood oxygenation, and thus localizes signal changes to gray matter rather than veins. However, ASL has much lower signal‐to‐noise ratio than BOLD fMRI, and it is challenging to obtain the same spatial resolution. A second approach could be to apply the approach described in this study to cognitively normal elderly participants with significant atrophy. Since atrophy widens all sulci, there would be physically more space between the dorsal and ventral banks of the STS, which may make it easier to resolve on which bank activated regions are located.
In conclusion, our study showed that individual language maps are strongly influenced by vascular factors, but that this vascular influence can be ameliorated to some extent through hypercapnic normalization and masking of veins. After these corrections were applied, our findings suggest that more language regions in the STS are localized to the dorsal rather than the ventral bank of the sulcus.
ACKNOWLEDGMENTS
The author thanks Scott Squire, Lee Ryan, Pélagie Beeson, and Andrew DeMarco for helpful ideas and discussions, two anonymous reviewers and an associate editor for their constructive comments, and the four volunteers who participated in the study.
REFERENCES
- Ahmad Z, Balsamo LM, Sachs BC, Xu B, Gaillard WD (2003): Auditory comprehension of language in young children: neural networks identified with fMRI. Neurology 60:1598–1605. [DOI] [PubMed] [Google Scholar]
- Awad M, Warren JE, Scott SK, Turkheimer FE, Wise RJS (2007): A common system for the comprehension and production of narrative speech. J Neurosci 27:11455–11464. [DOI] [PMC free article] [PubMed] [Google Scholar]
- Bandettini PA, Wong EC (1997): A hypercapnia‐based normalization method for improved spatial localization of human brain activation with fMRI. NMR Biomed 10:197–203. [DOI] [PubMed] [Google Scholar]
- Bandettini PA, Wong EC, Jesmanowicz A, Hinks RS, Hyde JS (1994): Spin‐echo and gradient‐echo EPI of human brain activation using BOLD contrast: A comparative study at 1.5 T. NMR Biomed 7:12–20. [DOI] [PubMed] [Google Scholar]
- Bates E, Wilson SM, Saygin AP, Dick F, Sereno MI, Knight RT, Dronkers NF (2003): Voxel‐based lesion‐symptom mapping. Nat Neurosci 6:448–450. [DOI] [PubMed] [Google Scholar]
- Bauer J. 2004. Hope Was Here [compact disc]. Lamua J, reader. New York: Random House/Listening Library. [Google Scholar]
- Beckmann CF, Smith SM (2004): Probabilistic independent component analysis for functional magnetic resonance imaging. IEEE Trans Med Imaging 23:137–152. [DOI] [PubMed] [Google Scholar]
- Belin P, Zatorre RJ, Lafaille P, Ahad P, Pike B (2000): Voice‐selective areas in human auditory cortex. Nature 403:309–312. [DOI] [PubMed] [Google Scholar]
- Brainard DH (1997): The psychophysics toolbox. Spat Vis 10:433–436. [PubMed] [Google Scholar]
- Cohen ER, Rostrup E, Sidaros K, Lund TE, Paulson OB, Ugurbil K, Kim S‐G (2004): Hypercapnic normalization of BOLD fMRI: Comparison across field strengths and pulse sequences. Neuroimage 23:613–624. [DOI] [PubMed] [Google Scholar]
- Cox RW (1996): AFNI: Software for analysis and visualization of functional magnetic resonance neuroimages. Comput Biomed Res 29:162–173. [DOI] [PubMed] [Google Scholar]
- Crinion JT, Lambon‐Ralph MA, Warburton EA, Howard D, Wise RJS (2003): Temporal lobe regions engaged during normal speech comprehension. Brain 126:1193–1201. [DOI] [PubMed] [Google Scholar]
- Crinion JT, Warburton EA, Lambon‐Ralph MA, Howard D, Wise RJS (2006): Listening to narrative speech after aphasic stroke: the role of the left anterior temporal lobe. Cereb Cortex 16:1116–1125. [DOI] [PubMed] [Google Scholar]
- Davis MH, Johnsrude IS (2003): Hierarchical processing in spoken language comprehension. J Neurosci 23:3423–3431. [DOI] [PMC free article] [PubMed] [Google Scholar]
- Duvernoy HM. 1999. The Human Brain: Surface, Blood Supply, and Three‐Dimensional Sectional Anatomy, 2nd ed Vienna: Springer‐Verlag. [Google Scholar]
- Fedorenko E, Hsieh P‐J, Nieto‐Castañón A, Whitfield‐Gabrieli S, Kanwisher N (2010): New method for fMRI investigations of language: defining ROIs functionally in individual subjects. J Neurophysiol 104:1177–1194. [DOI] [PMC free article] [PubMed] [Google Scholar]
- Friederici AD, Kotz SA, Scott SK, Obleser J (2010): Disentangling syntax and intelligibility in auditory language comprehension. Hum Brain Mapp 31:448–457. [DOI] [PMC free article] [PubMed] [Google Scholar]
- Friston KJ. 2007. Statistical Parametric Mapping the Analysis of Functional Brain Images. Amsterdam: Elsevier/Academic Press. [Google Scholar]
- Haacke EM, Xu Y, Cheng Y‐CN, Reichenbach JR (2004): Susceptibility weighted imaging (SWI). Magn Reson Med 52:612–618. [DOI] [PubMed] [Google Scholar]
- Handwerker DA, Gazzaley A, Inglis BA, D'Esposito M (2007): Reducing vascular variability of fMRI data across aging populations using a breathholding task. Hum Brain Mapp 28:846–859. [DOI] [PMC free article] [PubMed] [Google Scholar]
- Jones EG, Powell TP (1970): An anatomical study of converging sensory pathways within the cerebral cortex of the monkey. Brain 93:793–820. [DOI] [PubMed] [Google Scholar]
- Kastrup A, Krüger G, Neumann‐Haefelin T, Moseley ME (2001): Assessment of cerebrovascular reactivity with functional magnetic resonance imaging: Comparison of CO2 and breath holding. Magn Reson Imaging 19:13–20. [DOI] [PubMed] [Google Scholar]
- Kastrup A, Li T‐Q, Takahashi A, Glover GH, Moseley ME (1998): Functional magnetic resonance imaging of regional cerebral blood oxygenation changes during breath holding. Stroke 29:2641–2645. [DOI] [PubMed] [Google Scholar]
- Kelly RE Jr, Alexopoulos GS, Wang Z, Gunning FM, Murphy CF, Morimoto SS, Kanellopoulos D, Jia Z, Lim KO, Hoptman MJ (2010): Visual inspection of independent components: Defining a procedure for artifact removal from fMRI data. J Neurosci Methods 189:233–245. [DOI] [PMC free article] [PubMed] [Google Scholar]
- Kety SS, Schmidt CF (1948): The effects of altered arterial tensions of carbon dioxide and oxygen on cerebral blood flow and cerebral oxygen consumption of normal young men. J Clin Invest 27:484–492. [DOI] [PMC free article] [PubMed] [Google Scholar]
- Lai S, Hopkins AL, Haacke EM, Li D, Wasserman BA, Buckley P, Friedman L, Meltzer H, Hedera P, Friedland R (1993): Identification of vascular structures as a major source of signal contrast in high resolution 2D and 3D functional activation imaging of the motor cortex at 1.5T: Preliminary results. Magn Reson Med 30:387–392. [DOI] [PubMed] [Google Scholar]
- Li TQ, Kastrup A, Takahashi AM, Moseley ME (1999): Functional MRI of human brain during breath holding by BOLD and FAIR techniques. Neuroimage 9:243–249. [DOI] [PubMed] [Google Scholar]
- Mazoyer BM, Tzourio N, Frak V, Syrota A, Murayama N, Levrier O, Salamon G, Dehaene S, Cohen L, Mehler J (1993): The cortical representation of speech. J Cogn Neurosci 5:467–479. [DOI] [PubMed] [Google Scholar]
- Menon RS (2002): Postacquisition suppression of large‐vessel BOLD signals in high‐resolution fMRI. Magn Reson Med 47:1–9. [DOI] [PubMed] [Google Scholar]
- Menon RS (2012): The great brain versus vein debate. Neuroimage 62:970–974. [DOI] [PubMed] [Google Scholar]
- Menon RS, Ogawa S, Tank DW, Uğurbil K (1993): 4 Tesla gradient recalled echo characteristics of photic stimulation‐induced signal changes in the human primary visual cortex. Magn Reson Med 30:380–386. [DOI] [PubMed] [Google Scholar]
- Murphy K, Harris AD, Wise RG (2011): Robustly measuring vascular reactivity differences with breath‐hold: Normalising stimulus‐evoked and resting state BOLD fMRI data. Neuroimage 54:369–379. [DOI] [PubMed] [Google Scholar]
- Naeser MA, Hayward RW (1978): Lesion localization in aphasia with cranial computed tomography and the Boston Diagnostic Aphasia Exam. Neurology 28:545–551. [DOI] [PubMed] [Google Scholar]
- Narain C, Scott SK, Wise RJS, Rosen S, Leff A, Iversen SD, Matthews PM (2003): Defining a left‐lateralized response specific to intelligible speech using fMRI. Cereb Cortex 13:1362–1368. [DOI] [PubMed] [Google Scholar]
- Nencka AS, Rowe DB (2007): Reducing the unwanted draining vein BOLD contribution in fMRI with statistical post‐processing methods. Neuroimage 37:177–188. [DOI] [PubMed] [Google Scholar]
- Obleser J, Wise RJS, Alex Dresner M, Scott SK (2007): Functional integration across brain regions improves speech perception under adverse listening conditions. J Neurosci 27:2283–2289. [DOI] [PMC free article] [PubMed] [Google Scholar]
- Ogawa S, Lee TM (1990): Magnetic resonance imaging of blood vessels at high fields: In vivo and in vitro measurements and image simulation. Magn Reson Med 16:9–18. [DOI] [PubMed] [Google Scholar]
- Ojemann G, Ojemann J, Lettich E, Berger M (1989): Cortical language localization in left, dominant hemisphere. J Neurosurg 71:316–326. [DOI] [PubMed] [Google Scholar]
- Okada K, Rong F, Venezia J, Matchin W, Hsieh I‐H, Saberi K, Serences JT, Hickok G (2010): Hierarchical organization of human auditory cortex: Evidence from acoustic invariance in the response to intelligible speech. Cereb Cortex 20:2486–2495. [DOI] [PMC free article] [PubMed] [Google Scholar]
- Pelli DG (1997): The VideoToolbox software for visual psychophysics: Transforming numbers into movies. Spat Vis 10:437–442. [PubMed] [Google Scholar]
- Reichenbach JR, Venkatesan R, Schillinger DJ, Kido DK, Haacke EM (1997): Small vessels in the human brain: MR venography with deoxyhemoglobin as an intrinsic contrast agent. Radiology 204:272–277. [DOI] [PubMed] [Google Scholar]
- Rostrup E, Larsson HB, Toft PB, Garde K, Thomsen C, Ring P, Søndergaard L, Henriksen O (1994): Functional MRI of CO2 induced increase in cerebral perfusion. NMR Biomed 7:29–34. [DOI] [PubMed] [Google Scholar]
- Rowe DB, Logan BR (2004): A complex way to compute fMRI activation. Neuroimage 23:1078–1092. [DOI] [PubMed] [Google Scholar]
- Sasse SA, Berry RB, Nguyen TK, Light RW, Mahutte CK (1996): Arterial blood gas changes during breath‐holding from functional residual capacity. Chest 110:958–964. [DOI] [PubMed] [Google Scholar]
- Schlosser MJ, Aoyagi N, Fulbright RK, Gore JC, McCarthy G (1998): Functional MRI studies of auditory comprehension. Hum Brain Mapp 6:1–13. [DOI] [PMC free article] [PubMed] [Google Scholar]
- Scott SK, Blank CC, Rosen S, Wise RJ (2000): Identification of a pathway for intelligible speech in the left temporal lobe. Brain 123:2400–2406. [DOI] [PMC free article] [PubMed] [Google Scholar]
- Scott SK, Rosen S, Lang H, Wise RJS (2006): Neural correlates of intelligibility in speech investigated with noise vocoded speech—A positron emission tomography study. J Acoust Soc Am 120:1075–1083. [DOI] [PubMed] [Google Scholar]
- Scouten A, Schwarzbauer C (2008): Paced respiration with end‐expiration technique offers superior BOLD signal repeatability for breath‐hold studies. NeuroImage 43:250–257. [DOI] [PubMed] [Google Scholar]
- Seltzer B, Pandya DN (1978): Afferent cortical connections and architectonics of the superior temporal sulcus and surrounding cortex in the rhesus monkey. Brain Res 149:1–24. [DOI] [PubMed] [Google Scholar]
- Song AW, Wong EC, Tan SG, Hyde JS (1996): Diffusion weighted fMRI at 1.5 T. Magn Reson Med 35:155–158. [DOI] [PubMed] [Google Scholar]
- Spitsyna G, Warren JE, Scott SK, Turkheimer FE, Wise RJS (2006): Converging language streams in the human temporal lobe. J Neurosci 26:7328–7336. [DOI] [PMC free article] [PubMed] [Google Scholar]
- Stillman AE, Hu X, Jerosch‐Herold M (1995): Functional MRI of brain during breath holding at 4 T. Magn Reson Imaging 13:893–897. [DOI] [PubMed] [Google Scholar]
- Takeichi H, Koyama S, Terao A, Takeuchi F, Toyosawa Y, Murohashi H (2010): Comprehension of degraded speech sounds with m‐sequence modulation: an fMRI study. Neuroimage 49:2697–2706. [DOI] [PubMed] [Google Scholar]
- Tancredi FB, Hoge RD (2013): Comparison of cerebral vascular reactivity measures obtained using breath‐holding and CO2 inhalation. J Cereb Blood Flow Metab 33:1066–1074. [DOI] [PMC free article] [PubMed] [Google Scholar]
- Thomason ME, Burrows BE, Gabrieli JDE, Glover GH (2005): Breath holding reveals differences in fMRI BOLD signal in children and adults. Neuroimage 25:824–837. [DOI] [PubMed] [Google Scholar]
- Thomason ME, Foland LC, Glover GH (2007): Calibration of BOLD fMRI using breath holding reduces group variance during a cognitive task. Hum Brain Mapp 28:59–68. [DOI] [PMC free article] [PubMed] [Google Scholar]
- Turner R (2002): How much cortex can a vein drain? Downstream dilution of activation‐related cerebral blood oxygenation changes. Neuroimage 16:1062–1067. [DOI] [PubMed] [Google Scholar]
- Wernicke C. 1874. Der aphasische Symptomenkomplex: Eine psychologische Studie auf anatomischer Basis. Breslau: Cohn und Weigert; p 72. [Google Scholar]
- Wernicke C (1886): Einige neuere arbeiten uber Aphasie. Fortschritte der Medizin 4:377–463. [Google Scholar]
- Worsley KJ, Liao CH, Aston J, Petre V, Duncan GH, Morales F, Evans AC (2002): A general statistical analysis for fMRI data. Neuroimage 15:1–15. [DOI] [PubMed] [Google Scholar]


