Abstract
Purpose
A feed-forward loop involving lactic acid production may potentially occur during the formation of idiopathic pulmonary fibrosis. To provide evidence for this feed-forward loop, we used acidoCEST MRI to measure the extracellular pH (pHe), while also measuring percent uptake of the contrast agent, lesion size, and the Apparent Diffusion Coefficient (ADC).
Procedures
We developed a respiration-gated version of acidoCEST MRI to improve the measurement of pHe and percent uptake in lesions. We also used T2-weighted MRI to measure lesion volumes and diffusion-weighted MRI to measure ADC.
Results
The longitudinal changes in average pHe and % uptake of the contrast agent was inversely related to reduction in lung lesion volume. The average ADC did not change during the time frame of the study.
Conclusions
The increase in pHe during the reduction in lesion volume indicates a role for lactic acid in the proposed feed-forward loop of IPF.
Keywords: CEST, MRI, pH, idiopathic pulmonary fibrosis
INTRODUCTION
Idiopathic pulmonary fibrosis (IPF) is a severe disease of the lungs that has no known cause and as a result no known cure [1,2]. The median survival rate of a patient diagnosed with IPF is 2.9 years [3]. It is therefore imperative that strong efforts are made to expand current knowledge of IPF, with specific attention focused upon pathways that may promote its progression and may also be targets for therapy.
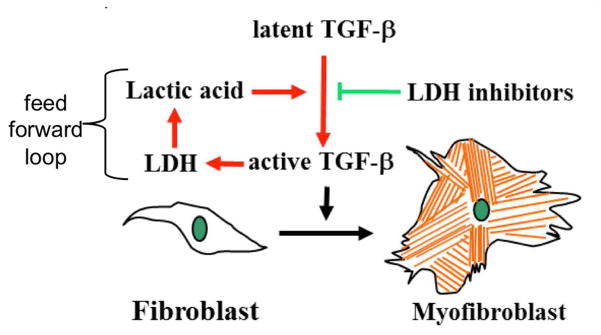
The overexpression of transforming growth factor beta (TGF-β) in IPF induces fibroblast differentiation into myofibroblast cells that form fibrotic scars (Fig. 1a) [4,5]. Recent studies have shown that physiological concentrations of lactic acid can activate the expression of TGF-β, while other studies have shown that TGF-β induces expression of lactate dehydrogenase (LDH) that promotes the production of lactic acid [6]. Therefore, a pro-fibrotic feed forward loop may potentially occur in IPF patients (Fig. 1b). Both TGF-β and LDH are therapeutic targets, because inhibition of one or both of these targets may inhibit this feed forward loop and thereby greatly inhibit the progression of fibrosis in IPF patients.
Figure 1.
A schematic of a proposed feed-forward loop that may drive idiopathic pulmonary fibrosis.
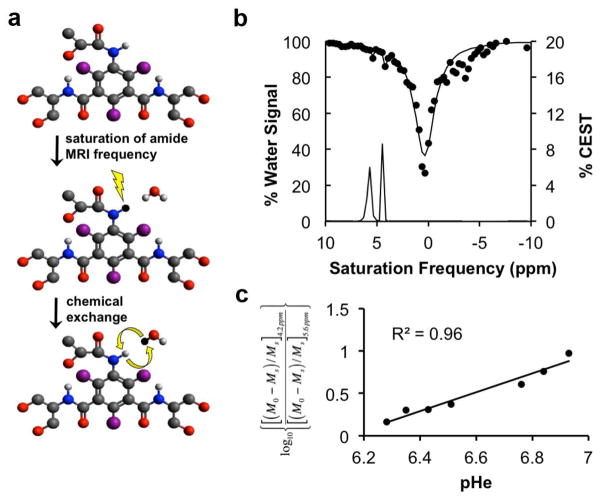
We sought to investigate the hypothesized pro-fibrotic feed forward loop during IPF by correlating extracellular pH of lung lesions with the progression of the fibrotic lesions in mouse models of IPF. More specifically, we hoped to monitor a decrease in extracellular pH of a lesion as the fibrotic lesions grew, or monitor an increase in lesion pHe as the fibrotic lesions decreased in size. To accomplish this goal, we employed a unique molecular imaging method, termed acidoCEST MRI, which measures tissue pHe with outstanding accuracy and excellent precision (Fig. 1c) [7]. This non-invasive imaging method uses chemical exchange saturation transfer (CEST) MRI to detect iopamidol (Isovue™, Bracco Imaging, Inc.), a clinically approved x-ray/CT iodinated contrast agent [8], and is an extension of previous studies with pH-dependent CEST MRI contrast agents [9–11]. This agent possesses two exchangeable amide protons that can each be selectively saturated with a MR radio frequency pulse. This transfer of the saturation to the bulk water magnetization causes a reduced water MR signal, which can be detected by a standard MRI acquisition scheme [12]. A CEST spectrum is then generated by repeating this procedure over an array of MR frequencies to determine the magnitude of the reduced magnetization following selective saturation of each of the labile amide protons [13]. The exchange rates of these labile protons are pH-dependent because chemical exchange of an amide group is base-catalyzed [14]. We have previously shown that a log10 ratio of the CEST effects from two labile protons on the same contrast agent is linearly correlated with pH [15]. Because iopamidol is a highly polar chemical agent, it remains in the extracellular space during the time frame of an MRI study. Therefore, the detection of iopamidol with acidoCEST MRI can measure extracellular pH (pHe).
Although acidoCEST MRI has been successfully used to measure in vivo pHe in solid tumors, kidney, and bladder, measuring pHe in the lung has not yet been attempted [7,16]. MRI of the lung is difficult due to low water density that decreases MR signal amplitudes. Fortunately, fibrotic lung lesions have substantially more water density than normal lung tissues, which greatly facilitates identifying a bright image of a lung lesion within the relatively dark background in a MR image of lung tissue [17]. In addition, the many air-tissue interfaces within the lung causes B1 magnetic field inhomogeneities that affect MRI signal amplitudes; however, we have previously shown that acidoCEST MRI is insensitive to B1 inhomogeneity because this inhomogeneity equally affects two CEST amplitudes from the same agent, and therefore a ratio of the two CEST amplitudes cancels the effects of B1 inhomogeneity [18]. The same air-tissue interfaces within the lung cause B0 magnetic field inhomogeneities that shift the MR frequencies of the amide protons of the agent. We have shown that CEST spectra can be analyzed with Lorentzian line shape fitting methods to compensate for B0 inhomogeneities [18]. Therefore, acidoCEST MRI is well suited for measuring the pHe of lung lesions in an IPF model.
Lung MRI is often confounded by rapid lung motion that blurs the image of the lung and also causes artifact ‘streaks’ across the MR image. Respiration gating has often been successfully used to reduce or eliminate motion artifacts during lung MRI of mouse models [19,20]. The respiration gating is typically implemented by sensing the chest motion of a mouse with a pneumatic pad, and then triggering the MR acquisition soon after the chest motion has stopped. However, CEST MRI protocols require a multi-second period of selective radio frequency pulses prior to the MR acquisition period. If a standard CEST MRI protocol is triggered by respiration gating, then the multi-second CEST saturation period between the gating and MR acquisition will cause the synchrony between gating and acquisition to be lost. For this reason, a CEST MRI protocol must be redesigned to apply a CEST saturation period before respiration gating, so that the gating can properly trigger the MRI acquisition. Therefore, the primary goal of our research study was to design and evaluate the performance of a respiration-gated acidoCEST MRI protocol for measuring lung pHe.
As a second goal of our research study, we then sought to apply our respiration-gated acidoCEST MRI to measure lesion pHe in a mouse model of lung fibrosis. To provide additional evaluations, we also measured the volume of the lung lesions, and measured the uptake of the agent in the lesion to estimate vascular permeability. We finally attempted to assess changes in fibrosis within the lung lesions by measuring the apparent diffusion coefficient (ADC) with standard diffusion-weighted MRI methods. This multiparametric molecular imaging study was designed to investigate the pro-fibrotic feed forward loop of IPF.
MATERIALS AND METHODS
Mouse Model
All in vivo studies were conducted according to approved procedures of the Institutional Animal Care and Use Committee of the University of Arizona. Sixteen male C57BL/6 mice, aged 8–10 weeks old, were administered 1.5 units/kg of bleomycin (Hospira, Lake Forest IL) by oropharyngeal aspiration on Day 0 per standardized protocol [21,22]. Seven mice were imaged on Day 14, 21, and 28, while eight mice were imaged on Day 18, 25, and 32. Each mouse was euthanized after the last imaging scan.
Additional bleomycin-treated mice and PBS-treated controls were euthanized at Day 21. Collagen content was evaluated using Gomori Trichrome staining (Richard Allen brand, Thermo Fisher Scientific Inc., Pittsburgh, PA) using the manufacturer's suggested protocol [22].
Pulse sequence for acidoCEST MRI with respiration gating
Our ungated acidoCEST MRI method uses a saturation period with a fixed duration between 3 and 5 seconds, followed by a FISP MRI acquisition protocol. Respiration gating is typically performed by triggering the start of the pulse sequence soon after the end of exhalation. However, the long duration of the saturation period exceeds the time for one breath, which is typically less than 1.5 seconds at 40 breaths per second. This long saturation period would cause the FISP acquisition to no longer be synchronized with lung position.
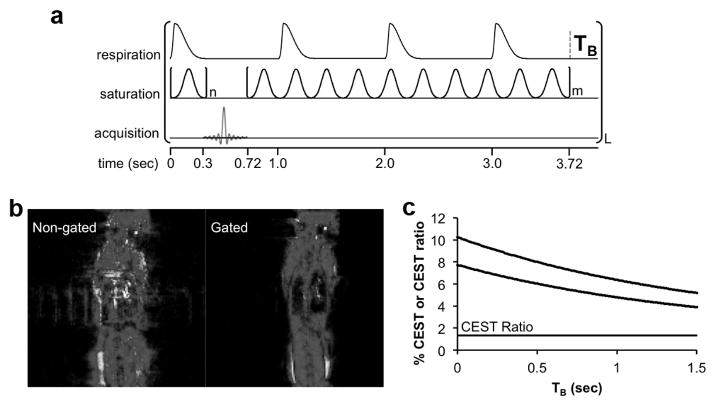
To avoid this problem, we redesigned our acidoCEST MRI method to start with a 300 msec saturation period, then acquire a FISP MR image, and then continue with an additional 3.0 sec saturation period (Fig. 2a). This pulse sequence was triggered at the start of inhalation. Because the inhalation and exhalation occurred within 300 msec, the start of the FISP MR image acquisition occurred when the lungs were relatively motionless. The second CEST saturation period generated steady-state saturation for the next FISP scan. The saturation frequency was incremented at the start of the second saturation period. The first FISP image acquisition was discarded, because only 300 msec of saturation was applied prior to this image acquisition. The subsequent image acquisitions were retained, because a total of 3.3 seconds of saturation was applied at the same frequency prior to each image acquisition.
Figure 2.
Respiration-gated CEST-FISP MRI. a the respiration gated CEST-FISP MRI pulse sequence is triggered to start at initial inspiration. The initial CEST saturation period ends shortly after the end of expiration, followed by the FISP MR acquisition. An additional CEST saturation period at the next saturation frequency is then applied. A variable time TB occurs before the next inspiration triggers the start of the next pulse sequence. b Non-gated vs. gated Images show the improvement in image quality with gating. c Because respiration-gated CEST- FISP MRI has a variable time TB, a simulation of the two CEST effects was performed to show that the % CEST at 4.2 ppm (top line) and % CEST at 5.6 ppm (middle line) both decay during TB, but this decay does not affect the CEST ratio (bottom line) and therefore did not affect pH measurements.
Simulations of CEST with respiration gating
A potential pitfall of our gated acidoCEST MRI method is a delay during the end of the second saturation period and the start of the first saturation period for the next scan. We have labeled this delay as TB, representing the “time for the next breath” after the second saturation period has ended. With a rate 40 breaths per minute, TB ranges from 0 to 1.5 seconds. This delay with no saturation pulse causes a loss of CEST amplitude.
To assess the effect of this potential pitfall on our pH measurement, we simulated the CEST amplitude of iopamidol using the Bloch equations modified for chemical exchange. These simulations used the pulse sequence shown in Figure 2a with TB varied from 0 to 1.5 sec. The simulations used parameters that were obtained by testing 3 solutions of 100 mM iopamidol in PBS buffer at pH values of 6.4, 6.7 and 7.0. CEST spectra of each sample were obtained with a saturation power of 1.73 μT and saturation time of 2 sec, and with a saturation power of 2.45 μT and saturation times of 2 and 4 sec. These spectra were simultaneously fit with Bloch equations modified for chemical exchange because simultaneously fitting multiple CEST spectra has been shown to improve parameter estimations [23,24]. The base catalyzed exchange rate (kb) and the rate of direct exchange with water (k0) were fit using equation [1], assuming that the acid catalyzed exchange rate (ka) is negligible at physiological pH [25]. These base-catalyzed and direct exchange rates were used to estimate the overall chemical exchange rate at pH 6.9, which was a typical pH measured for a lung lesion in our in vivo studies.
| [1] |
In Vivo MRI Studies
To prepare for each MRI study, a mouse was anesthetized with 1.5–2.5% isoflurane gas anesthetic delivered in 1 L/min oxygen gas ventilation, and secured to a mouse cradle. A rectal probe to monitor temperature and a respiration pad to monitor respiration rate were connected to the mouse, and a catheter was inserted into the tail vein to deliver the contrast agent. A bolus of 200 μL iopamidol at 300 mgI/mL concentration was injected i.v. via the catheter. The catheter was connected to an infusion pump, and iopamidol was pumped into the mouse at 150 μL/hr. The mouse was then placed inside the MRI magnet. Core body temperature of the mouse was maintained throughout the imaging experiment at 37.0 ± 0.2°C using an automated feedback loop between the temperature probe and an air heater (SA Instruments, Inc., Stony Brook, NY).
A CEST-FISP MRI protocol was performed for acidoCEST MRI studies. The FISP MR images were acquired using a 3.20 msec TR; 1.60 msec TE; 30° excitation angle; 1.0 mm slice thickness; 453 x 453 μm2 in-plane resolution; 5.80 cm2 field of view; linear encoding; 1 average; 419 msec scan time [7]. Selective saturation with 2.8 μT power, 90 Hz bandwidth, and a 540° flip angle was applied for 3.8 seconds. This sequence was repeated with a series of 54 saturation frequencies to acquire a CEST spectrum. The acidoCEST MRI protocol was repeated for 4 scans at 4:50 minutes per scan, for a total scan time of 19:32 minutes. The images generated from the four CEST-FISP MRI acquisitions were averaged and smoothed with Gaussian filtering. A CEST spectrum was constructed for each pixel, and each spectrum was smoothed with a cubic spline function and then fitted with a sum of three Lorentzian line shapes using Matlab version R2013b (Mathworks, Inc., Natick, MA). Only statistically significant CEST amplitudes greater than 2√2 times the standard deviation of the noise were retained, which represented a 95% probability that the CEST effect was derived from the labile protons and not from noise [26]. The pH of each image pixel was determined from a calibration performed using an identical CEST-FISP MRI protocol that correlated pH with a log10 ratio of the CEST amplitudes of iopamidol (Fig. 3a). Pixels with a significant CEST amplitude at 4.2 ppm but with no significant CEST amplitude at 5.5 ppm had their CEST amplitudes at 5.5 ppm set to 2√2 times the standard deviation of noise, and then were included in the calculation of average pH and standard deviation of pH values. Contrast agent uptake was determined from the number of pixels with one or two significant CEST amplitudes relative to the total number of pixels of the lesion.
Figure 3.
CEST MRI of iopamidol. a Selective saturation of one amide proton of iopamidol causes a loss of coherent net magnetization from the proton (shown as a conversion of the proton from white to black). Subsequent chemical exchange of the proton from iopamidol to water transfers the saturation to the water. Only protons of the three amide groups and water are shown. b An in vivo CEST spectrum of iopamidol in the lung with Lorentzian line shapes fitted to the CEST spectrum. c A calibration plot of iopamidol correlating the a log10 ratio of the two CEST effects with pHe.
A diffusion-weighted MRI protocol was performed to measure the ADC of water in the lesion. Images were acquired with a 1501 msec TR; 27.0 msec TE; 1 mm slice thickness; 469 x 469 μm2 in-plane resolution; 6.0 x 3.0 cm2 field of view; 1 average. Respiratory gating was used, and the total acquisition scan time was 14.5 minutes. The b-values for the diffusion-weighted MRI sequence were 100, 300, and 700 sec/mm2, which provided an excellent fitting to a monoexponential function. The amount of fibrocity in the lesion was qualitatively assessed by determining the isotropic ADC value (based on the average of the three orthogonal directions).
A spin-echo MRI protocol with respiratory gating was performed to measure lesion volumes. The lesion volumes were determined from manually selected regions of interest. Images were acquired with a 1410 msec TR; 10.7 msec TE; 1 mm slice thickness; 10 contiguous slices; 156 x 312 μm2 in-plane resolution; 4.0 cm2 field of view; 1 average. The total acquisition scan time was 4.0 minutes. Lesion volumes were measured by summing the areas of the lesion in each slice using ImageJ [27].
A Students T-test was used to determine significant differences between measurements.
RESULTS
Lung lesions detected with MRI and histopathology
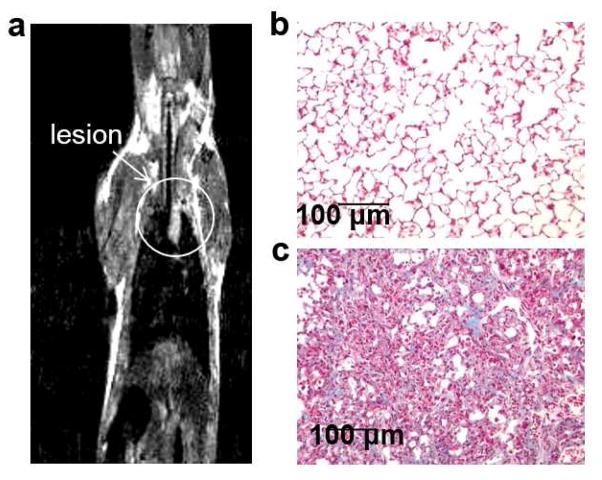
The OA administration of bleomycin often causes a patchy distribution of fibrosis. The spin-density-weighted MR images clearly showed locations of large fibrous patches in the lung as early as 14 days after administering bleomycin (Fig. 4a). The high collagen content of similar lung lesions confirmed the fibrous nature of these patches (Fig. 4c). Collagen deposition was measured by trichrome staining and matched results reported by Caravan et. al. [28]. Healthy lung tissue typically has minimal collagen content (Fig. 4b). Therefore, our acidoCEST MRI studies of lung pH were limited to the patchy lung lesions with high fibrosis.
Figure 4.
Collagen histopathology assay. a A MR image shows the location of the lesion. Histopathology images of b healthy control tissue and c bleomycin treated tissue show a difference in collagen staining.
Pulse sequence for acidoCEST MRI with respiration gating
Our respiration gated acidoCEST MRI pulse sequence was designed to limit motion artifacts induced by lung motion in order to obtain CEST signals that could generate reliable pH values (Fig. 2a). To accomplish this goal, the respiration profile was monitored by placing a pneumatic sensor below the prone mouse. Each breath was estimated to last approximately 200 msec, and the breathing rate was estimated to be 60 to 40 bpm (1.0 to 1.5 seconds per breath) under isoflurane anesthesia, providing a period of 0.8–1.3 seconds with no lung motion. We designed our respiration-triggered CEST MRI pulse sequence to perform the FISP acquisition during this period with no lung motion. Specifically, the CEST-FISP MRI pulse sequence was triggered at the start of the breath, where an initial saturation pulse was applied for 0.3 sec and then FISP MRI acquisition was performed. The 0.3 sec saturation pulse had the additional benefit of recovering CEST contrast that was lost during TB (which is described below). As shown by comparing our respiration-gated pulse sequence to an ungated pulse sequence, the gated pulse sequence clearly reduced motion artifacts (Fig. 2b).
The RF saturation must end at a pre-set time due to the structure of the pulse programming system. The breathing rate is variable, so that the trigger for the next pulse sequence occurs at a variable time after the end of the RF saturation period, known as TB or “time for next breath”. TB did not include RF saturation, which may affect the pH measurement. We simulated the effect of this delay, which showed that the two CEST effects from the amides of iopamidol decrease as TB increases (Fig. 2c). However, a ratio of CEST effects was used to measure pH, and this ratio was found to be invariant with TB. Therefore, the accuracy of the pH measurements was unaffected by TB. The precision of the pH measurements was dependent on the precision of measuring the amplitude of each CEST effect, which was dependent on the % CEST amplitude relative to image noise, which was also represented by Contrast-to-Noise (CNR). Therefore, TB can affect the precision of pH measurements. For this reason, in vivo studies were performed with four repetitions of the MR CEST spectroscopic imaging to improve image CNR.
In vivo acidoCEST MRI
Two amide protons showed selectively detectable CEST effects at 5.5 and 4.2 ppm (Fig. 3b). However, only CEST amplitudes greater than 2√2 times the standard deviation of the noise were used for our pH measurements because these amplitudes represent a 95% probability that the CEST effect is real. Fortunately, many pixels met this criterion due to our image analysis procedure that included Gaussian filtering to maximize the CNR and cubic spline smoothing of the CEST spectrum from each image pixel. These image analysis techniques also facilitated the fitting of Lorentzian line shapes to the experimental CEST spectra for each pixel (Fig. 3c). The in vivo CEST spectrum also showed features at approximately -3 ppm that is caused by a Nuclear Overhauser effect from aliphatic protons, which has also been observed in our previous studies [7]. However, the fitting of Lorentzian line shapes to the CEST peaks at 5.6 and 4.2 ppm and the direct saturation of water at 0 ppm is largely unaffected by the presence of this feature at −3 ppm.
Lung Lesion pHe Maps
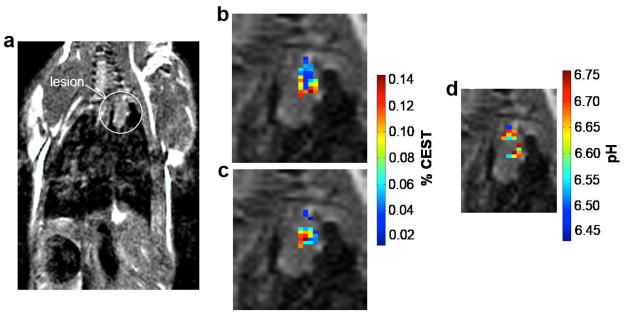
Statistically significant CEST effects at 4.2 and 5.5 ppm were detected in each lesion (Fig. 5b, c). These CEST amplitudes were converted to a pH value using a calibration of a CEST ratio and pH determined using an identical CEST-FISP MRI protocol using phantoms (Fig. 3a). A pixel with only one statistically significant CEST effect at 4.2 ppm had its CEST effect at 5.5 ppm set to 2√2 times the noise. No pixels were observed that had only one statistically significant CEST effect at 5.5 ppm, so that no pixels were classified as being below pH 6.2. The resulting pixelwise pHe maps were overlaid on the anatomical MR images of each lesion (Fig. 5d). The average pHe of the lesion was determined from these pixelwise values. The average and standard deviation of the average lesion pHe were determined for the 7–8 mice scanned on a single day.
Figure 5.
A representative pHe map of a lung lesion. a A spin-echo MR image shows the location of the lung lesion. The % CEST b at 4.2 ppm and c at 5.5 ppm show that statistically significant CEST effects were detected in the lesion. d The ratio of the CEST effects were used to determine pHe.
The percent uptake of the agent in the lesion was determined by comparing the number of pixels that showed one or two CEST effects vs. the total number of pixels that represented the lesion. The percent uptake was used as an indication of vascular permeability in the lesion. This detection of CEST tended to occur in a region of the lesion that was nearest to the lung periphery, which suggested that this region of the lesions have the highest vascular permeability. The average and standard deviation of the average lesion percent uptake were determined for the 7–8 mice scanned on a single day. Similarly, the average and standard deviation of the lesion volumes were determined for the 7–8 mice scanned on a single day.
Lung Lesion ADC Maps
The average value and standard deviation of the distributions of ADC values were calculated from diffusion-weighted MR images for the 7–8 mice scanned on a single day. The region of interest selected for the calculation of the diffusion constants was the same region of interest that was selected for the calculation of pHe.
Longitudinal Assessments of Lung Lesions
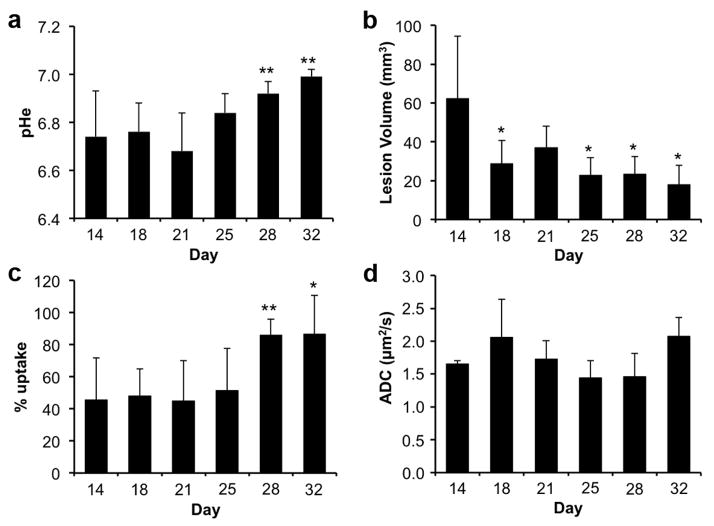
The average pHe at Day 14 was 6.74, suggesting that the lesions had elevated levels of lactic acid. The average pHe showed a steady increase over time, with an increase of 0.25 pH units by the end of the MRI study on Day 32 (Fig. 6a). This small increase in pHe was statistically significant, owing to the remarkable homogeneity in lesion pHe among mice tested on each individual day. The increase in pHe suggested less lactic acid production in the lesion over time. For comparison, the anatomical MR images showed that the average lesion volume steadily decreased during the time frame of the study (Fig. 6b). Statistically significant decreases in lesion size relative to the first day of MR imaging were seen as soon as Day 18, just four days after initiating the MR study. Overall, the decrease in lesion volume was consistent with the increase in lesion pHe.
Figure 6.
Longitudinal assessments of lung lesions. a The average pHe, b average lesion volume, c average % uptake of the agent, and d average ADC value of each group of mice are shown for each day. Error bars represent the standard deviations of the average for each group. Statistically significant differences relative to a measurement on Day 14 are indicated with an asterisk (* p<0.05, ** p< 0.01).
The % uptake of the agent in the lesion showed a steady increase over time, with a statistically significant increase of 41% by the end of the MRI study (Fig. 6c). Notably, the decrease in lesion volume and the % uptake of agent suggests that the fraction of the lesion that had less vascular permeability had greater potential to be removed from the lesion, while the fraction of the lesion that had more vascular permeability remained during the time frame of the study.
The average Apparent Diffusion Constant (ADC) was also measured in the lesions (Fig. 6d). There were no statistical differences in average ADC values of the lesions over time. This result indicated that the degree of fibrocity remained constant as the lesion reduced in volume, or that diffusion-weighted MRI was insufficiently sensitive to monitor a change in fibrocity in the lesion.
DISCUSSION
We have established a novel respiration gated acidoCEST MRI protocol that is able to accurately measure pHe in lung lesions. This protocol relies on the inclusion of a trigger to begin the sequence, followed by a short CEST saturation pulse, FISP acquisition, and then a long CEST saturation pulse. A major benefit of respiration gating is the performance of the FISP acquisition pulse when the mouse is relatively motionless, which greatly reduces motion artifacts that would compromise acidoCEST MRI of pHe in the lung. This respiration gated sequence may also improve future acidoCEST MRI studies on tissues near the lung, such as kidney, liver, and pancreas.
This study combined the measurements of pHe and percent uptake of agent in the lung lesions with acidoCEST MRI, with the lesion volume measured with T2-weighted MRI, and the ADC measured with diffusion-weighted MRI. The ability to measure four biomarkers within one scan session was an efficient evaluation of this lung pathology. Furthermore, combining the measurement of multiple biomarkers in one scan session improved the comparisons of the biomarkers. Importantly, the high quality of these imaging results contributed to creating low standard deviations of the distributions of each of these biomarkers, which led to statistically significant longitudinal changes. Future studies may expand the analysis to cover even more biomarkers, such as including a magnetization transfer MRI protocol (which is similar to a CEST MRI protocol) to monitor longitudinal changes in proteinaceous content of the lesions. Future studies may also utilize H&E staining instead of trichrome staining to provide information regarding collagen deposition in the animal model since it has been shown to be more sensitive to collagen content [28].
Our study supports the proposed feed forward loop in IPF (Figure 1b). The pHe measurements with acidoCEST MRI suggested relatively high lactic acid production in larger lung lesions, and less lactic acid production as the lesions decreased in size. For comparison, a recent study has reported MRI based evidence for bleomycin-induced pulmonary inflammation in a rat model [29]. Despite the challenges of the other study, especially the more limited analysis of regions-of-interest from MR spectroscopy of perfused ex vivo lung tissues relative to our pixelwise analysis of in vivo MRI, both studies show evidence for a decrease in lactic acid production at day 21. Our study monitored an increase in extracellular pH, which is a consequence of low LDH expression and the other study monitored a decrease in LDH expression itself. Therefore both studies may be measuring a combination of fibrosis and inflammation.
Future studies with acidoCEST MRI could assess the relationship between in vivo pHe measurements relative to ex vivo analyses of TGF- expression in the lung lesions. In addition, future studies could assess the early response to chemotherapies directed against IPF. For example, an inhibitor of lactic acid dehydrogenase can reduce lactic acid production, which may reduce or reverse the formation of IPF lesions. In addition, acidoCEST MRI can be translated to the clinic as a method for monitoring the IPF progression and the early therapeutic response of IPF patients.
CONCLUSION
Respiration-gated acidoCEST MRI can measure the pHe in lung lesions of IPF. The average pHe of the lesions was inversely related to lesion size, which supports the proposed feed forward loop in IPF. The lesion volume was also inversely correlated with % uptake, which indicated that the least vascularized portions of the lesions were first removed from the lesion over time. Lastly, no correlation was seen between lesion volume and ADC, indicating that the density of fibrocity in the lesions was unchanged as the lesions decreased in volume.
Table 1.
Exchange rates and ppm offset info for five pools
| Pools | Concentration | ppm offset | Exchange rate |
|---|---|---|---|
| Pool 1 = water | 110 M | 0 | |
| Pool 2 = OH | 80 mM | 0.74 | 1,160 |
| Pool 3 = OH | 20 mM | 1.87 | 1,400 |
| Pool 4 = CEST 1 | 40 mM | 4.24 | 2,380 |
| Pool 5 = CEST 2 | 20 mM | 5.58 | 1,300 |
Acknowledgments
This research is supported by the Better Than Ever Program, R01CA167183-01 and P50 CA95060. KMJ acknowledges support from the NIH Cardiovascular Training Grant T32HL007955, T32HL066988 and the Parker B. Francis Foundation (RMK).
Footnotes
CONFLICT OF INTEREST STATEMENT:
The authors declare that they have no conflict of interest.
References
- 1.Nathan SD, Shlobin OA, Weir N, et al. Long-term course and prognosis of idiopathic pulmonary fibrosis in the new millennium. Chest. 2011;140:221–229. doi: 10.1378/chest.10-2572. [DOI] [PubMed] [Google Scholar]
- 2.Richeldi L. Assessing the treatment effect from multiple trials in idiopathic pulmonary fibrosis. Eur Respir Rev. 2012;21:147–151. doi: 10.1183/09059180.00000912. [DOI] [PMC free article] [PubMed] [Google Scholar]
- 3.Ley B, Collard HR, King TE., Jr Clinical course and prediction of survival in idiopathic pulmonary fibrosis. Am J Respir Crit Care Med. 2011;183:431–440. doi: 10.1164/rccm.201006-0894CI. [DOI] [PubMed] [Google Scholar]
- 4.Sime PJ, Samstrand B, Xing Z, et al. Adenovirus-mediated gene transfer of the proteoglycan biglycan induces fibroblastic responses in the lung. Chest. 1997;111:137S. doi: 10.1378/chest.111.6_supplement.137s. [DOI] [PubMed] [Google Scholar]
- 5.Tarantal AF, Chen H, Shi TT, et al. Overexpression of transforming growth factor-beta1 in fetal monkey lung results in pulmonary fibrosis. Eur Respir J. 2010;36:907–914. doi: 10.1183/09031936.00011810. [DOI] [PMC free article] [PubMed] [Google Scholar]
- 6.Kottmann RM, Kulkami AA, Smolnycki KA, et al. Lactic acid is elevated in idiopathic pulmonary fibrosis and induces myofibroblast differentiation via pH-dependent activation of transforming growth factor-beta. Am J Respir Crit Care Med. 2012;186:740–751. doi: 10.1164/rccm.201201-0084OC. [DOI] [PMC free article] [PubMed] [Google Scholar]
- 7.Chen LQ, Howison CM, Jeffery JJ, et al. Evaluations of extracellular pH within In Vivo Tumors Using acidoCEST MRI. Magn Reson Med. 2013 doi: 10.1002/mrm.25053. Epub ahead of print. [DOI] [PMC free article] [PubMed] [Google Scholar]
- 8.Aime S, Calabi L, Biondi L, et al. Iopamidol: Exploring the potential use of a well-established x ray contrast agent for MRI. Magn Reson Imaging. 2005;53:830–834. doi: 10.1002/mrm.20441. [DOI] [PubMed] [Google Scholar]
- 9.Aime S, Barge A, Delli Castelli D, et al. Paramagnetic Lanthanide(III) complexes as pH-sensitive chemical exchange saturation transfer (CEST) contrast agents for MRI applications. Magn Reson Med. 2002;47:639–48. doi: 10.1002/mrm.10106. [DOI] [PubMed] [Google Scholar]
- 10.Ward KM, Balaban RS. Determination of pH using water protons and chemical exchange dependent saturation transfer (CEST) Magn Reson Med. 2000;44:799–802. doi: 10.1002/1522-2594(200011)44:5<799::aid-mrm18>3.0.co;2-s. [DOI] [PubMed] [Google Scholar]
- 11.Liu G, Li Y, Sheth VR, Pagel MD. Imaging In Vivo Extracellular pH with a Single Paramagnetic Chemical Exchange Saturation Transfer Magnetic Resonance Imaging Contrast Agent. Mol Imaging. 2012;11:47–57. [PMC free article] [PubMed] [Google Scholar]
- 12.Ward KM, Aletras AH, Balaban RS. A new class of contrast agents for MRI based on proton chemical exchange dependent saturation transfer (CEST) Magn Reson Imaging. 2000;143:79–87. doi: 10.1006/jmre.1999.1956. [DOI] [PubMed] [Google Scholar]
- 13.Grad J, Bryant RG. Nuclear magnetic cross-relaxation spectroscopy. JMR. 1990;90:1–8. doi: 10.1002/mrm.1910170216. [DOI] [PubMed] [Google Scholar]
- 14.Liepinsh E, Otting G. Proton Exchange Rates from Amino Acid Side Chains - Implications for Image Contrast. Magn Reson Med. 1996;35:30–42. doi: 10.1002/mrm.1910350106. [DOI] [PubMed] [Google Scholar]
- 15.Sheth VR, Li Y, Chen LQ, et al. Measuring in vivo tumor pHe with CEST-FISP MRI. Magn Reson Med. 2012;67:760–768. doi: 10.1002/mrm.23038. [DOI] [PMC free article] [PubMed] [Google Scholar]
- 16.Longo DL, Busato A, Lanzardo S, et al. Imaging the pH evolution of an acute kidney injury model by means of iopamidol, a MRI-CEST pH-responsive contrast agent. Magn Reson Med. 2013;70:859–864. doi: 10.1002/mrm.24513. [DOI] [PubMed] [Google Scholar]
- 17.Sheth VR, van Heeckeren RC, Wilson AG, et al. Monitoring Infection and Inflammation in Murine Models of Cystic Fibrosis With Magnetic Resonance Imaging. Magn Reson Imaging. 2008;28:527–532. doi: 10.1002/jmri.21440. [DOI] [PMC free article] [PubMed] [Google Scholar]
- 18.Sheth VR, Liu G, Li Y, Pagel MD. Improved pH measurements with a single PARACEST MRI contrast agent. Contrast Media Molecular Imaging. 2012;7:26–34. doi: 10.1002/cmmi.460. [DOI] [PMC free article] [PubMed] [Google Scholar]
- 19.Garbow J, Dugas JP, Conradi MS. Respiratory gating for MRI and MRS in rodents. Third IEEE Symp Bioinform Bioeng. 2003:126–129. [Google Scholar]
- 20.Heijman E, de Graaf W, Niessen P, et al. Comparison between prospective and retrospective triggering for mouse cardiac MRI. NBR. 2007;20:439–447. doi: 10.1002/nbm.1110. [DOI] [PubMed] [Google Scholar]
- 21.Lakatos HF, Burgess HA, Thatcher TH, et al. Oropharyngeal aspiration of a silica suspension produces a superior model of silicosis in the mouse when compared to intratracheal instillation. Exp Lung Res. 2006;32:181–99. doi: 10.1080/01902140600817465. [DOI] [PMC free article] [PubMed] [Google Scholar]
- 22.Kulkarni AA, Thatcher TH, Hsiao HM, et al. The triterpenoid CDDO-Me inhibits bleomycin-induced lung inflammation and fibrosis. PloS one. 2013;8:e63798. doi: 10.1371/journal.pone.0063798. [DOI] [PMC free article] [PubMed] [Google Scholar]
- 23.Woessner DE, Zhang S, Merritt ME, Sherry AD. Numerical solution of the Bloch equations provides insights into the optimum design of PARACEST agents for MRI. Magn Reson Med. 2005;53:790–799. doi: 10.1002/mrm.20408. [DOI] [PubMed] [Google Scholar]
- 24.Randtke EA, Chen LQ, Corrales LR, Pagel MD. The Hanes-Woolf linear QUESP method improves measurements of fast chemical exchange rates with CEST MRI. Magn Reson Med. 2013 doi: 10.1002/mrm.24792. Epub ahead of print. [DOI] [PMC free article] [PubMed] [Google Scholar]
- 25.Gregory RB, Crabo L, Percy AJ, Rosenburg A. Water catalysis of peptide hydrogen isotope exchange. Biochemistry. 1983;22:910–917. doi: 10.1021/bi00273a031. [DOI] [PubMed] [Google Scholar]
- 26.Haacke EM, Brown RW, Thompson MR, Venkatesan R. Magnetic Resonance Imaging Physical Principles and Sequence Design. New York, NY: Wiley-Liss; 1999. p. 349. [Google Scholar]
- 27.Schnieder CA, Rasband WS, Eliceiri KW. NIH Image to ImageJ: 25 years of image analysis. Nature Methods. 2012;9:671–675. doi: 10.1038/nmeth.2089. [DOI] [PMC free article] [PubMed] [Google Scholar]
- 28.Caravan P, Yang Y, Zachariah R, et al. Molecular Magnetic Resonance Imaging of Pulmonary Fibrosis in Mice. Am J Respir Cell Mol Biol. 2013;49:1120–6. doi: 10.1165/rcmb.2013-0039OC. [DOI] [PMC free article] [PubMed] [Google Scholar]
- 29.Shaghaghi H, Kadlecek S, Deshpande C, et al. Metabolic spectroscopy of inflammation in a bleomycin-induced lung injury model using hyperpolarized 1-13C pyruvate. NBM. 2014;27:929–947. doi: 10.1002/nbm.3139. [DOI] [PMC free article] [PubMed] [Google Scholar]


