
Figure 2.
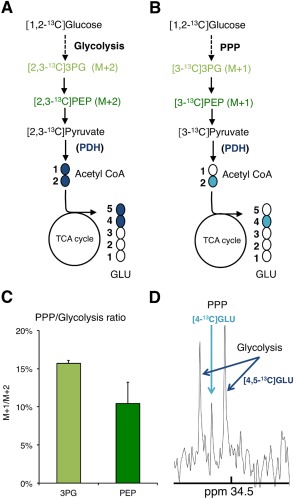
Evidence of pentose phosphate pathway (PPP) activity in mature oligodendrocytes in culture after incubation with [1,2‐13C]glucose. Labelling patterns derived from [1,2‐13C]glucose metabolism via glycolysis (A) and the PPP (B). The % enrichment of 13C in M+1 and M+2 isotopologues for 3PG and PEP was determined using GC–MS analysis of cell extracts after 24‐h incubation with [1,2‐13C]glucose. The ratio shown in (C) between M+1 (labelling from the PPP) and M+2 (labelling from glycolysis) enables to estimate the contribution of the PPP versus glycolysis to the formation of the glycolytic intermediates 3PG and PEP in mature oligodendrocyte (mean ± s.e.m.; n = 3). (D) 13C nuclear magnetic resonance spectrum of a cell extract from cultures incubated in medium containing [1,2‐13C]glucose for 24 h. The C‐4 region of glutamate at 34.5 ppm (GLU) is shown. The doublet peak represents [4,5‐13C]glutamate ([4,5‐13C]GLU) which derives from glucose metabolism via glycolysis only. The singlet peak corresponds to [4‐13C]glutamate ([4‐13C]GLU) which is produced after glucose metabolism via the PPP. Abbreviations: 3PG, 3‐phosphoglycerate; GLU, glutamate; PEP, phosphoenolpyruvate; PDH, pyruvate dehydrogenase; M+1, parent ion with one 13C atom; M+2, parent ion with two 13C atoms. [Color figure can be viewed in the online issue, which is available at wileyonlinelibrary.com.]