

Abstract
Understanding and dissecting the role of different subsets of regulatory tumor-infiltrating T lymphocytes (TILs) in the immunopathogenesis of individual cancer is a challenge for anti-tumor immunotherapy. High levels of γδ regulatory T (Treg) cells have been discovered in the breast TILs. However, the clinical relevance of these intra-tumoral γδ T cells is unknown. In this study, γδ T cell populations were analyzed by performing immunohistochemical staining in primary breast cancer tissues from patients with different stages of cancer progression. Retrospective multivariate analyses of the correlations between γδ T cell levels and other prognostic factors and clinical outcomes were completed. We found that γδ T cell infiltration and accumulation in breast tumor sites was a general feature in breast cancer patients. Intra-tumoral γδ T cell numbers were positively correlated with advanced tumor stages, HER2 expression status and high lymph node metastasis, but inversely correlated with relapse-free survival (RFS) and overall survival (OS) of breast cancer patients. Multivariate and univariate analyses of tumor-infiltrating γδ T cells and other prognostic factors further suggested that intra-tumoral γδ T cells were the most significant independent prognostic factor for assessing severity of breast cancer, compared with the other known factors. Intra-tumoral γδ T cells were positively correlated with FoxP3+ cells and CD4+ T cells, but negatively correlated with CD8+ T cells in breast cancer tissues. These findings suggest that intra-tumoral γδ T cells may serve as a valuable and independent prognostic biomarker, as well as a potential therapeutic target for human breast cancer.
Keywords: γδ T Lymphocytes, Regulatory T cells, Breast tumor microenvironment, Tumor immunity, Clinical outcome
Introduction
Increasing evidence suggests that immunotherapy is a promising approach to treating patients with invasive and metastatic breast cancers (1–3). However, the immunosuppressive microenvironments induced by different types of Treg cells in breast cancer present major barriers to successful anti-tumor immunotherapy (1, 4–6). Emerging studies are showing elevated levels of CD4+CD25+ Treg cells among the total T cell populations isolated from tumor tissues or peripheral blood in patients with various cancers, including breast cancer (4, 7). Importantly, several studies have demonstrated a correlation between intra-tumoral Treg cells and tumor pathogenesis (8–10). Furthermore, more recent studies have also shown that quantification of tumor-infiltrating FoxP3+ Treg cells is a novel marker for identifying high-risk breast cancer patients and is valuable for assessing disease prognosis and progression (7, 11, 12). We recently observed that tumor-infiltrating γδ1 T cells, which exist in the tumor microenvironment of breast cancer patients, had potent suppressive activity toward conventional T cells both in vitro and in vivo (6). Understanding the role of different subsets of regulatory TILs in the immunopathogenesis of individual cancer is critical for anti-tumor immunotherapy (13–16).
γδ T cells serve not only as sentinels in the innate system, but also act as a bridge between innate and adaptive immune responses, performing multiple functions (17–20). There are two major subsets of human γδT cells, Vδ1 and Vγ9Vδ2 T cells. Vδ1 T cells are the predominant subset found at mucosal surfaces and in epithelial tissues (17, 18, 21). Human Vδ1 T cells share certain characteristics with murine γδ intraepithelial lymphocytes (IELs) and may recognize either MHC class I-related chain A or B (MICA or MICB), which are induced on epithelial cells and tumor cells by stress or structural damage (22–25). Vγ9Vδ2 (also known as Vγ2Vδ2) T cells dominate in the peripheral blood and lymph nodes and respond to microbial infections by recognizing small non-peptide molecules (21, 22, 26, 27). The roles of human Vγ9Vδ2 T cells in mediating immunity against microbial pathogens and tumors have been well described (28). Several clinical trials focusing on the activation of Vγ9Vδ2 T cells as a cancer treatment in patients with renal cell carcinoma, non-Hodgkin lymphoma or multiple myeloma and prostate cancer, have shown promising results (29–33). Recent studies from mouse tumor models have demonstrated that γδ T cells within the tumor microenvironment were involved in the induction of tumor-specific immune tolerance (34–36). However, little is known about negative regulation by γδ T cells in human disease, especially in anti-tumor immunity in cancer patients. We recently analyzed cell populations in TILs isolated from human breast tumors and were the first to identify high percentages of γδ1 Treg cells existing in the tumor microenvironment (6). We observed that these breast tumor-derived γδ 1 Treg cells possessed a broad suppressive function that affected CD4+, CD8+ and γδ 2 T cells, and blocked the maturation and activity of dendritic cells (DC) (6). In addition, this new subset of Treg cells has further been confirmed in patients by more recent studies from other groups (37–39). While we observed that suppressive γδ1 T cells were enriched in TILs of breast cancer patients, the function of such Treg cells in the context of tumor immune tolerance and immunopathogenesis is unclear.
In the current study, we performed immunohistochemical staining of γδ T cells in tumor tissues and paired normal breast tissues from patients with different stages of primary breast cancers undergoing surgery, and retrospectively analyzed the correlation between the γδ T cell levels with tumor stages, metastasis characteristics, prognostic factors and clinical outcome of patients. We also analyzed the correlations between γδ T cell levels and other TILs, including CD4+, CD8+, and FoxP3+ T cells. We observed that patients with a high proportion of γδ T cells had advanced cancer stages and high lymph node metastasis. Importantly, high numbers of γδ T cells in breast cancer tissues were correlated with poor survival and high risks of relapse. These data clearly suggest that γδ T cells constitute a dominant population existing in the breast tumor suppressive microenvironment that is significantly and negatively correlated with clinical outcome.
PATIENTS AND METHODS
Patients and samples collection
Tumor samples were obtained from breast cancer patients treated at Saint Louis University Department of Surgery from 2004 to 2010 who have given informed consents for enrollment in a prospective tumor procurement protocol approved by the Saint Louis University Institutional Review Board. Total of 81 tumor tissues from different stages of identified primary breast cancer were collected for this study. Whenever feasible without interfering with histopathologic analysis for ongoing clinical decision making, paired fresh tumor tissues and normal breast tissues were obtained perioperatively and snapped frozen in liquid nitogen (N=46). For patients from whom fresh tissues were not obtained, paraffin blocks of tumor tissues were obtained for analysis (N=35). Patient clinical data were also collected for analysis. In addition, 26 fresh-frozen melanoma tumor tissues (metastatic cutaneous melanoma) were also collected as controls for this study.
Immunohistochemical Staining
The cell populations of γδ, CD4+ and CD8+ T cells, and FoxP3+ cells in cancer and normal tissues were determined using immunohistochemical staining. The frozen or paraffin-embedded sections were stained with a panel of the first specific monoclonal antibodies against human CD4, CD8, TCR- γδ and FoxP3. After washing, sections were incubated with biotin-labeled secondary antibody streptavidin-HRP solutions, following the procedure of the Histostain®-Plus 3rd Gen IHC Detection Kit (Invitrogen, CA). For frozen section staining, the following monoclonal antibodies were used: mouse anti-human γδ TCR (clone B1.1), FoxP3 (clone 236A/E7), CD4 (clone RPA-T4), and CD8 (clone RPA-T8) (eBioscience, San Diego, CA) monoclonal antibodies, at diluted concentrations of 1: 50, 1: 50, 1:100 and 1:100, respectively. For paraffin-embedded tumor sections, the following monoclonal antibodies were used: FoxP3 (clone 236A/E7), CD4 (clone BC/1F6), and CD8 (clone 144B) (Abcam, Boston, MA) monoclonal antibodies at a diluted concentration of 1: 50. Controls were performed by incubating slides with the isotype control antibody instead of primary antibodies, or second antibody alone. Normal breast tissues and tumor tissues from melanoma patients served as controls. The positive cells were counted and analyzed microscopically.
Quantification Method
Expressions of CD4+, CD8+ and γδ T cells, and FoxP3+ cells in tissues were evaluated manually using a computerized image system composed of a Leica ICC50 camera system equipped on a Leica DM750 microscope (North Central Instruments, Minneapolis, MN). Photographs were obtained from 20 randomly selected areas within the tumor tissues of 10 cancer nest areas and 10 cancer stroma areas at a high-power magnification (400 ×). Ten fields (400 ×, magnification) of each tumor tissue section, including both cancer nest and stroma areas were counted and summed, and the means of positive cell numbers per field reported. In addition, the results were further confirmed by directly counting positive cells microscopically. The counting was performed by three independent investigators (C. Ma, J. Ye and F. Wang) who had no previous knowledge of the patient clinical backgrounds, and the results were averaged.
Statistical Analysis
Given that there was no clinically defined cutoff points for the numbers of TILs (CD4+, CD8+, γδ, and FoxP3+ T cells) in the tumor tissues, the median expression of each TIL (9 for γδ T cells, 16 for CD4+ T cells, 12 for FoxP3+ cells, and 13 for CD8+ T cells) in breast cancer tissues was used as a cutoff point to define the TIL-high and TIL-low groups. Pearson’s Chi-square test was used to prospectively analyze the correlations between the cell number of each TIL and clinical features, including age, nodal status, tumor size, tumor stage, estrogen receptor (ER) status, epidermal growth factor receptor 2 (HER2) positivity, relapse-free survival (RFS) and overall survival (OS). OS was determined from the date of surgery to the date of death by any cause or to the date of the last follow-up. RFS was measured as the length of time from surgery to the date of relapse. For all categorical predictors (including the cell numbers dichotomized by medians), the log-rank test was used to perform univariate survival association analyses for OS and RFS. Survival and relapse-free probability and cumulative hazard associated with prognostic factors for OS and RFS were estimated by the Kaplan-Meier method, and hazard ratios were estimated by a Cox proportional hazard regression model. Data processing and statistical analyses were performed using SAS 9.1 and R 2.13.0. Statistical significance was defined when alpha <0.05 (2-tailed).
RESULTS
Prevalence of γδ T cells in situ in breast cancer tissues
We have recently demonstrated that high percentages of γδ1 Treg cells existed in breast TILs (6). This novel finding prompted us to investigate the functional role of tumor-infiltrating γδ T cells in the pathogenesis of human breast cancer. We first determined whether γδ T cells were prevalent in situ in breast tumor sites. Given that the commercially available anti-human γδ TCR antibody was only suitable for frozen sections, we performed immunohistochemical staining to detect γδ T cells in 46-freshly frozen breast cancer sections and patient-paired normal breast tissues (Figure 1A). In normal breast tissues, very few samples had detectable γδ T cells (2 of 46 breast tissues). In contrast, significantly increased numbers of γδ T cells were detected in breast tumor tissues (43 of 46 tumor samples; median, 9; range, 0 to 23) (Figure 1B and Table 1). In addition, we investigated the existence of γδ T cells in melanoma tumor tissues (as a tumor type control). However, γδ T cell numbers in melanoma tissues were much lower than those in breast cancer tissues, consistent with our previous finding that low percentages of γδ T cells exist in melanoma TILs (6) (Figure 1B). These results strongly indicate that γδ T cell development in TILs was a unique feature in breast cancer patients. In parallel experiments, we analyzed the other key TILs, including CD4+, CD8+, and FoxP3+ T cells in 81 tumor (frozen and paraffin-embedded) tissues from different stages of breast cancer (7, 11, 40) (Figure 1A). We found that very high percentages of CD4+ and CD8+ T cells, and FoxP3+ cells also existed in breast cancer tissues compared with those in paired-normal breast tissues (Table 1 and data not shown).
Figure 1. Accumulation of γδ T cells in breast cancer but not in normal breast tissues.
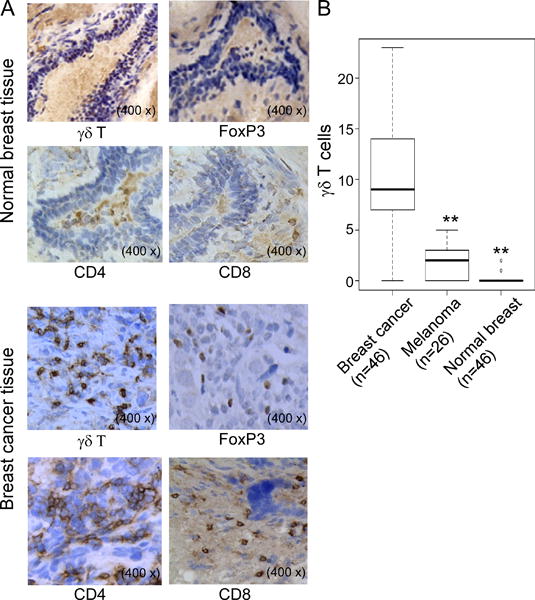
(A) Immunohistochemical staining of γδ, CD4+ and CD8+ T cells, as well as FoxP3+ cells in normal breast and cancer tissues. Few γδ, CD4+ and CD8+ T cells, as well as FoxP3+ cells were observed in normal breast tissues. However, high numbers of γδ, CD4+ and CD8+ T cells, as well as FoxP3+ cells were detected in breast cancer tissues. Frozen or paraffin-embedded tissue sections were immunohistochemically stained to detect the indicated cells. (B) Significantly increased numbers of γδ T cells existed in breast cancer tissues compared with normal breast tissues and melanoma tumor tissues. Frozen sections from breast tumor samples and controls of paired normal breast tissues (n=46) and melanoma tissues (n=26) were immunohistochemically stained to detect γδ T cells. Number of γδ T cells shown is the average numbers per high field (400 ×) in each tissue sample. The median number of γδ T cells in each group is shown as a horizontal line. Significance was determined by paired (breast cancer vs normal breast tissues) or unpaired (breast cancer vs melanoma tissues) T test. **p< 0.01, compared with γδ T cells in the breast cancer tissues.
Table 1.
Comparison of γδ T and FoxP3+ cell positive incidence among normal breast and tumor tissues.
| Samples | γδ T cells
|
FoxP3+ cells
|
||||||
|---|---|---|---|---|---|---|---|---|
| Case | + | − | p | Case | + | − | p | |
| Normal breast | 46 | 2 (4.35%) | 44 (95.65%) | 46 | 7 (15.22%) | 39 (84.78%) | ||
| Breast Tumor | 46 | 43 (93.48%) | 3 (6.52%) | 2.20 × 10⁻¹⁶ | 81 | 79 (97.53%) | 2 (2.47%) | 2.24 × 10⁻¹⁶ |
Note: Evaluated by χ2 test. Abbreviations: FoxP3, forkhead box protein P3.
Correlation of intra-tumoral γδ T cells with clinicopathological parameters of breast cancer patients
To further investigate the clinical significance of γδ T cells in human breast cancer, the cancer clinicopathological factors of breast cancer patients were analyzed relative to the levels of the intra-tumoral γδ T cells. In addition, cancer-specific survival rates for patients were analyzed in correlation with γδ T cells and other immune cells (CD4+, CD8+, FoxP3+ T cells). As shown in Table 2, γδ T cell numbers were positively correlated with higher tumor stages (p=1.19 × 10⁻⁶), positive lymph node status (p=9.94 × 10⁻⁶) and HER2 expression (P=0.002). In contrast, γδ T cell infiltration was inversely correlated with RFS (p=1.27 × 10⁻⁵) and OS (p =3.97 × 10⁻⁶) of breast cancer patients.
Table 2.
Correlations between γδ, CD4+ and CD8+ T, and FoxP3+ cell Expression and Clinicopathologic Characteristics in Breast Cancer Patients.
| γδ T (n=46) | P | FoxP3 (n=81) | P | CD4 (n=81) | P | CD8 (n=81) | P | |||||
|---|---|---|---|---|---|---|---|---|---|---|---|---|
| ≤9 | >9 | ≤12 | >12 | ≤16 | >16 | ≤13 | >13 | |||||
| Age | ||||||||||||
| <60 years | 12 | 11 | 23 | 18 | 23 | 18 | 14 | 25 | ||||
| ≥60 years | 11 | 12 | 0.878 | 21 | 18 | 0.982 | 24 | 15 | 0.789 | 21 | 20 | 0.247 |
|
| ||||||||||||
| Tumor stage | ||||||||||||
| I | 17 | 0 | 24 | 6 | 27 | 3 | 7 | 23 | ||||
| II | 6 | 10 | 18 | 12 | 15 | 15 | 15 | 15 | ||||
| III | 1 | 12 | 1.19×10⁻⁶ | 3 | 18 | 1.69×10⁻⁵ | 6 | 15 | 2.75×10⁻⁵ | 13 | 8 | 0.015 |
|
| ||||||||||||
| Tumor size | ||||||||||||
| <2.1 cm | 15 | 8 | 27 | 14 | 30 | 11 | 15 | 24 | ||||
| ≥2.1 cm | 9 | 14 | 0.101 | 17 | 22 | 0.075 | 17 | 22 | 0.014 | 20 | 21 | 0.481 |
|
| ||||||||||||
| Nodal status | ||||||||||||
| Negative | 21 | 4 | 30 | 12 | 32 | 10 | 11 | 31 | ||||
| positive | 3 | 18 | 9.94×10⁻⁶ | 15 | 24 | 0.006 | 16 | 23 | 0.003 | 24 | 15 | 2.84×10⁻³ |
|
| ||||||||||||
| ER status | ||||||||||||
| Negative | 8 | 3 | 12 | 11 | 11 | 12 | 7 | 16 | ||||
| Positive | 16 | 19 | 0.223 | 33 | 25 | 0.890 | 37 | 21 | 0.285 | 28 | 30 | 0.225 |
|
| ||||||||||||
| HER2 | ||||||||||||
| High | 2 | 12 | 10 | 12 | 13 | 9 | 11 | 11 | ||||
| Low | 21 | 7 | 29 | 14 | 28 | 15 | 15 | 28 | ||||
| Negative | 2 | 2 | 0.002 | 3 | 7 | 0.049 | 2 | 8 | 0.033 | 6 | 4 | 0.249 |
|
| ||||||||||||
| Relapse-free Survival | ||||||||||||
| No-recurrance | 24 | 8 | 39 | 16 | 38 | 17 | 12 | 35 | ||||
| Recurrence | 0 | 14 | 1.27×10⁻⁵ | 3 | 14 | 3.04×10⁻⁴ | 7 | 10 | 0.073 | 15 | 19 | 2.67×10⁻⁵ |
|
| ||||||||||||
| Overall Survival | ||||||||||||
| Alive | 24 | 7 | 40 | 16 | 37 | 19 | 17 | 39 | ||||
| Died | 0 | 15 | 3.97×10⁻⁶ | 5 | 20 | 4.89×10⁻⁵ | 11 | 14 | 0.105 | 18 | 7 | 1.14 ×10⁻³ |
Note: Evaluated by χ2 test. Abbreviations: ER, estrogen receptor; HER2, human epidermal growth factor receptor 2; FoxP3, forkhead box protein P3.
In addition, numbers of tumor-infiltrating CD4+ T cells and FoxP3+ cells in breast cancer were also positively correlated with tumor stages and lymph nodal status, but negatively correlated with RFS and OS. However, CD8+ T cell numbers were negatively correlated with high tumor stages and positive lymph node status, and positively correlated with clinical outcomes of RFS and OS (Table 2). These results further confirmed the different effects mediated by TILs in tumor immunity and in pathogenesis of breast cancer. Notably, among these four subsets of tumor-infiltrating T cells, γδ T cells were shown to have the most significant correlation with the pathological factors and clinical outcomes in breast cancer patients.
Correlations between γδ T cells with CD4+ and CD8+ T cells, and FoxP3+ cells in breast cancer TILs
Tumor-infiltrating FoxP3+ T cells have been shown to be an important biomarker for assessing disease prognosis and progression of breast cancer (7, 11, 40). Our current studies observed that breast tumor-infiltrating γδ T cells were also negatively correlated with clinical outcomes. Therefore, we further investigated the correlation between tumor-infiltrating γδ T cells and FoxP3+ cells in breast cancer patients. Box Blot and linear correlation analysis demonstrated that there was a significant correlation between intra-tumoral γδ T cells and FoxP3+ cells in breast cancer tissues (p=7.72 × 10⁻⁵, r=0.549) (Figure 2A & 2B). In addition, we investigated the correlations between tumor-infiltrating γδ T cells and CD4+ as well as CD8+ T cells in breast cancer patients. There was a positive correlation between γδ T cells and CD4+ T cells, but a negative correlation between γδ T cells and CD8+ T cells (p=4.59 × 10⁻³, r=0.411 and p=7.36 × 10⁻⁴, r=−0.48, respectively) (Figure 2C & 2D). These results collectively suggested that both FoxP3+ and γδ T cells are important negative regulatory components of TILs in breast cancer patients, and the increase and activation of CD8+ T cells is an important strategy for anti-tumor immunity.
Figure 2. Correlations between γδ T cells and CD4+ T cells, CD8+ T cells and FoxP3+ cells in breast cancer TILs.
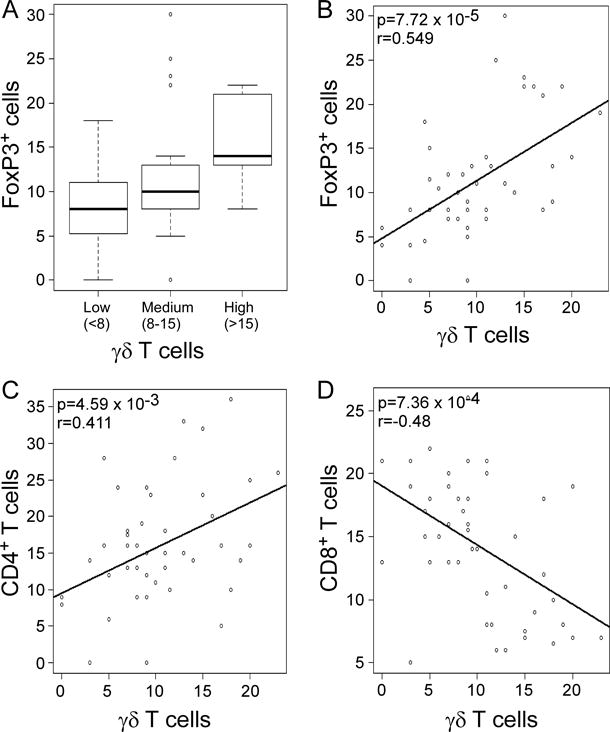
(A) and (B) Box plot and Scatter diagram analyses showing positive correlation between γδ T cells and FoxP3+ cells in breast cancer TILs. The median number of γδ T cells in each group is shown as a horizontal line in (A). (C) Scatter diagram showing positive correlation between γδ T cells and CD4+ T cells in breast cancer TILs. (D) Scatter diagram showing negative correlation between γδ T cells and CD8+ T cells in breast cancer TILs. Different types of TILs in frozen sections of breast tumor samples (n=46) were immunohistochemically determined as described in Figure 1.
Intra-tumoral γδ T cells are an independent prognostic factor for assessing disease severity of breast cancer
Since intra-tumoral γδ T cells were inversely associated with OS and RFS (Table 2), we further performed univariate Cox proportional hazard regression analyses of the relationships between γδ T cell levels, other prognostic factors and clinical outcomes in our patient cohort. As shown in Table 3, lymph node status, tumor stage, tumor-infiltrating γδ, CD4+ and CD8+ T cells, and Foxp3+ cells were all significant factors for the prediction of breast cancer outcomes. Importantly, level of intra-tumoral γδ T cells was the most significant risk factor among all these factors, with a hazard ratio (HR) of 41.69 (95% CI, 5.4 to 321.96, p= 4.79 × 10⁻⁸) for patient RFS and a HR of 44.73 (95% CI, 5.79 to 345.22, p= 1.51 × 10⁻⁸) for patient OS. In addition, we performed multivariate Cox regression analyses by including 6 predictor variables (lymph node status, tumor stage, intra-tumoral γδ, CD4+ and CD8+ T cells, and Foxp3+ cells) that were significant in univariate analyses of both OS and RFS. The multivariate analyses confirmed that γδ T cell level had independent effects on both OS and RFS. As shown in Table 4, γδ T cell level was still significant (p=0.0004 for RFS and p=0.0201 for OS) after adjustment for the other 5 predictors, with a HR 34.68 for RFS and 3.34 for OS. Besides γδ T cells, only CD8+ T cells and tumor stage maintained significance in the multivariate analysis of RFS, indicating that γδ T cell level might be an important driver predictor among these factors (Table 4). It is noteworthy that high numbers of tumor-infiltrating γδ T cells predicted poor OS and RFS in breast cancer patients. Based on the median of γδ T cell numbers in breast cancer tissues, patients were divided into two groups (γδ T cells ≤9, and γδ T cells>9). Kaplan-Meier analyses further demonstrated that the 5-year OS and RFS probabilities both were 100% in γδ T cells ≤9 cancer patients, whereas only about 35% (OS) and 30% (RFS) in γδ T cells >9 patients (Figure 3A). These results collectively suggest that intra-tumoral γδ T cell level is an independent prognostic factor for prediction of breast cancer outcome.
Table 3.
Univariate analyses of factors associated with Relapse-free Survival and Overall Survival in breast cancer patients (n=81).
| Variables | Relapse-free Survival
|
Overall survival
|
||||
|---|---|---|---|---|---|---|
| HR | 95% CI | p | HR | 95% CI | p | |
| CD4 (>16) | 3.92 | 1.48 to 10.36 | 0.005 | 2.61 | 1.17 to 5.82 | 0.018 |
| CD8 (>13) | 0.062 | 0.01 to 0.47 | 6.71E-05 | 0.32 | 0.13 to 0.79 | 0.007 |
| γδ T (>9) | 41.69 | 5.40 to 321.96 | 4.79E-08 | 44.73 | 5.79 to 345.22 | 1.51E-08 |
| FoxP3 (>12) | 9.68 | 2.77 to 33.82 | 2.49E-05 | 6.86 | 2.56 to 18.37 | 1.13E-05 |
| ER status (pos) | 1.26 | 0.41 to 3.87 | 0.679 | 1.71 | 0.64 to 4.59 | 0.260 |
| HER2 (pos) | 0.18 | 0.054 to 0.57 | 0.012 | 0.359 | 0.10 to 1.28 | 0.155 |
| Stage (III vs I + II) | 11.94 | 4.31 to 33.07 | 1.53E-06 | 6.72 | 2.88 to 15.71 | 1.65E-05 |
| Nodal (Pos) | 16.71 | 3.76 to 74.26 | 1.35E-06 | 6.97 | 2.58 to 18.79 | 1.15E-05 |
| Size (>2.1) | 2.19 | 0.83 to 5.78 | 0.108 | 3.435 | 1.42 to 8.22 | 0.003 |
Note: Results obtained using the Cox proportional hazard regression model.
Abbreviations: HR, harzard ratio; ER, estrogen receptor; HER2, human epidermal growth factor receptor 2. FoxP3, forkhead box protein P3.
Table 4.
Mulvariate analyses of Hazard Ratios with Relapse-free Survival and Overall Survival in breast cancer patients (n=81).
| Variables | Relapse-free Survival
|
Overall survival
|
||||
|---|---|---|---|---|---|---|
| HR | 95% CI | p | HR | 95% CI | p | |
| γδ T (>9) | 34.68 | 4.79 to 250.88 | 0.0004 | 3.34 | 1.21 to 9.25 | 0.020 |
| FoxP3 (>12) | 3.08 | 0.49 to 19.17 | 0.228 | 3.05 | 0.95 to 9.77 | 0.061 |
| CD4 (>16) | 2.31 | 0.66 to 8.07 | 0.189 | 1.20 | 0.47 to 3.09 | 0.702 |
| CD8 (>13) | 0.04 | 0.01 to 0.35 | 0.004 | 0.47 | 0.18 to 1.27 | 0.137 |
| Stage (III vs I + II) | 5.24 | 1.25 to 22.02 | 0.023 | 2.17 | 0.83 to 5.67 | 0.114 |
| Nodal (Pos) | 2.36 | 0.32 to 17.59 | 0.404 | 1.99 | 0.54 to 7.31 | 0.301 |
Note: Results obtained using the Cox proportional hazard regression model.
Abbreviations: HR, hazard ratio; FoxP3, forkhead box protein P3.
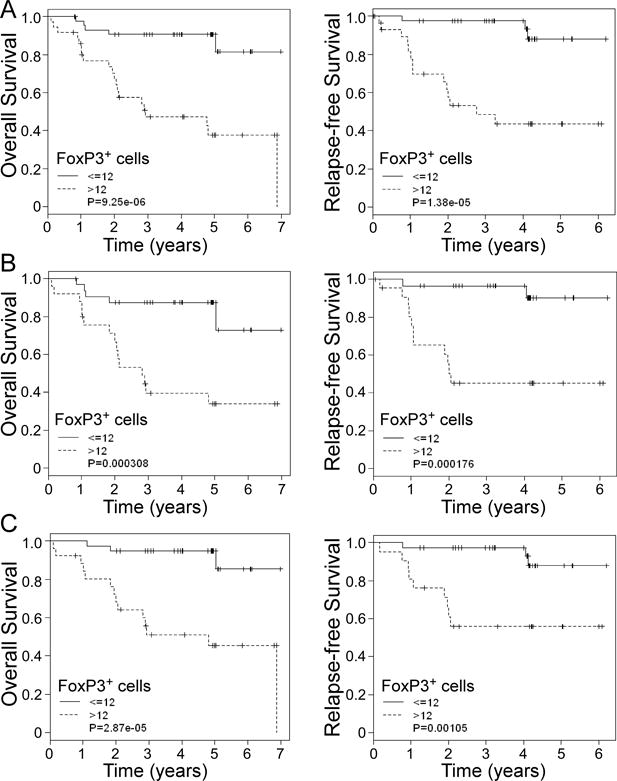
Figure 3. High numbers of tumor-infiltrating γδ T cells predict poor overall survival and shorter relapse-free survival in breast cancer patients.

Kaplan-Meier curves for overall survival and relapse-free survival stratified by the high and low numbers of γδT cells in all breast cancer patients (A), ER-positive patients (B) and HER2-postive patients (C). The median expression of γδ T cells (9) in breast cancer tissues was used as a cutoff point to define γδ T cell-high and γδ T cell-low groups. A total of 46 breast cancer patients were analyzed. P values were calculated with use of the log-rank test.
Given that ER-negative breast cancer patients have a worse prognosis than ER-positive patients, we next determined whether γδ T cells had a different prognostic value for clinical outcomes in breast cancer patients with different ER expression status. As expected, intra-tumoral γδ T cells were still the most significant independent risk factor for breast cancer outcomes compared with the other factors in ER-positive cancer patients. High number of intra-tumoral γδ T cells had the highest HR for OS (HR= 28.11, 95% CI 3.62 to 218.08, p= 2.04 × 10⁻⁶) and RFS (HR=26.45, 95% CI 3.41 to 205.07, p= 4.26 × 10⁻⁶) in ER-positive breast cancer patients (Table 5). Furthermore, patients with higher numbers of γδ T cells (>9) had lower 5-year RFS (30%) and OS (25%) in ER-positive patients. In contrast, the probability of 5-year RFS and OS were 100% for ER-positive patients containing low γδ T cells (≤9) (Figure 3B). In addition, we observed similar results in ER-negative breast cancer patients (data not shown). HER2 expression in tumor cells is another important prognostic factor for breast cancer outcomes. Our results demonstrated a significant correlation between γδ T cell numbers and HER2 expression in breast cancer patients (P=0.002) (Table 2). We found that HER2-positive cancer patients containing high γδ T cells (>9) also had significantly higher HRs for OS (HR= 35.79, 95% CI 4.51 to 283.87, p= 1.28 × 10⁻⁶) and RFS (HR= 39.39, 95% CI 4.99 to 310.65, p= 5.42 × 10⁻⁷) (Table 6), thus had significantly shorter 5-year survival rates for RFS (30%) and OS (40%) (Figure 3C). Because of the small sample size for HER2-negative cancer patients in the current study, statistical analyses of γδ T cells were not performed in these patients. Notably, our current study further confirmed that level of FoxP3+ T cells was another significant biomarker for prediction of breast cancer progression and clinical outcome based on univariate analysis and Kaplan-Meier survival results, consist with findings from other groups (Tables 3, 5 and 6 and Figure 4) (7, 11, 40). However, our results suggested that intra-tumoral γδ T cells might be a more valuable and significant factor than FoxP3 expression for the prediction of the risk and prognosis of breast cancer.
Table 5.
Univariate analyses of factors associated with Relapse-free Survival and Overall Survival in ER positive breast cancer patients (n= 58).
| Variables | Relapse-free Survival
|
Overall survival
|
||||
|---|---|---|---|---|---|---|
| HR | 95% CI | p | HR | 95% CI | p | |
| CD4 (>16) | 3.66 | 1.22 to 10.98 | 0.022 | 2.67 | 1.07 to 6.59 | 0.035 |
| CD8 (>13) | 0.06 | 0.008 to 0.47 | 0.0001 | 0.15 | 0.04 to 0.49 | 0.0002 |
| γδ T (>9) | 26.45 | 3.41 to 205.07 | 4.26E-06 | 28.11 | 3.62 to 218.08 | 2.04E-06 |
| FoxP3 (>12) | 10.33 | 2.28 to 46.76 | 0.0002 | 5.33 | 1.93 to 14.73 | 0.0004 |
| HER2 (Pos) | 0.42 | 0.05 to 3.38 | 0.471 | 0.64 | 0.08 to 5.03 | 0.688 |
| Stage (III vs I + II) | 10.55 | 3.19 to 34.81 | 5.24E-5 | 5.76 | 2.27 to 14.62 | 0.0002 |
| Nodal (Pos) | 21.82 | 2.801 to 170.01 | 2.07E-05 | 10.27 | 2.96 to 35.61 | 7.58E-06 |
| Size (>2.1) | 3.29 | 1.01 to 10.74 | 0.037 | 4.26 | 1.54 to 11.81 | 0.002 |
Note: Results obtained using the Cox proportional hazard regression model.
Abbreviations: HR, hazard ratio; HER2, human epidermal growth factor receptor 2; FoxP3, forkhead box protein P3.
Table 6.
Univariate Analyses of factors associated with Relapse-free Survival and Overall Survival in HER2 Positive breast cancer patients (n=64).
| Variables | Relapse-free Survival
|
Overall Survival
|
||||
|---|---|---|---|---|---|---|
| HR | 95% CI | P | HR | 95% CI | P | |
| CD4 (>16) | 2.95 | 0.95 to 9.21 | 0.067 | 3.25 | 1.22 to 8.67 | 0.017 |
| CD8 (>13) | 0.09 | 0.01 to 0.67 | 0.001 | 0.28 | 0.09 to 0.87 | 0.016 |
| γδ T (>9) | 39.39 | 4.99 to 310.65 | 5.42E-07 | 35.79 | 4.51 to 283.87 | 1.28E-06 |
| FoxP3 (>12) | 6.67 | 1.79 to 24.70 | 0.001 | 9.10 | 2.60 to 31.81 | 4.29E-05 |
| ER status (Pos) | 4.02 | 0.52 to 31.17 | 0.106 | 3.24 | 0.73 to 14.28 | 0.073 |
| Stage (III vs I + II) | 13.77 | 4.06 to 46.67 | 1.85E-05 | 13.53 | 4.53 to 40.47 | 2.05E-06 |
| Nodal (Pos) | NA | NA | 6.85E-08 | 14.84 | 3.36 to 65.43 | 3.44E-06 |
| Size (>2.1) | 2.93 | 0.88 to 9.77 | 0.068 | 4.23 | 1.38 to 13.04 | 0.006 |
Note: Results obtained using the Cox proportional hazard regression model.
Abbreviations: HR, hazard ratio; ER, estrogen receptor; FoxP3, forkhead box protein P3.
NA: not analysis. All patients with negative nodal status were no recurrence and alive during the follow-up period, and the software cannot perform the analysis.
Figure 4. Kaplan-Meier analyses of overall survival and relapse-free survival stratified for high and low numbers of tumor-infiltrating FoxP3+ cells in breast cancer patients.
Kaplan-Meier curve for overall survival and relapse-free survival stratified by the median number of FoxP3+ cells in all breast cancer patients (A), ER-positive patients (B) and HER2-postive patients (C). The median expression of FoxP3+ cells (12) in breast cancer tissues was used as a cutoff point and to define FoxP3+ cell-high and FoxP3+ cell-low groups. A total of 81 breast cancer patients were analyzed. P values were calculated with use of the log-rank test.
Prognostic value of γδ T cells for the risk of breast cancer development
In addition to retrospectively analyzing the associations between tumor-infiltrating γδ T cell levels, other prognostic factors, OS and RFS in breast cancer patients, we further determined the prognostic significance of intra-tumoral γδ T cells for the prediction of cancer development during the follow-up period. As shown in Figure 5A, there were significantly increased cumulative hazard ratios with the increasing follow-up years for mortality and relapse in the cancer patients containing high levels of tumor-infiltrating γδ T cells (γδ T cells>9). In contrast, cancer patients containing low levels of tumor-infiltrating γδ T cells (≤9) had 100% OS and RFS throughout the entire 5 year follow-up (cumulative hazard is 0). Although the level of tumor-infiltrating FoxP3+ T cells is also an important prognostic factor for the prediction of breast cancer development, cancer patients containing low levels of tumor-infiltrating FoxP3+ cells (≤12) still may die or relapse with a cumulative hazard of 0.2 throughout the entire 5 year follow-up (Figure 5B). These results clearly suggest that intra-tumoral γδ T cells are a novel clinical biomarker for identifying the risk for late-relapse and survival of breast cancer patients.
Figure 5. Prognostic values of γδ T cells and FoxP3+ cells for the risks of breast cancer mortality and relapse in all breast cancer patients during the follow-up period.

An increasing annual Hazard ratios for mortality and relapse per year in the breast cancer patients who have high numbers of tumor-infiltrating γδ T cells (A, n=46) and FoxP3+ cells (B, n=81) compared with those who have low numbers of these two subsets of TILs throughout the entire follow-up period.
DISCUSSION
Dissecting the functional role of different subsets of TILs in the tumor suppressive microenvironment is critical for the development of effective strategies for anti-tumor immunotherapy. Recent studies have shown a high frequency of γδ 1 T cells among TILs or circulating peripheral blood mononuclear cells (PBMC) from cancer patients with renal carcinoma tumors, acute leukemia and squamous cell carcinoma of the head and neck (41–44). Furthermore, we demonstrated that high percentages of γδ1 Treg cells with potent suppressive function existed in breast cancer TILs (6). However, the importance of these γδ T cells for clinical outcomes has not been determined. In the current study, we identified that γδ T cells constituted a dominant population existing in the breast cancer suppressive microenvironment during breast cancer progression. Importantly, we further showed that level of tumor-infiltrating γδ T cells was negatively correlated with clinical outcomes, and was a novel and independent prognostic factor in human breast cancer. These studies clearly suggest that the development of effective strategies targeting γδ Treg cells is essential for breast cancer immunotherapy.
Although negative regulation by γδ T cells in mouse tumor models has been documented (36, 45), little is known about the role of such cells in tumor immunity in cancer patients. In the current study, we explored the clinical significance of γδ T cells in the pathogenesis of breast cancer. First, our studies clearly showed that intra-tumoral γδ T cell numbers were positively correlated with advanced tumor stages and high lymph node metastasis, but were inversely correlated with RFS and OS of breast cancer patients. Second, multivariate and univariate analyses of intra-tumoral γδ T cells and other prognostic factors further demonstrated that intra-tumoral γδ T cells were the most significant independent risk factor for breast cancer among all other known factors associated with patient OS and RFS. Third, it is important that high numbers of tumor-infiltrating γδ T cells not only predict poor OS and RFS in breast cancer patients, but also have prognostic significance for identifying a high risk for late-relapse and poor survival of cancer patients during cancer development. These studies collectively suggest that breast tumor-infiltrating γδ T cells play a significant role in breast cancer progression and pathogenesis, and may serve as a valuable and independent prognostic biomarker for human breast cancer. Because the available anti-human γδ T cell antibody is only suitable for frozen section studies, the current study was limited to small numbers of frozen-breast tumor tissues at different stages of cancer progression. Our future studies should expand the breast cancer sample size to further confirm the functional role of intra-tumoral γδ T cells in the pathogenesis of breast cancer. Furthermore, it remains unclear whether the presence of γδ Treg cells is a primary driver of the pathogenesis of breast cancer. Mechanistic studies using suitable animal models are needed to firmly establish the role of γδ T cells in human breast cancer development. In addition, we will extend the current studies of breast cancer to other types of cancers, such as prostate cancer to determine whether this tumor-infiltrating γδ Treg cells are a unique feature only for human breast cancer.
It has become clear that an immunosuppressive microenvironment mediated by tumor-infiltrating Treg cells is a major obstacle to the success of immunotherapy against breast cancer (4–6). FoxP3+ Treg cells have been shown to be an important marker for assessing disease prognosis and progression of breast cancer (7, 11, 40). In the current studies, we also demonstrated that FoxP3+ T cells were a significant biomarker for prediction of clinical outcomes in breast cancer that was negatively correlated with RFS and OS of cancer patients. Given that that γδ Treg cells constituted a dominant population existing in the breast tumor suppressive microenvironment that was also significantly negatively associated with clinical outcome, we further investigated the relationship between tumor-infiltrating γδ T cells and presence of other infiltrating immune cells, especially FoxP3+ T cells. We have previously shown that breast tumor-derived γδ Treg cells do not express CD25 and FoxP3 markers, which are typically expressed by CD4+ Treg cells (6). Our current studies further showed that the intra-tumoral γδ T cells were positively correlated with FoxP3+ cells in breast cancer tissues. Importantly, our results demonstrated that intra-tumoral γδ T cells were more significantly correlated with poor outcome than FoxP3+ cells. These results strongly suggest that both FoxP3+ Treg and γδ T cells play critical roles in the immune pathogenesis of human breast cancer. In addition, novel immunologic approaches targeting both γδ T cells and FoxP3+ Treg cells in breast tumor microenvironments are urgently needed.
In order to augment the success of immunotherapy against breast cancer, one challenge is how to identify the origin and mechanisms governing the increase of different types of Treg cells in cancer patients. Recent studies suggest that there are several potential sources of Treg cells that exist in tumor sites (13–16, 46). One key mechanism responsible for accumulation of Treg cells within the tumor microenvironment is preferential recruitment of these Treg cells. Studies of Hodgkin’s lymphoma and ovarian cancer have shown that tumor microenvironmental CCL22 derived from cancer cells specifically recruits CCR4 positive CD4+ Treg cells to tumor sites (10, 47). Our current and previous studies have shown that increased numbers of γδ T cells were only observed in breast tumor tissues but not in normal breast tissues, suggesting the recruitment and expansion of γδ T cells by breast tumor microenvironments (6). Our future studies will focus on the identification of mechanisms responsible for the accumulation of γδ T cells in breast tumor microenvironments mediated by tumor cells and/or tumor-derived stromal and immune cells. Another challenge is the understanding of the immunosuppressive mechanisms utilized by these tumor-derived γδ Treg. Our previous studies have shown that γδ Treg cells are functionally distinct from naturally occurring CD4+CD25+ Treg cells. γδ Treg-mediated immune suppression is through unknown soluble factor(s), which is independent of IL-10 and/or TGF-β, in contrast to the cell-cell contact dependent suppressive mechanism of CD4+CD25+ Treg cells (6). Importantly, we recently demonstrated that human Toll-like receptor 8 (TLR8) signaling completely reversed the suppressive functions of naturally occurring CD4+CD25+ Treg cells and tumor-derived CD4+, CD8+ and γδ Treg cells (6, 48, 49). Once we obtain a better understanding of the mechanisms for the immuosuppression and accumulation of γδ T cells in breast cancer, we can develop combined novel strategies to block trafficking and recruitment of γδ Treg cells and to reverse the immune suppression mediated by γδ Treg cells, which would augment the anti-tumor immune responses in breast cancer immunotherapy.
Acknowledgments
The authors would like to thank Dr. William S. M. Wold and Jacqueline Spencer (Department of Molecular Microbiology and Immunology, Saint Louis University) for providing their microtome for tissue sections. We also thank Dr. Edward S. Bolesta (Department of Pathology, Saint Louis University) for providing paraffin embedded specimens of breast cancer.
This work was supported by grants from the American Cancer Society (RSG-10-160-01-LIB, to G. P) and the National Institutes of Health (1R21AI097852 and 1R21AI094478, to G. P).
Footnotes
Disclosures
The authors declare no financial or commercial conflict of interest.
Author Contributions
Conception and design: Chunling Ma, Eddy C. Hsueh and Guangyong Peng
Provision of study materials or patients: Yanping Zhang, Theresa Schwartz, Pamela Hunborg, Mark A. Varvares, and Eddy C. Hsueh
Collection and assembly of data: Chunling Ma, Theresa Schwartz, Pamela Hunborg, Daniel F. Hoft, Eddy C. Hsueh and Guangyong Peng
Data analysis and interpretation: Chunling Ma, Qunyuan Zhang, Jian Ye, Fang Wang, Yanping Zhang, Eric Wevers, Mark A. Varvares, Daniel F. Hoft, Eddy C. Hsueh and Guangyong Peng
Manuscript writing: Chunling Ma, Qunyuan Zhang, Daniel F. Hoft, Eddy C. Hsueh and Guangyong Peng
References
- 1.Emens LA, Reilly RT, Jaffee EM. Breast cancer vaccines: maximizing cancer treatment by tapping into host immunity. Endocrine-related cancer. 2005;12:1–17. doi: 10.1677/erc.1.00671. [DOI] [PubMed] [Google Scholar]
- 2.Zhou J, Zhong Y. Breast cancer immunotherapy. Cellular & molecular immunology. 2004;1:247–255. [PubMed] [Google Scholar]
- 3.Hudis CA. Current status and future directions in breast cancer therapy. Clinical breast cancer. 2003;4(Suppl 2):S70–75. doi: 10.3816/cbc.2003.s.018. [DOI] [PubMed] [Google Scholar]
- 4.Liyanage UK, Moore TT, Joo HG, Tanaka Y, Herrmann V, Doherty G, Drebin JA, Strasberg SM, Eberlein TJ, Goedegebuure PS, Linehan DC. Prevalence of regulatory T cells is increased in peripheral blood and tumor microenvironment of patients with pancreas or breast adenocarcinoma. J Immunol. 2002;169:2756–2761. doi: 10.4049/jimmunol.169.5.2756. [DOI] [PubMed] [Google Scholar]
- 5.Perez SA, Karamouzis MV, Skarlos DV, Ardavanis A, Sotiriadou NN, Iliopoulou EG, Salagianni ML, Orphanos G, Baxevanis CN, Rigatos G, Papamichail M. CD4+CD25+ regulatory T-cell frequency in HER-2/neu (HER)-positive and HER-negative advanced-stage breast cancer patients. Clin Cancer Res. 2007;13:2714–2721. doi: 10.1158/1078-0432.CCR-06-2347. [DOI] [PubMed] [Google Scholar]
- 6.Peng G, Wang HY, Peng W, Kiniwa Y, Seo KH, Wang RF. Tumor-infiltrating gammadelta T cells suppress T and dendritic cell function via mechanisms controlled by a unique toll-like receptor signaling pathway. Immunity. 2007;27:334–348. doi: 10.1016/j.immuni.2007.05.020. [DOI] [PubMed] [Google Scholar]
- 7.Bates GJ, Fox SB, Han C, Leek RD, Garcia JF, Harris AL, Banham AH. Quantification of regulatory T cells enables the identification of high-risk breast cancer patients and those at risk of late relapse. J Clin Oncol. 2006;24:5373–5380. doi: 10.1200/JCO.2006.05.9584. [DOI] [PubMed] [Google Scholar]
- 8.Siddiqui SA, Frigola X, Bonne-Annee S, Mercader M, Kuntz SM, Krambeck AE, Sengupta S, Dong H, Cheville JC, Lohse CM, Krco CJ, Webster WS, Leibovich BC, Blute ML, Knutson KL, Kwon ED. Tumor-infiltrating Foxp3-CD4+CD25+ T cells predict poor survival in renal cell carcinoma. Clin Cancer Res. 2007;13:2075–2081. doi: 10.1158/1078-0432.CCR-06-2139. [DOI] [PubMed] [Google Scholar]
- 9.Shen Z, Zhou S, Wang Y, Li RL, Zhong C, Liang C, Sun Y. Higher intratumoral infiltrated Foxp3+ Treg numbers and Foxp3+/CD8+ ratio are associated with adverse prognosis in resectable gastric cancer. J Cancer Res Clin Oncol. 2010;136:1585–1595. doi: 10.1007/s00432-010-0816-9. [DOI] [PMC free article] [PubMed] [Google Scholar]
- 10.Curiel TJ, Coukos G, Zou L, Alvarez X, Cheng P, Mottram P, Evdemon-Hogan M, Conejo-Garcia JR, Zhang L, Burow M, Zhu Y, Wei S, Kryczek I, Daniel B, Gordon A, Myers L, Lackner A, Disis ML, Knutson KL, Chen L, Zou W. Specific recruitment of regulatory T cells in ovarian carcinoma fosters immune privilege and predicts reduced survival. Nat Med. 2004;10:942–949. doi: 10.1038/nm1093. [DOI] [PubMed] [Google Scholar]
- 11.Merlo A, Casalini P, Carcangiu ML, Malventano C, Triulzi T, Menard S, Tagliabue E, Balsari A. FOXP3 expression and overall survival in breast cancer. J Clin Oncol. 2009;27:1746–1752. doi: 10.1200/JCO.2008.17.9036. [DOI] [PubMed] [Google Scholar]
- 12.Ghebeh H, Barhoush E, Tulbah A, Elkum N, Al-Tweigeri T, Dermime S. FOXP3+ Tregs and B7-H1+/PD-1+ T lymphocytes co-infiltrate the tumor tissues of high-risk breast cancer patients: Implication for immunotherapy. BMC Cancer. 2008;8:57. doi: 10.1186/1471-2407-8-57. [DOI] [PMC free article] [PubMed] [Google Scholar]
- 13.Curiel TJ. Tregs and rethinking cancer immunotherapy. The Journal of clinical investigation. 2007;117:1167–1174. doi: 10.1172/JCI31202. [DOI] [PMC free article] [PubMed] [Google Scholar]
- 14.Zou W. Regulatory T cells, tumour immunity and immunotherapy. Nature reviews. 2006;6:295–307. doi: 10.1038/nri1806. [DOI] [PubMed] [Google Scholar]
- 15.Knutson KL, Disis ML, Salazar LG. CD4 regulatory T cells in human cancer pathogenesis. Cancer Immunol Immunother. 2007;56:271–285. doi: 10.1007/s00262-006-0194-y. [DOI] [PMC free article] [PubMed] [Google Scholar]
- 16.Wang HY, Wang RF. Regulatory T cells and cancer. Current opinion in immunology. 2007;19:217–223. doi: 10.1016/j.coi.2007.02.004. [DOI] [PubMed] [Google Scholar]
- 17.Carding SR, Egan PJ. Gammadelta T cells: functional plasticity and heterogeneity. Nat Rev Immunol. 2002;2:336–345. doi: 10.1038/nri797. [DOI] [PubMed] [Google Scholar]
- 18.Hayday A, Tigelaar R. Immunoregulation in the tissues by gammadelta T cells. Nat Rev Immunol. 2003;3:233–242. doi: 10.1038/nri1030. [DOI] [PubMed] [Google Scholar]
- 19.Maeda Y, Reddy P, Lowler KP, Liu C, Bishop DK, Ferrara JL. Critical role of host gammadelta T cells in experimental acute graft-versus-host disease. Blood. 2005;106:749–755. doi: 10.1182/blood-2004-10-4087. [DOI] [PMC free article] [PubMed] [Google Scholar]
- 20.Brandes M, Willimann K, Moser B. Science. Vol. 309. New York, NY: 2005. Professional antigen-presentation function by human gammadelta T Cells; pp. 264–268. [DOI] [PubMed] [Google Scholar]
- 21.Pang DJ, Neves JF, Sumaria N, Pennington DJ. Understanding the complexity of gammadelta T-cell subsets in mouse and human. Immunology. 2012;136:283–290. doi: 10.1111/j.1365-2567.2012.03582.x. [DOI] [PMC free article] [PubMed] [Google Scholar]
- 22.Hayday AC. Gammadelta T cells and the lymphoid stress-surveillance response. Immunity. 2009;31:184–196. doi: 10.1016/j.immuni.2009.08.006. [DOI] [PubMed] [Google Scholar]
- 23.Hayday AC. [gamma][delta] cells: a right time and a right place for a conserved third way of protection. Annu Rev Immunol. 2000;18:975–1026. doi: 10.1146/annurev.immunol.18.1.975. [DOI] [PubMed] [Google Scholar]
- 24.Groh V, Steinle A, Bauer S, Spies T. Recognition of stress-induced MHC molecules by intestinal epithelial gammadelta T cells. Science. 1998;279:1737–1740. doi: 10.1126/science.279.5357.1737. [DOI] [PubMed] [Google Scholar]
- 25.Witherden DA, Havran WL. Molecular aspects of epithelial gammadelta T cell regulation. Trends Immunol. 2011;32:265–271. doi: 10.1016/j.it.2011.03.005. [DOI] [PMC free article] [PubMed] [Google Scholar]
- 26.Bukowski JF, Morita CT, Brenner MB. Human gamma delta T cells recognize alkylamines derived from microbes, edible plants, and tea: implications for innate immunity. Immunity. 1999;11:57–65. doi: 10.1016/s1074-7613(00)80081-3. [DOI] [PubMed] [Google Scholar]
- 27.Constant P, Davodeau F, Peyrat MA, Poquet Y, Puzo G, Bonneville M, Fournie JJ. Stimulation of human gamma delta T cells by nonpeptidic mycobacterial ligands. Science. 1994;264:267–270. doi: 10.1126/science.8146660. [DOI] [PubMed] [Google Scholar]
- 28.Spencer CT, Abate G, Blazevic A, Hoft DF. Only a subset of phosphoantigen-responsive gamma9delta2 T cells mediate protective tuberculosis immunity. J Immunol. 2008;181:4471–4484. doi: 10.4049/jimmunol.181.7.4471. [DOI] [PMC free article] [PubMed] [Google Scholar]
- 29.Viey E, Fromont G, Escudier B, Morel Y, Da Rocha S, Chouaib S, Caignard A. Phosphostim-activated gamma delta T cells kill autologous metastatic renal cell carcinoma. J Immunol. 2005;174:1338–1347. doi: 10.4049/jimmunol.174.3.1338. [DOI] [PubMed] [Google Scholar]
- 30.Kobayashi H, Tanaka Y, Yagi J, Osaka Y, Nakazawa H, Uchiyama T, Minato N, Toma H. Safety profile and anti-tumor effects of adoptive immunotherapy using gamma-delta T cells against advanced renal cell carcinoma: a pilot study. Cancer Immunol Immunother. 2007;56:469–476. doi: 10.1007/s00262-006-0199-6. [DOI] [PMC free article] [PubMed] [Google Scholar]
- 31.Wilhelm M, Kunzmann V, Eckstein S, Reimer P, Weissinger F, Ruediger T, Tony HP. Gammadelta T cells for immune therapy of patients with lymphoid malignancies. Blood. 2003;102:200–206. doi: 10.1182/blood-2002-12-3665. [DOI] [PubMed] [Google Scholar]
- 32.Mattarollo SR, Kenna T, Nieda M, Nicol AJ. Chemotherapy and zoledronate sensitize solid tumour cells to Vgamma9Vdelta2 T cell cytotoxicity. Cancer Immunol Immunother. 2007;56:1285–1297. doi: 10.1007/s00262-007-0279-2. [DOI] [PMC free article] [PubMed] [Google Scholar]
- 33.Dieli F, Vermijlen D, Fulfaro F, Caccamo N, Meraviglia S, Cicero G, Roberts A, Buccheri S, D’Asaro M, Gebbia N, Salerno A, Eberl M, Hayday AC. Targeting human {gamma}delta} T cells with zoledronate and interleukin-2 for immunotherapy of hormone-refractory prostate cancer. Cancer research. 2007;67:7450–7457. doi: 10.1158/0008-5472.CAN-07-0199. [DOI] [PMC free article] [PubMed] [Google Scholar]
- 34.Kapp JA, Kapp LM, McKenna KC, Lake JP. gammadelta T-cell clones from intestinal intraepithelial lymphocytes inhibit development of CTL responses ex vivo. Immunology. 2004;111:155–164. doi: 10.1111/j.0019-2805.2003.01793.x. [DOI] [PMC free article] [PubMed] [Google Scholar]
- 35.Ke Y, Kapp LM, Kapp JA. Inhibition of tumor rejection by gammadelta T cells and IL-10. Cellular immunology. 2003;221:107–114. doi: 10.1016/s0008-8749(03)00066-2. [DOI] [PubMed] [Google Scholar]
- 36.Seo N, Tokura Y, Takigawa M, Egawa K. Depletion of IL-10- and TGF-beta-producing regulatory gamma delta T cells by administering a daunomycin-conjugated specific monoclonal antibody in early tumor lesions augments the activity of CTLs and NK cells. J Immunol. 1999;163:242–249. [PubMed] [Google Scholar]
- 37.Bhagat G, Naiyer AJ, Shah JG, Harper J, Jabri B, Wang TC, Green PH, Manavalan JS. Small intestinal CD8+TCRgammadelta+NKG2A+ intraepithelial lymphocytes have attributes of regulatory cells in patients with celiac disease. J Clin Invest. 2008;118:281–293. doi: 10.1172/JCI30989. [DOI] [PMC free article] [PubMed] [Google Scholar]
- 38.Li X, Kang N, Zhang X, Dong X, Wei W, Cui L, Ba D, He W. Generation of human regulatory gammadelta T cells by TCRgammadelta stimulation in the presence of TGF-beta and their involvement in the pathogenesis of systemic lupus erythematosus. J Immunol. 2011;186:6693–6700. doi: 10.4049/jimmunol.1002776. [DOI] [PubMed] [Google Scholar]
- 39.Merims S, Dokouhaki P, Joe B, Zhang L. Human Vdelta1-T cells regulate immune responses by targeting autologous immature dendritic cells. Hum Immunol. 2011;72:32–36. doi: 10.1016/j.humimm.2010.10.011. [DOI] [PubMed] [Google Scholar]
- 40.Mahmoud SM, Paish EC, Powe DG, Macmillan RD, Lee AH, Ellis IO, Green AR. An evaluation of the clinical significance of FOXP3+ infiltrating cells in human breast cancer. Breast Cancer Res Treat. 2011;127:99–108. doi: 10.1007/s10549-010-0987-8. [DOI] [PubMed] [Google Scholar]
- 41.Aswald JM, Wang XH, Aswald S, Lutynski A, Minden MD, Messner HA, Keating A. Flow cytometric assessment of autologous gammadelta T cells in patients with acute myeloid leukemia: potential effector cells for immunotherapy? Cytometry. 2006;70:379–390. doi: 10.1002/cyto.b.20115. [DOI] [PubMed] [Google Scholar]
- 42.Bas M, Bier H, Schirlau K, Friebe-Hoffmann U, Scheckenbach K, Balz V, Whiteside TL, Hoffmann TK. Gamma-delta T-cells in patients with squamous cell carcinoma of the head and neck. Oral oncology. 2006;42:691–697. doi: 10.1016/j.oraloncology.2005.11.008. [DOI] [PubMed] [Google Scholar]
- 43.Meeh PF, King M, O’Brien RL, Muga S, Buckhalts P, Neuberg R, Lamb LS., Jr Characterization of the gammadelta T cell response to acute leukemia. Cancer Immunol Immunother. 2006;55:1072–1080. doi: 10.1007/s00262-005-0094-6. [DOI] [PMC free article] [PubMed] [Google Scholar]
- 44.Kowalczyk D, Skorupski W, Kwias Z, Nowak J. Flow cytometric analysis of tumour-infiltrating lymphocytes in patients with renal cell carcinoma. British journal of urology. 1997;80:543–547. doi: 10.1046/j.1464-410x.1997.00408.x. [DOI] [PubMed] [Google Scholar]
- 45.Kapp JA, Kapp LM, McKenna KC. Gammadelta T cells play an essential role in several forms of tolerance. Immunol Res. 2004;29:93–102. doi: 10.1385/IR:29:1-3:093. [DOI] [PubMed] [Google Scholar]
- 46.Gajewski TF. The expanding universe of regulatory T cell subsets in cancer. Immunity. 2007;27:185–187. doi: 10.1016/j.immuni.2007.08.001. [DOI] [PubMed] [Google Scholar]
- 47.Ishida T, Ishii T, Inagaki A, Yano H, Komatsu H, Iida S, Inagaki H, Ueda R. Specific recruitment of CC chemokine receptor 4-positive regulatory T cells in Hodgkin lymphoma fosters immune privilege. Cancer research. 2006;66:5716–5722. doi: 10.1158/0008-5472.CAN-06-0261. [DOI] [PubMed] [Google Scholar]
- 48.Peng G, Guo Z, Kiniwa Y, Voo KS, Peng W, Fu T, Wang DY, Li Y, Wang HY, Wang RF. Toll-like receptor 8-mediated reversal of CD4+ regulatory T cell function. Science. 2005;309:1380–1384. doi: 10.1126/science.1113401. [DOI] [PubMed] [Google Scholar]
- 49.Kiniwa Y, Miyahara Y, Wang HY, Peng W, Peng G, Wheeler TM, Thompson TC, Old LJ, Wang RF. CD8+ Foxp3+ regulatory T cells mediate immunosuppression in prostate cancer. Clin Cancer Res. 2007;13:6947–6958. doi: 10.1158/1078-0432.CCR-07-0842. [DOI] [PubMed] [Google Scholar]