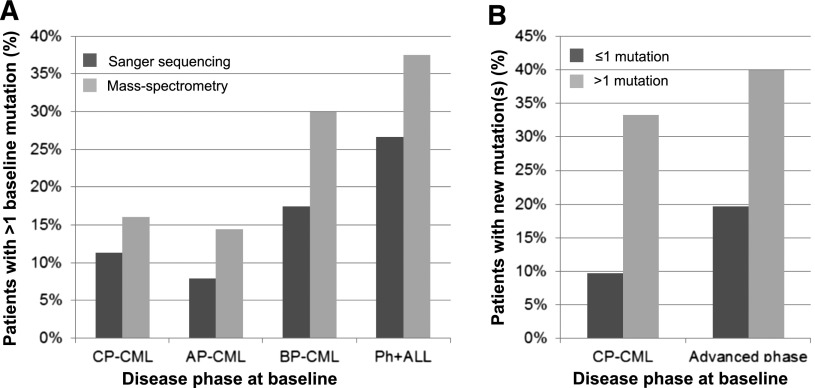
Figure 2.
The association between multiple mutations and acquisition of new mutations during ponatinib therapy. (A) The frequency of patients with multiple BCR-ABL1 KD mutations detected by Sanger sequencing (dark gray bars) or MS (light gray bars) at baseline, according to disease phase at study entry. (B) Rate of new mutations detected by Sanger sequencing after ponatinib failure/discontinuation, according to the disease phase and number of mutations detected by MS at baseline (≤1 mutation, dark gray bars; >1 mutation, light gray bars; advanced phase: AP-CML, BP-CML, and Ph+ ALL combined).

