Abstract
Hepatocellular carcinoma (HCC) is the sixth most prevalent cancer and the third leading cause of cancer‐related deaths worldwide. The fate of a cell is determined by the balance between the processes of fission and fusion that constantly occur in the mitochondria of cells. We previously showed that overexpression of Mitofusin‐2 can induce apoptosis in HCC cells by triggering an influx of Ca2+ into the mitochondria from the ER. The function of Mitofusin‐2 has been studied extensively, but the mechanism underlying the post‐transcriptional regulation of Mitofusin‐2 has not been elucidated. In the present study, we aimed to identify the mechanism of Mitofusin‐2 regulation in HCC. We demonstrated that Mitofusin‐2 is a direct target of miR‐761, which was found to be upregulated in HCC tissues. Furthermore, a miR‐761 inhibitor impaired mitochondrial function by upregulating Mitofusin‐2 and effectively repressed tumor growth and metastasis both in vivo and in vitro. Our findings provide new insight into the mechanism underlying Mitofusin‐2 regulation and the potential role of miR‐761 in HCC, making it a potential candidate for use in HCC therapy in the future.
Keywords: Cell proliferation, hepatocellular carcinoma, Mfn2, MiR‐761, mitochondria
Hepatocellular carcinoma (HCC) is the sixth most prevalent cancer worldwide. Despite the advances in HCC therapy, it is still the third leading cause of cancer mortality, causing half a million deaths each year.1, 2 An improved understanding of the molecular mechanisms involved in HCC is urgently needed to develop effective therapies.
MicroRNA (miRNA) are a class of evolutionarily conserved small noncoding RNA molecules that negatively regulate the expression of target genes either by mRNA degradation or by translational inhibition.3 Studies have revealed that miRNA act as either oncogenes or tumor suppressor genes4 and aberrant miRNA expression has been associated with the development and progression of a variety of cancers, including HCC.5, 6, 7 MiRNA exercise their function of post‐transcriptional gene regulation by targeting the 3′‐untranslated region (3′UTR) of the mRNA of the target gene.8 MiRNA have been found to regulate the expression of approximately 30% of human proteins9; they are also involved in a wide range of biological processes, including cell proliferation, apoptosis, differentiation and migration.10
Mitochondria, which control many vital cellular parameters, are dynamic organelles that are continuously undergoing fission and fusion.11 The balance between mitochondrial fission and fusion affects the morphology of mitochondria. Though the two opposing forces, mitochondria can change its size, shape and position in a few seconds12. Fusion can attenuate stress by mixing the contents of partially damaged mitochondria as a form of complementation. Fission is not only to create new mitochondria, but it also contributes to quality control by removing the damaged mitochondria13. Fission and fusion also help mitochondria to change the cytosolic localization, like to accumulate where high amounts of ATP required, or where ca2+ signaling needed to be regulated14. Mitofusin‐2 (Mfn2), anchored on the outer mitochondrial membrane, participates in mitochondrial fusion and contributes to the maintenance of the mitochondrial network.11, 15 In previous studies,16 we have confirmed that the overexpression of Mfn2 can induce apoptosis in HCC cells by triggering an influx of Ca2+ into the mitochondria from the endoplasmic reticulum. Mfn2 has also been associated with a number of different pathologic conditions, ranging from neurodegeneration17 to diabetes and obesity.18 Although there are many studies on the function of Mfn2, the mechanisms underlying the post‐transcriptional regulation of Mfn2 have not yet been elucidated.
In the current study, we aimed to determine this mechanism of Mfn2 regulation in HCC tissues. Our findings provide new insight into HCC pathogenesis and suggest candidates for potential use in HCC therapy in the future.
Materials and Methods
Patient specimens and cell lines
Hepatocellular carcinoma tissues and their matched normal liver tissues were obtained from 50 HCC patients who underwent HCC resection at the First Affiliated Hospital Zhejiang University School of Medicine, China. All tissue samples were frozen using liquid nitrogen and stored at –80°C. All the specimens were obtained with informed consent and the procedures were approved by the Ethics Committee of Zhejiang University. The HCC cell lines HepG2, SK‐Hep‐1, SMMC‐7721, LM3 and healthy liver cell line L02 were maintained at our institute. The HCC cell lines HepG2 were cultured in DMEM (Gibco, Grand Island, NY, USA), and SK‐Hep‐1, SMMC‐7721, LM3 and L02 was cultured in Medium 1640 (Gibco), supplemented with 10% heat‐inactivated FBS (Sigma‐Aldrich, St. Louis, MO, USA). All cells were maintained in a humidified atmosphere containing 5% CO2 at 37°C.
Cell transfection
A miR‐761‐mimic, NC‐mimic, miR‐761‐inhibitor and NC‐inhibitor were synthesized by GenePharma (Shanghai, China) and used to transfect the cells at a concentration of 20 nM. Oligonucleotide transfection was performed using Lipofectamine 2000 (Invitrogen, Carlsbad, CA, USA) according to the manufacturer's protocol. Cells were collected 48 h after transfection.
A replication‐defective lentivirus encoding the miR‐761‐inhibitor or NC‐inhibitor was constructed by Invitrogen. SK‐Hep‐1 cells were treated with the lentivirus at a multiplicity of infection (MOI) of 50 pfu/cell in 2% fetal bovine serum (FBS) with 8 μg/mL Polybrene (Sigma‐Aldrich). Forty‐eight hours after infection, puromycin (Invitrogen) was added to the medium to select stable transformants.
Luciferase reporter assay
Hep‐G2 and SK‐Hep‐1 cells were seeded in a 24‐well plate and co‐transfected with miR‐761 and a miR‐761‐inhibitor or negative control (NC) and 100 ng of firefly luciferase reporter plasmid that contained either the wild‐type or mutant 3′UTR of the target gene. Forty‐eight hours after transfection, the cells were collected and subjected to a dual‐luciferase reporter assay (Promega, Madison, WI, USA).
RNA extraction and quantitative RT‐PCR
Total RNA was extracted from the cultured cells and the HCC tissue specimens using Trizol Reagent (Invitrogen) according to the manufacturer's protocol. The expression of miR‐761 was measured by TaqMan miRNA assays (Applied Biosystems, Foster City, CA, USA) according to the provided protocol, and compared against the expression of U6 snRNA, used as the internal control. Mfn2 expression was measured using the SYBR green quantitative RT‐PCR. assay (Takara, Dalian, China) and β‐actin was used as the endogenous control. The primers used were as follows: Mfn2 forward primer 5′‐AATCTGAGGCGACTGGTGA‐3′ and reverse primer 5′‐CTCCTCCTGTTCGACAGTCA‐3′; β‐actin forward primer 5′‐AGTGTGACGTGGACATCCGCAAAG‐3′ and reverse primer 5′‐ATCCACATCTGCTGGAAGGTGGAC‐3′.
Western blot analysis
Western blotting was performed as described previously.16 Briefly, the cells were first washed twice with cold PBS, and total proteins were then extracted from the cells after incubation in radioimmunoprecipitation assay (RIPA) lysis buffer (Cell Signaling Technology, Danvers, MA, USA) supplemented with complete protease inhibitor cocktail (Roche, Basel, Switzerland) for 1 h on ice. The supernatants were collected after centrifugation at 15 000 g at 4°C for 20 min. Protein concentrations were measured using a bicinchoninic acid protein assay kit (Thermo Scientific, Waltham, MA, USA). Equal amounts of denatured proteins were separated by electrophoresis on SDS‐PAGE gels and transferred onto PVDF membranes. After blocking non‐specific binding for 1 h using 5% non‐fat milk, the membranes were incubated overnight on ice with primary antibodies against MFN2, β‐actin, Bax, caspase‐3 and PARP (1:1000, Abcam, Cambridge, MA, USA).
Immunohistochemistry
Immunohistochemistry was performed as described previously.16 Mfn2 mouse monoclonal antibody (Abcam) was used as the primary antibody. Sections were scored semi‐quantitatively by two observers independently in a blinded manner as follows: 0, 0% immunoreactive cells; 1, ≤5% immunoreactive cells; 2, 5–50% immunoreactive cells; 3, ≥50% immunoreactive cells. Scores of 0 or 1 were considered to indicate “low” expression and those of 2 or 3 indicated “high” expression.
Cell viability assay
Cell viability assays were performed using the Cell Counting Kit‐8 (Dojindo Laboratories, Kumamoto, Japan) according to the manufacturer's instructions. The cells were cultured in 96‐well plates at a density of 1000 cells/well for 24, 48, 72 and 96 h. The absorbance was read at 450 nm to determine the cell viability in each well.
Apoptosis assay
Cells were plated in 6‐well plates, and 48 h after transfection, the cells were collected and resuspended in staining solution to stain with Annexin V‐FITC and propidium iodide. The stained cells (1 × 10⁵) were analyzed using a flow cytometer. Apoptosis was also confirmed using confocal microscopy. The cells were incubated with 7.5 μM CellEvent Caspase 3/7 Green Detection Reagent (Invitrogen) and 10 nM tetramethylrhodamine methyl ester perchlorate (TMRM [Invitrogen]), according to the manufacturer's protocol. Images were acquired and analyzed by confocal microscopy (Olympus FV1000, Tokyo, Japan).
Cell migration and invasion assays
Cell migration assays were performed using transwells from Costar, 6.5 mm in diameter and 8.0 μm in pore size; 1 × 10⁴ cells in 300 μL serum‐free media were then added into the upper chamber of the transwell and incubated for 24 h with the bottom chamber containing 10% FBS. After completion of incubation, the membranes were isolated and stained by using the Diff‐Quik stain (Polyscience, Warington, PA, USA), according to the manufacturer's protocol. The cells were then counted in 10 fields using an inverted microscope (Leica, Malvern, PA, USA) and the percentage of migration was calculated relative to that of the control cells. For the cell invasion assays, 40 μL of diluted matrigel was added into the upper chamber of the transwell, and after incubation at 37°C for 30 min, 5 × 10⁴ cells in serum‐free media were added to the upper chamber.
Detection of mitochondrial reactive oxygen species
Reactive oxygen species (ROS) were measured using a total ROS/Superoxide Detection Kit (Enzo Life Science, Farmingdale, NY, USA). Using a combination of two specific fluorescent probes, the kit provides a simple and specific assay for the real‐time measurement of global ROS levels, specifically of superoxide, in living cells. The cells were stained using the two‐color ROS Detection Kit and analyzed using FCM (flow cytometry).
Establishment of the in vivo orthotopic hepatocellular carcinoma model and treatment
SK‐Hep‐1 cells were suspended in 0.2 mL of PBS and injected s.c. into the left flank of mice (5‐week‐old female BALB/c nude mice, 5 × 10⁶ cells/mouse). The developed subcutaneous xenografts were extracted and cut into 1‐mm3 pieces, which were then inoculated into the liver parenchyma of nude mice under anesthesia with ketamine after opening up the abdomen. The mice were monitored once every 3 days. The animals were killed 6 weeks later, and relative data (including the weight, length and width of the tumor) were recorded. The lungs and livers of the mice were resected and subjected to histopathological examination. Tumor volume was calculated using the following formula: volume = (L × W2)/2, where L and W are the longest and shortest diameters of the tumors, respectively. Serial sections were prepared for every tissue block from the lung, and the total number of lung metastases was counted under a microscope. All research involving animal complied with protocols approved by the Zhejiang Medical Experimental Animal Care Commission.
Statistical analysis
Data were analyzed using the Statistical Package for the Social Sciences (SPSS), Version 18 (SPSS, Chicago, IL, USA). The results are presented as the mean ± standard error of the mean (SEM). All experiments were performed in triplicate. The difference between the groups was analyzed using Student t‐test. P < 0.05 in all cases was considered to indicate statistical significance.
Results
MiR‐761 downregulates MFN2 by directly targeting its 3′‐untranslated region
To explore the underlying mechanism by which MFN2 is downregulated in HCC, we tested whether a miRNA can control MFN2 expression. We analyzed the 3′UTR of MFN2 using the target scan program and found a preferred candidate miRNA, miR‐761, that targets three putative binding sites within the 3′UTR of MFN2. To verify whether MFN2 is the direct downstream target of miR‐761, we employed the luciferase assay to test whether miR‐761 is involved in the regulation of MFN2 expression. As shown in Figure 1(a), we mutated the three candidate binding sites and found that the wild‐type 3′UTR of MFN2 exhibited a lower translation level in the presence of miR‐761, whereas the mutated 3′UTR did not show a significant response to miR‐761 (Fig. 1b).
Figure 1.
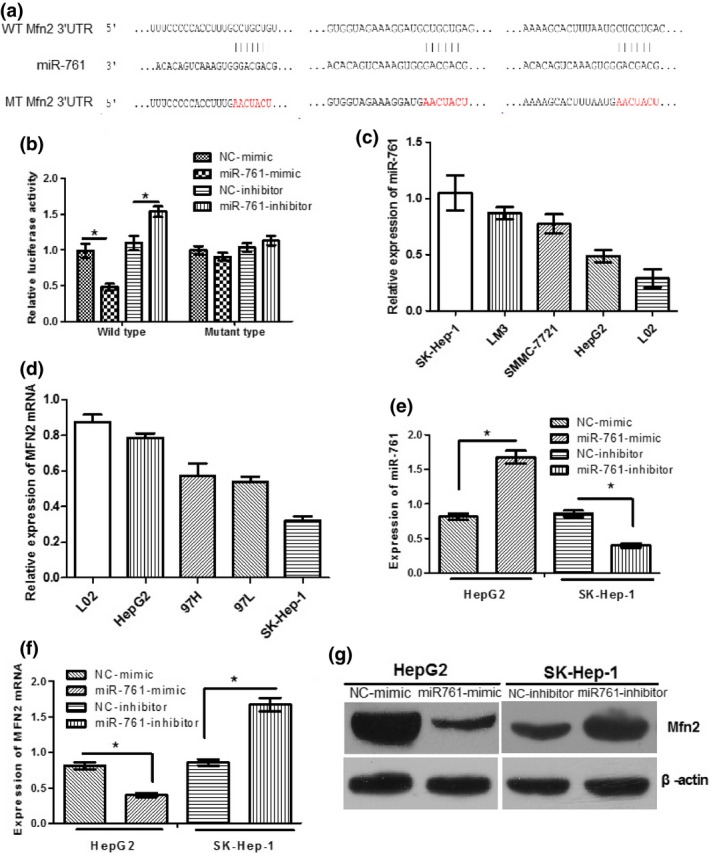
Mfn2 is a direct target of miR‐761. (a) The predicted miR‐761 binding site within Mfn2 3′‐untranslated region (3′UTR) and its mutated version are as shown. (b) Luciferase assay was performed in HepG2 cells that were co‐transfected with miR‐761 mimics/inhibitor or NC and reporter vectors carrying wild‐type or mutant‐type of Mfn2 3′UTR. (c) qRT‐PCR analysis of miR‐761 expression in normal liver cell (L02 cells) and HCC cells (HepG2, HCCLM3, SK‐Hep‐1, and SMMC‐7721). (d) qRT‐PCR analysis of MFN2 mRNA expression in five cell lines. HepG2 cells were transfected with NC or miR‐761 mimics, SK‐Hep‐1 cells were transfected with NC or miR‐761 inhibitors respectively. qRT‐PCR was used to detect miR‐761 (e) and Mfn2 (f) expression. (g) Western blotting was used to detect Mfn2 expression; β‐actin was used as an internal control. *P < 0.05.
In addition, the expression of miR‐761 in the four HCC cells and one healthy liver cell line was determined. As presented in Figure 1(c), the relative expression of miR‐761 in four HCC cell lines were significantly higher than those in healthy liver cell line, L02. The expression of miR‐761 in the SK‐Hep‐1 cells was the highest, while that in the HepG2 cells was the lowest. Then, we also determined the expression level of MFN2 in the five cell lines. Conversely, the expression of MFN2 in the SK‐Hep‐1 cells was the lowest, while that in the HepG2 cells was the highest (Figure 1d).
Next, the effect of miR‐761 on the endogenous expression of MFN2 was further examined. RT‐qPCR and western blot analysis demonstrated that the overexpression of miR‐761 substantially decreased the expression of MFN2 in the HepG2 cells, and that knockdown of miR‐761 increased MFN2 expression in the SK‐Hep‐1 cells (Fig. 1f,g). Taken together, these results indicate that MFN2 is a direct target of miR‐761 in HCC cells and that miR‐761 downregulates MFN2 expression by directly targeting its 3′UTR.
Upregulation of miR‐761 in hepatocellular carcinoma tissues
Fifty clinical tumor tissue samples were collected from patients with HCC. First, we measured the expression of miR‐761 in 50 pairs of HCC tissue samples and their corresponding control liver tissues using RT‐qPCR. The results indicated that miR‐761 expression was significantly higher in the HCC tissues than in the normal tissues, as shown in Figure 2(a,b). This upregulation of miR‐761 may be involved in HCC carcinogenesis. The Clinical data of those 50 patients was shown in supporting table 2.
Figure 2.
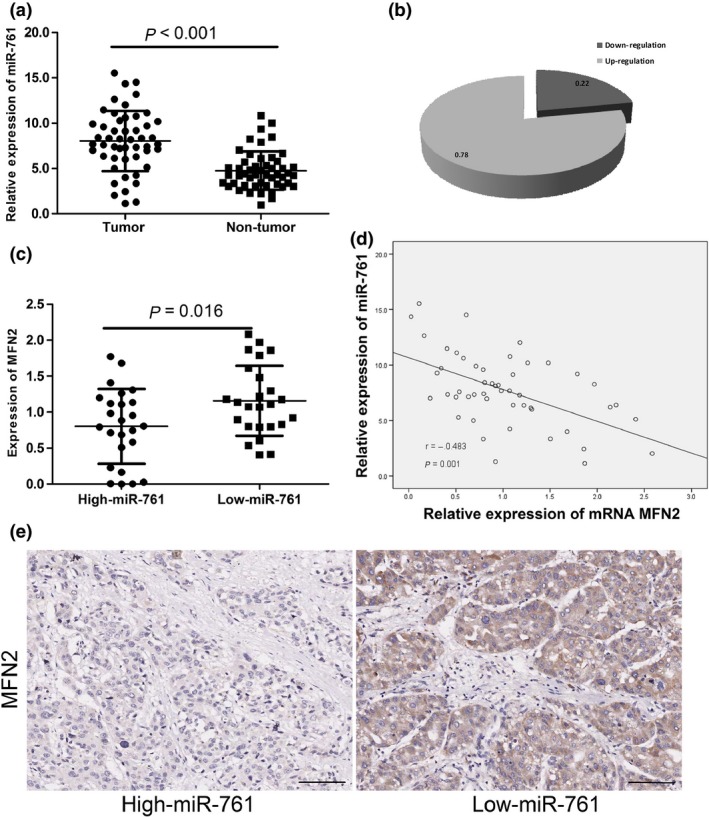
The inverse correlation between miR‐761 and Mfn2 expression in hepatocellular carcinoma (HCC) tissues. (a) Quantitative RT‐PCR analysis of miR‐761 expression in 50 pairs HCC tissues and their corresponding adjacent livers. (b) The percentage of upregulating miR‐761 in HCC tissues was shown. (c) The medium level of 50 cases was chosen as the cut‐off point for separating low‐miR‐761 (n = 25) and high‐miR‐761 (n = 25) groups. Quantitative RT‐PCR analysis of Mfn2 expression in low and high miR‐761 group. (d) Expression levels of miR‐761 and Mfn2 mRNA are inversely correlated (n = 50) as indicated by two‐tailed Pearson's correlation analysis, r = −0.483; P = 0.001. (e) Immunohistochemistry assays were applied to explore the protein levels of Mfn2 in HCC tissues in the low and high miR‐761 group. (Scale bar: 100 μM.)
Upregulation of miR‐761 in hepatocellular carcinoma tissues is associated with MFN2 downregulation
To better understand the association between miR‐761 and MFN2 expression, we divided the 50 patient specimens into two groups, a high‐miR‐761 group and a low‐miR‐761 group, according to the expression of miR‐761. We measured the expression of MFN2 in the two groups using RT‐qPCR. As shown in Figure 2(c), MFN2 mRNA expression was significantly downregulated in the high‐miR‐761 group. The inverse correlation between miR‐761 and MFN2 mRNA expression was verified by linear regression analysis (r = −0.483, P = 0.001) (Fig. 2d). The results of the immunohistochemistry assay also showed the same findings of RT‐qPCR (Fig. 2e).
MiR‐761 inhibitor suppresses hepatocellular carcinoma cell proliferation in vitro
To better understand the role of miR‐761 in HCC, we transfected HepG2 and SK‐Hep‐1 cells with miR‐761 mimic and a miR‐761 inhibitor, respectively. The influence of miR‐761 on cell proliferation was investigated using the CCK‐8 assay. As shown in Figure 3(a,b), overexpression of miR‐761 mimic significantly promoted cell proliferation in HepG2 cells. The MiR‐761 inhibitor was found to suppress cell proliferation in the SK‐Hep‐1 cells.
Figure 3.
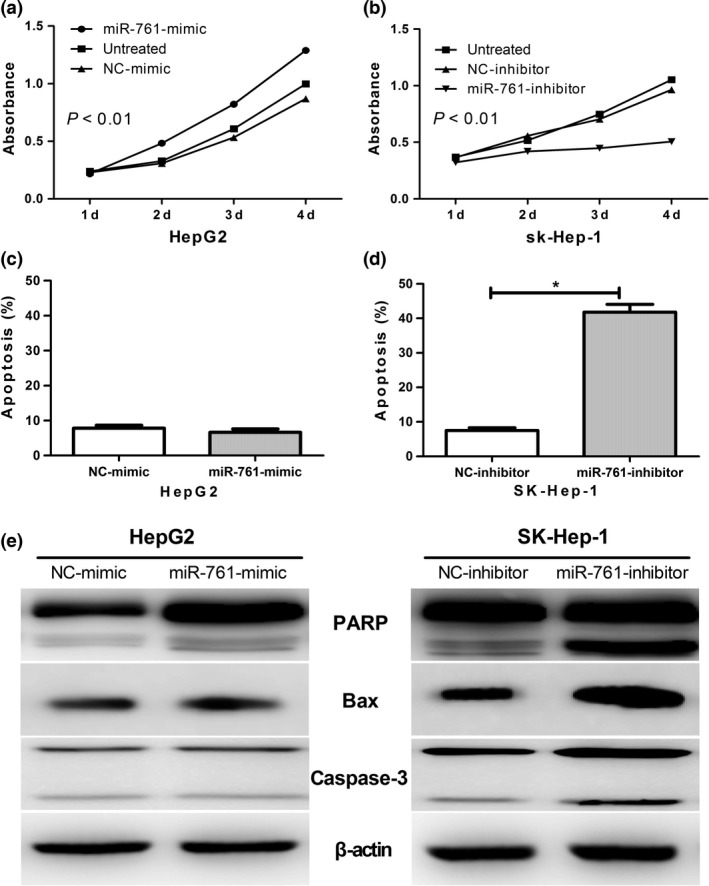
MiR‐761 inhibitor suppresses hepatocellular carcinoma (HCC) cell proliferation in vitro. The CCK8 assay used to evaluate the proliferation of HepG2 cells after transfection with the miR‐761 mimic and NC‐mimic (a) or SK‐Hep1 cells after transfection with the miR‐761 inhibitor or NC‐inhibitor (b). (c) and (d) show the apoptosis of HepG2 and SK‐Hep1 cells after transfection with miR‐761 mimic or miR‐761 inhibitor, respectively. (e) Western blot analysis of the apoptosis associated protein levels in HepG2 and SK‐Hep1 cells after transfection with miR‐761 mimic or miR‐761 inhibitor, respectively.
Consistent with these results, the inhibition of miR‐761 triggered apoptosis in the SK‐Hep‐1 cells, while no significant cell apoptosis was detected in the HepG2 cells when miR‐761 was overexpressed (Fig. 3c,d).
We examined the effect of miR‐761 inhibition on apoptosis mediators in order to elucidate the molecular mechanism by which miR‐761 triggers apoptosis. As shown in Figure 3(e), the inhibition of miR‐761 significantly increased the protein levels of active‐caspase‐3 and Bax, and caused PARP degradation. This suggests that miR‐761 induces apoptosis via a caspase‐dependent mechanism.
MiR–761 increases hepatocellular carcinoma cell migration and invasion in vitro
To investigate the function of miR‐761 in cell migration and invasion, miR‐761 was overexpressed using miRNA mimics in the HepG2 HCC cell line. Transwell assays indicated that overexpression of miR‐761 increased the number of migrated and invaded HepG2 cells (Fig. 4a). In order to find out the increased HepG2 cells is due to higher cell growing rate or the increased migration and invasion ability; we have calculated the ratio of invasion cells versus migration cells. As is shown in Figure 4a, the ratio is 0.238 in NC‐mimic group, and is lower than 0.36 of the miR‐761‐mimic group. Thus, we concluded that overexpression of miR‐761 indeed increased the migration and invasion ability of the HepG2 cells. In contrast, the migration and invasion of SK‐Hep‐1 cells was decreased following the silencing of endogenous miR‐761 (Fig. 4b). The ratio of invasion cells versus migration cells in NC‐inhibitor and miR‐761‐inhibitor group is 0.55 and 0.451, respectively.
Figure 4.
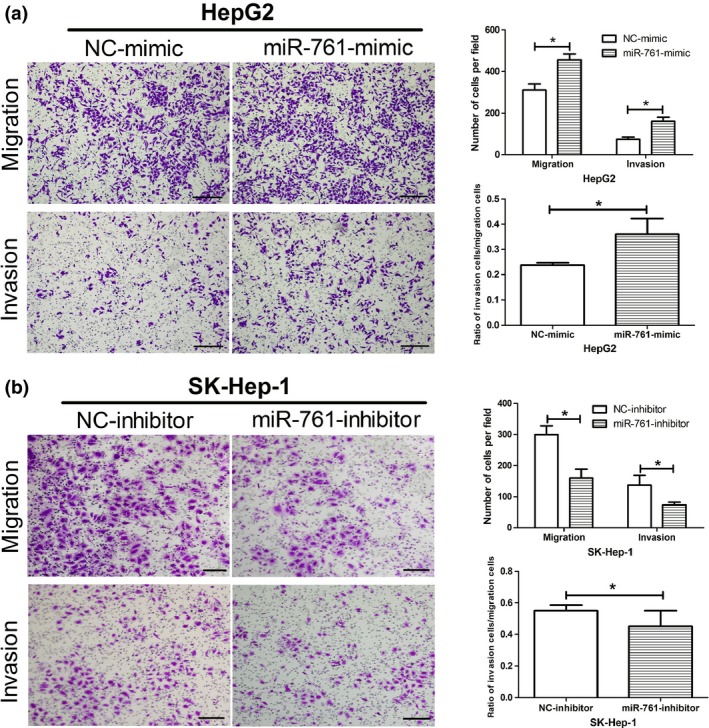
MiR–761 increases migration and invasion of hepatocellular carcinoma (HCC) cells in vitro. (a) Representative images of migration and invasion assay after miR‐761 overexpress in HepG2 cells. And the ratio of invasion cells versus migration cells in HepG2 cells. (b) Representative images of migration and invasion assay after inhibiting miR‐761 expression in SK‐Hep‐1 cells. And the ratio of invasion cells versus migration cells in SK‐Hep‐1 cells. *P < 0.05. (Scale bar: 100 μM.)
MiR‐761 inhibitor affects mitochondrial function
We used the CellEvent caspase‐3/7 green detection reagent and TMRM to detect Caspase‐3/7 activities and membrane potential (▵Ψm), respectively, using confocal microscopy. The number of Caspase‐3/7‐activated cells, which were labeled with green fluorescence, was significantly higher in the miR‐761‐inhibitor group than in the NC group. Meanwhile, the red fluorescence, which reflected the mitochondrial membrane potential, was significantly decreased in the MiR‐761‐inhibitor group. However, there was no difference between the miR‐761‐mimic and NC‐mimic groups (Fig. 5a). We then detected the ROS level, which is a key marker of mitochondrial function. Figure 5(b) shows elevated ROS in the SK‐Hep‐1 cells transfected with the miR‐761 inhibitor, with the proportion of cells with increased ROS levels in the range of 8.3–17.6%.
Figure 5.
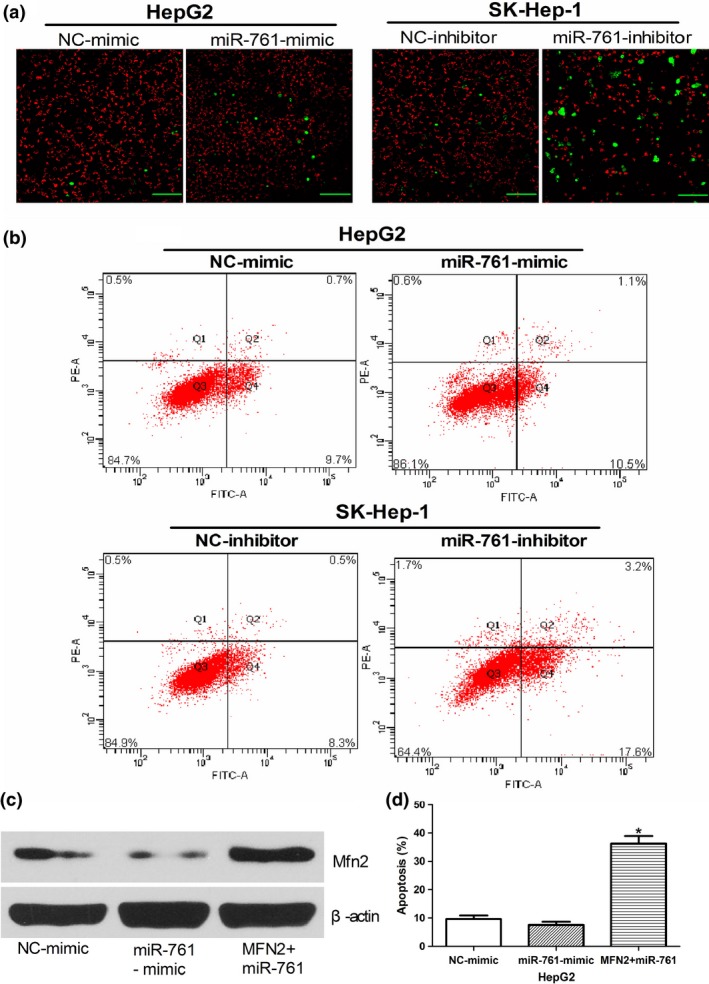
MiR‐761 inhibitor affects mitochondrial function and MFN2 is involved in the MiR‐761 inhibitor‐mediated apoptosis. (a) Representative images show apoptosis and a decreased mitochondrial membrane potential (with enhanced green fluorescence and decreased red fluorescence) in SK‐Hep1 cells after transfection with the miR‐761 inhibitor (Scale bar: 50 μM.) (b) HepG2 and SK‐Hep1 cells were stained with a two‐color ROS detection kit and analyzed using flow cytometry after transfection with the miR‐761 inhibitor or miR‐761‐mimic. (c) Western blotting was used to detect Mfn2 expression in HepG2 cells after co‐transfection with miR‐761 and MFN2 plasmids lacking the 3′‐untranslated region (3′UTR) region; β‐actin was used as an internal control. (d) The apoptosis of HepG2 after co‐transfection with miR‐761 and MFN2 plasmids lacking the 3′UTR region. *P < 0.01.
MFN2 is involved in the MiR‐761 inhibitor–mediated apoptosis of hepatocellular carcinoma cells
To determine whether MFN2 acts as a critical mediator of the function of miR‐761 in HCC cells, the HepG2 cells were co‐transfected with miR‐761 and MFN2 plasmids lacking the 3′UTR region. As shown in Figure 5(c), MFN2 plasmids efficiently upregulated MFN2 protein levels, despite the presence of the miR‐761‐mimic. Furthermore, the overexpression of MFN2 caused an apoptotic effect (Fig. 5d) similar to that caused by the miR‐761 inhibitor, which has been shown in Figure 3(c). These results indicate that the miR‐761 inhibitor induces HCC cell apoptosis at least in part by upregulating MFN2.
The miR‐761 inhibitor suppressed tumor growth and metastasis of hepatocellular carcinoma cells in nude mice
To further determine the effect of the miR‐761 inhibitor on HCC tumor growth in vivo, we constructed a lentiviral vector expressing the miR‐761 inhibitor and used it to establish stable SK‐Hep‐1 cell lines. The miR‐761‐inhibitor (n = 6) and NC‐inhibitor (n = 6) groups showed successfully formed orthotropic liver tumors. The tumor size of the NC‐inhibitor group was significantly larger than that of miR‐761‐inhibitor group. In consistent with the in vivo study, the miR‐761 is indeed downregulated and the MFN2 is upregulated in the tumors generated from the cells expressing miR‐761 inhibitor compare to control tumors. The pulmonary metastasis rates were 100% in both groups. However, the number of metastatic tumor clusters per mouse in the NC‐inhibitor group was much higher than that of the miR‐761‐inhibitor group (Fig. 6).
Figure 6.
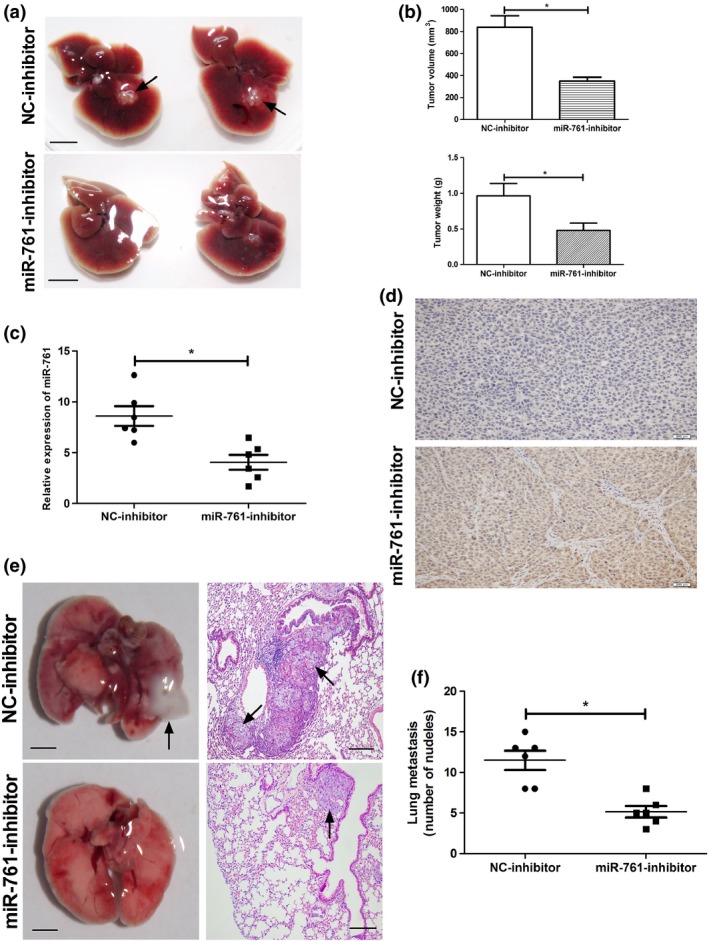
The miR‐761 inhibitor suppressed tumor growth and metastasis of hepatocellular carcinoma (HCC) cells in nude mice. (a) Representative images showed the node mouse livers in miR‐761 inhibitor and NC‐inhibitor groups (Scale bar: 1 cm). (b) The tumor weight and volume in both groups. (c) qRT‐PCR analysis of miR‐761 expression in the tumor of miR‐761 inhibitor and NC‐inhibitor groups. (d) Representative images showed the MFN2 expression level in miR‐761 inhibitor and NC‐inhibitor groups (Scale bar: 200 μM). Representative images showed the node mouse lungs (e) (scale bar: 0.5 cm) and H&E stain of lungs (scale bar: 100 μM) in both groups. (f) The number of metastatic tumor clusters per mouse in both groups. *P < 0.01.
Discussion
Mainly, there are four proteins mediating mitochondrial fission and fusion.19 MFN1 and MFN2 are involved in mitochondrial outer membrane fusion through their active GTPase domain. Opa1 participates in inner mitochondrial membrane fusion. Drp1 is mainly located in the cytosol and can be recruited to the outer membrane of mitochondria during mitochondrial fission. Recently, Mid49, Mid5120 and MFF21 were also found to be needed during mitochondrial fission. MFN2 possesses an N‐terminal RAS‐binding domain,22 and mounting evidence indicates that MFN2 is involved in multiple signaling pathways that are not restricted to the regulation of mitochondrial morphology. Mfn2 functions as a mitochondrial receptor for Parkin and is required for quality control of cardiac mitochondria.23 Moreover, the overexpression of MFN2 in hyperproliferating vascular smooth muscle cells physically sequesters Ras, thereby inhibiting the downstream Ras signaling pathway.22 In previous studies,16 we have confirmed that Mfn2 expression is lower in tumor tissues than in adjacent normal tissues. This downregulation of Mfn2 is associated with poor prognosis. Mfn2 also plays important roles in a variety of fields. However, there is no information regarding the post‐transcriptional regulation of Mfn2 expression.
To explore the underlying mechanism by which Mfn2 is downregulated in HCC, we tested whether a miRNA can control Mfn2 expression. In this study, miR‐761 was identified as a direct mediator of Mfn2 in HCC. This conclusion is further supported by the following evidence: the complementary sequence of miR‐761 was identified in the 3′UTR of the Mfn2 mRNA; ectopic of miR‐761 significantly reduced Mfn2 levels in HCC cells, whereas a miR‐761 inhibitor enhanced Mfn2 expression; miR‐761 expression in HCC tissues was associated with MFN2 expression; miR‐761 overexpression inhibited Mfn2 3′UTR luciferase reporter activity and this effect was abolished by mutation of the miR‐761 seed‐binding site. Here, we found three putative binding sites within the Mfn2 3′UTR. However, no mutations were inserted into those three binding sites, respectively. Therefore, further research needs to be conducted to identify the exactly binding site for miR‐761. Recently, a report also declared miR‐761 can promote progression and metastasis of non‐small cell lung cancer (NSCLC) by targeting ING4 and TIMP224. It will be interesting to clarify whether in HCC miR‐761 also can regulate the expression of ING4 and TIMP2. This will help us to better understand the function of miR‐761.
It has been found that some miRNA can affect mitochondrial dynamics. MiR‐30 family members have been reported to regulate apoptosis by targeting the mitochondrial fission mediator Drp‐1.25 Furthermore, miR‐140 can promote mitochondrial fission and apoptosis by targeting Mfn1.26 Recently, miR‐761 was found to be able to suppress mitochondrial fission and apoptosis by targeting mitochondrial fission factor (MFF).27 In this study, we confirmed that inhibition of miR‐761 expression can damage mitochondrial function and cause apoptosis by upregulating Mfn2 in HCC cells.
Each miRNA may have multiple targets, and identification of these targets may help us understand the pathogenesis of multifactorial diseases such as cardiovascular diseases, diabetes, obesity and cancer. Here, our findings combined with those of previous studies show that miR‐761 can mediate the expression of Mff and Mfn2. As Mff and Mfn2 control two opposing activities, we believe that miR‐761 is crucial for maintaining the balance between mitochondrial fission and fusion as well as cellular homeostasis. MiR‐761, Mfn2 and MFF may constitute a regulatory axis in the machinery of the mitochondrial network and apoptosis in HCC. In future studies, it is important to identify the role of Mff in the tumorigenesis in HCC. It has been demonstrated that the aberrant MiRNome is a Hallmark of cancer. An increasing number of studies have attempted to investigate the mechanisms. Although the regulation of miRNA expression remains largely unclear, till now, we have demonstrated that microRNA can be regulated by the following mechanisms: 1Chromosomal abnormalities28, 2Mutations29, 3Polymorphisms30, 4Epigenetic mechanisms31, 32. Here?whether the upregulation of miR‐761 is due to the promoter methylation or histone acetylation need further investigate.
Hepatocellular carcinoma (HCC) is a primary neoplasm of the liver and is a great threat to public health worldwide. However, its underlying molecular mechanism remains largely unknown. Growing evidence has suggested that dysregulation of miRNA may contribute to HCC tumorigenesis. In our study, we analyzed miR‐761 expression in 50 HCC patients and found miR‐761 to be upregulated in HCC tissues. This is the first report on the expression of miR‐761 in tumor tissues. In addition, we found that inhibition of miR‐761 expression can suppress proliferation, migration and invasion in SK‐Hep‐1 cells. We also revealed the anti‐tumor effect of miR‐761 in an orthotopic HCC model.
In conclusion, this study reveals that miR‐761 is upregulated in HCC tissues and can affect mitochondrial function and inhibit cell proliferation, migration and invasion in vivo and in vitro by targeting Mfn2. This may represent a novel approach for the treatment of HCC in future studies.
Disclosure Statement
The authors have no conflict of interest to declare.
Supporting information
Fig. S1. The MFN2 expression level of the six pair's tumor in miR‐761 inhibitor and NC‐inhibitor groups (Scale bar: 200 μM).
Table S1. The candidate miRNAs.
Table S2. Correlation of miR‐761 expression and clinicopathological characteristics.
Acknowledgments
This work was supported by The National Natural Science Foundation of China (No. 81172315/H1617) and the National S&T Major Project (No. 2012ZX10002017).
Cancer Sci 107 (2016) 424–432
Funding Information
National Natural Science Foundation of China; National S&T Major Project.
References
- 1. Jemal A, Bray F, Center MM, Ferlay J, Ward E, Forman D. Global cancer statistics. CA Cancer J Clin 2011; 61: 69–90. [DOI] [PubMed] [Google Scholar]
- 2. Nishida N, Goel A. Genetic and epigenetic signatures in human hepatocellular carcinoma: a systematic review. Curr Genomics 2011; 12: 130–7. [DOI] [PMC free article] [PubMed] [Google Scholar]
- 3. Bartel DP. MicroRNAs: genomics, biogenesis, mechanism, and function. Cell 2004; 116: 281–97. [DOI] [PubMed] [Google Scholar]
- 4. Shenouda SK, Alahari SK. MicroRNA function in cancer: oncogene or a tumor suppressor? Cancer Metastasis Rev 2009; 28: 369–78. [DOI] [PubMed] [Google Scholar]
- 5. Yu X‐Y, Zhang Z, Liu J, Zhan B, Kong C‐Z. MicroRNA‐141 is downregulated in human renal cell carcinoma and regulates cell survival by targeting CDC25B. Onco Targets Ther 2013; 6: 349–54. [DOI] [PMC free article] [PubMed] [Google Scholar]
- 6. Alpini G, Glaser SS, Zhang J‐P et al Regulation of placenta growth factor by microRNA‐125b in hepatocellular cancer. J Hepatol 2011; 55: 1339–45. [DOI] [PMC free article] [PubMed] [Google Scholar]
- 7. Qiu X, Dong S, Qiao F et al HBx‐mediated miR‐21 upregulation represses tumor‐suppressor function of PDCD4 in hepatocellular carcinoma. Oncogene 2013; 32: 3296–305. [DOI] [PubMed] [Google Scholar]
- 8. Baek D, Villen J, Shin C, Camargo FD, Gygi SP, Bartel DP. The impact of microRNAs on protein output. Nature 2008; 455: 64–U38. [DOI] [PMC free article] [PubMed] [Google Scholar]
- 9. Friedman RC, Farh KK‐H, Burge CB, Bartel DP. Most mammalian mRNAs are conserved targets of microRNAs. Genome Res 2009; 19: 92–105. [DOI] [PMC free article] [PubMed] [Google Scholar]
- 10. Yates LA, Norbury CJ, Gilbert RJC. The long and short of microRNA. Cell 2013; 153: 516–9. [DOI] [PubMed] [Google Scholar]
- 11. De Brito OM, Scorrano L. Mitofusin 2: a mitochondria‐shaping protein with signaling roles beyond fusion. Antioxid Redox Signal 2008; 10: 621–33. [DOI] [PubMed] [Google Scholar]
- 12. Bereiter‐Hahn J, Vöth M. Dynamics of mitochondria in living cells: shape changes, dislocations, fusion, and fission of mitochondria. Microsc Res Tech 1994; 27: 198–219. [DOI] [PubMed] [Google Scholar]
- 13. Youle RJ, Van Der Bliek AM. Mitochondrial fission, fusion, and stress. Science 2012; 337: 1062–5. [DOI] [PMC free article] [PubMed] [Google Scholar]
- 14. Campello S, Scorrano L. Mitochondrial shape changes: orchestrating cell pathophysiology. EMBO Rep 2010; 11: 678–84. [DOI] [PMC free article] [PubMed] [Google Scholar]
- 15. Chen HC, Detmer SA, Ewald AJ, Griffin EE, Fraser SE, Chan DC. Mitofusins Mfn1 and Mfn2 coordinately regulate mitochondrial fusion and are essential for embryonic development. J Cell Biol 2003; 160: 189–200. [DOI] [PMC free article] [PubMed] [Google Scholar]
- 16. Wang W, Xie Q, Zhou X et al Mitofusin‐2 triggers mitochondria Ca2+ influx from the endoplasmic reticulum to induce apoptosis in hepatocellular carcinoma cells. Cancer Lett 2015; 358: 47–58. [DOI] [PubMed] [Google Scholar]
- 17. Tatsuta T, Langer T. Quality control of mitochondria: protection against neurodegeneration and ageing. EMBO J 2008; 27: 306–14. [DOI] [PMC free article] [PubMed] [Google Scholar]
- 18. Bach D, Naon D, Pich S et al Expression of Mfn2, the Charcot‐Marie‐Tooth neuropathy type 2A gene, in human skeletal muscle – effects of type 2 diabetes, obesity, weight loss, and the regulatory role of tumor necrosis factor alpha, and interleukin‐6. Diabetes 2005; 54: 2685–93. [DOI] [PubMed] [Google Scholar]
- 19. Suen D‐F, Norris KL, Youle RJ. Mitochondrial dynamics and apoptosis. Genes Dev 2008; 22: 1577–90. [DOI] [PMC free article] [PubMed] [Google Scholar]
- 20. Palmer CS, Osellame LD, Laine D, Koutsopoulos OS, Frazier AE, Ryan MT. MiD49 and MiD51, new components of the mitochondrial fission machinery. EMBO Rep 2011; 12: 565–73. [DOI] [PMC free article] [PubMed] [Google Scholar]
- 21. Otera H, Wang C, Cleland MM et al Mff is an essential factor for mitochondrial recruitment of Drp1 during mitochondrial fission in mammalian cells. J Cell Biol 2010; 191: 1141–58. [DOI] [PMC free article] [PubMed] [Google Scholar]
- 22. Chen KH, Guo XM, Ma DL et al Dysregulation of HSG triggers vascular proliferative disorders. Nat Cell Biol 2004; 6: 872–U8d. [DOI] [PubMed] [Google Scholar]
- 23. Chen Y, Dorn GW II. PINK1‐Phosphorylated mitofusin 2 is a Parkin receptor for culling damaged mitochondria. Science 2013; 340: 471–5. [DOI] [PMC free article] [PubMed] [Google Scholar]
- 24. Yan A, Yang C, Chen Z, Li C, Cai L. MiR‐761 promotes progression and metastasis of non‐small cell lung cancer by targeting ING4 and TIMP2. Cell Physiol Biochem 2015; 37: 55–66. [DOI] [PubMed] [Google Scholar]
- 25. Li J, Donath S, Li Y, Qin D, Prabhakar BS, Li P. miR‐30 regulates mitochondrial fission through targeting p53 and the synamin‐related protein‐1 pathway. PLoS Genet 2010; 6: e1000795. [DOI] [PMC free article] [PubMed] [Google Scholar]
- 26. Li J, Li Y, Jiao J et al Mitofusin 1 is negatively regulated by microRNA 140 in cardiomyocyte apoptosis. Mol Cell Biol 2014; 34: 1788–99. [DOI] [PMC free article] [PubMed] [Google Scholar]
- 27. Long B, Wang K, Li N et al miR‐761 regulates the mitochondrial network by targeting mitochondrial fission factor. Free Radic Biol Med 2013; 65: 371–9. [DOI] [PMC free article] [PubMed] [Google Scholar]
- 28. Zhang L, Huang J, Yang N, Greshock J, Megraw MS, Giannakakis A, et al. microRNAs exhibit high frequency genomic alterations in human cancer. Proc Natl Acad Sci USA 2006; 103: 9136–41. [DOI] [PMC free article] [PubMed] [Google Scholar]
- 29. Calin GA, Ferracin M, Cimmino A, Di Leva G, Shimizu M, Wojcik SE, et al. A MicroRNA signature associated with prognosis and progression in chronic lymphocytic leukemia. N [DOI] [PubMed]
- 30. Hu Z, Chen J, Tian T, Zhou X, Gu H, Xu L, et al. Genetic variants of miRNA sequences and non–small cell lung cancer survival. J Clin Invest 2008; 118: 2600. [DOI] [PMC free article] [PubMed] [Google Scholar]
- 31. Weber B, Stresemann C, Brueckner B, Lyko F. Methylation of human microRNA genes in normal and neoplastic cells. Cell Cycle 2007; 6: 1001–5. [DOI] [PubMed] [Google Scholar]
- 32. Saito Y, Liang G, Egger G, Friedman JM, Chuang JC, Coetzee GA, et al. Specific activation of microRNA‐127 with downregulation of the proto‐oncogene BCL6 by chromatin‐modifying drugs in human cancer cells. Cancer Cell 2006; 9: 435–43. [DOI] [PubMed] [Google Scholar]
Associated Data
This section collects any data citations, data availability statements, or supplementary materials included in this article.
Supplementary Materials
Fig. S1. The MFN2 expression level of the six pair's tumor in miR‐761 inhibitor and NC‐inhibitor groups (Scale bar: 200 μM).
Table S1. The candidate miRNAs.
Table S2. Correlation of miR‐761 expression and clinicopathological characteristics.


