

Abstract
Volumetric parameters of positron emission tomography–computed tomography using 18F‐fludeoxyglucose (18F‐FDG PET/CT) that comprehensively reflect both metabolic activity and tumor burden are capable of predicting survival in several cancers. The aim of this study was to investigate the predictive performance of metabolic tumor burden measured by 18F‐FDG PET/CT in ovarian cancer patients who received platinum‐based adjuvant chemotherapy after cytoreductive surgery. Included in this study were 37 epithelial ovarian cancer patients. Metabolic tumor burden in terms of metabolic tumor volume (MTV) and total lesion glycolysis (TLG), clinical stage, histological type, residual tumor after primary cytoreductive surgery, baseline serum carbohydrate antigen 125 (CA125) level, and the maximum standardized uptake value (SUVmax) were determined, and compared for their performance in predicting progression‐free survival (PFS). Metabolic tumor volume correlated with CA125 (r = 0.547, P < 0.001), and TLG correlated with SUVmax and CA125 (SUVmax, r = 0.437, P = 0.007; CA125, r = 0.593, P < 0.001). Kaplan–Meier analysis showed a significant difference in PFS between the groups categorized by TLG (P = 0.043; log–rank test). Univariate analysis indicated that TLG was a statistically significant risk factor for poor PFS. Multivariate analysis adjusted according to the clinicopathological features was carried out for MTV, TLG, SUVmax, tumor size, and CA125. Only TLG showed a significant difference (P = 0.038), and a 3.915‐fold increase in the hazard ratio of PFS. Both MTV and TLG (especially TLG) could serve as potential surrogate biomarkers for recurrence in patients who undergo primary cytoreductive surgery followed by platinum‐based chemotherapy, and could identify patients at high risk of recurrence who need more aggressive treatment.
Keywords: Epithelial ovarian cancer, metabolic tumor burden, metabolic tumor volume, positron emission tomography–computed tomography using 18F‐fludeoxyglucose, total lesion glycolysis
Ovarian cancer is a common tumor of the female reproductive system. The incidence of ovarian cancer is ranked second on the list of gynecological malignant tumors, and its mortality rate ranks first. The majority of women with ovarian cancer initially respond to standard treatment approaches consisting of a combination of primary surgical cytoreduction and platinum‐based chemotherapy.1 Although the clinical response rate after primary chemotherapy is high, 50–70% of patients with ovarian cancer have recurrence. The 5‐year survival rate of patients with ovarian cancer stage III is 20–40%, and only 10% for stage IV patients. Identifying the prognostic factors for EOC is important to predict outcomes and implement the most appropriate treatment strategy. Several important prognostic factors of ovarian cancer have been reported including FIGO stage, histopathological type, age, residual tumor after primary cytoreductive surgery, serum CA125 level, and sensitivity of platinum‐based chemotherapy.2, 3, 4
In addition, the prognostic value of 18F‐FDG PET/CT has been shown in various types of tumors. The SUVmax has been suggested as a significant parameter for predicting clinical outcomes in EOC. However, SUVmax is just a point measurement of highest metabolic activity and provides no additional information concerning tumor burden.5, 6 Recently, several reports have suggested that volumetric parameters of 18F‐FDG PET/CT, that is, MTV and TLG, comprehensively reflect both metabolic activity and tumor burden in a 3‐D way, and predict survival more accurately than SUVmax in EOC.7, 8 However, the predictive value of MTV and TLG in EOC patients who received platinum‐based adjuvant chemotherapy after cytoreductive surgery has not been elucidated.
In this study, we hypothesized that metabolic tumor burden measured by 18F‐FDG PET/CT, that is, MTV and TLG, may be prognostic markers that can predict PFS in EOC. We assessed the ability of these markers measured in pretreatment 18F‐FDG PET/CT (MTV and TLG) to predict PFS in EOC patients who received platinum‐based adjuvant chemotherapy after cytoreductive surgery, and compared these markers with the predictive ability of FIGO stage, histological type, residual tumor after primary cytoreductive surgery, baseline serum CA125 level, and SUVmax.
Materials and Methods
Patient population
We carried out a retrospective review of the medical records in our facility of newly diagnosed EOC patients who received platinum‐based adjuvant chemotherapy after staging laparotomy or cytoreductive surgery between January 2009 and December 2013.
The inclusion and exclusion criteria for all patients were as follows: (i) pathologically proven EOC; (ii) pretreatment 18F‐FDG PET/CT examination; (iii) platinum‐based chemotherapy (three to six courses of triweekly paclitaxel 175 mg/m2 and carboplatin AUC 5) given after surgery; and (iv) no previous diagnosis of other malignancy. Optimal cytoreductive surgery was defined as resection without macroscopic residual tumor, and suboptimal cytoreductive surgery was defined as resection with macroscopic residual tumor. For platinum‐based chemotherapy, the patients received paclitaxel and carboplatin. Carboplatin was given as an i.v. infusion over the course of 1 h at a dose calculated to produce an AUC of 5 mg/mL/min on day 1 of a 21‐day cycle. The patients additionally received paclitaxel given as an i.v. infusion for 3 h at a dose of 175 mg/m2 on day 1. The treatments were repeated every 3 weeks for three to six cycles (median, 5.2 cycles). Dose reductions were carried out depending on hematologic or non‐hematologic toxicity, as follows: carboplatin AUC 4; paclitaxel 150 mg/m2 or 135 mg/m2. Any subsequent treatment cycle was delayed when the patient's absolute neutrophil count was <1.5 × 10⁹ cells/L or when the platelet count was <100 × 109 cells/L. Supportive granulocyte colony‐stimulating factor treatment was sometimes carried out at the discretion of the physician. All patients received established antiallergic and antiemetic premedication.
This study was approved by the institutional review board of the University of Fukui Hospital (Fukui, Japan). Written informed consent was obtained from all patients studied.
Imaging
Whole‐body PET scans with 18F‐FDG were carried out with a combined PET/CT scanner (Discovery LS; GE Medical Systems, Milwaukee, WI, USA), which permitted simultaneous acquisition of 35 image slices in a 3‐D acquisition mode with interslice spacing of 4.25 mm. The PET/CT scanner incorporated an integrated four‐slice multidetector CT scanner, which was used for attenuation correction. The CT scanning parameters were as follows: Auto mA (upper limit, 40 mA; noise index, 20), 140 kV, 5‐mm section thickness, 15‐mm table feed, and pitch of 4. After at least 4 h of fasting, patients received an i.v. injection of 185 MBq 18F‐FDG, and image acquisition began 50 min after the injection. A whole‐body emission scan was carried out from the head to the inguinal region with 2 min per bed position (seven to eight bed positions). The PET data were reconstructed by the iterative reconstruction method selecting 14 subsets and 2 iterations, a 128 × 128 matrix, and post‐smoothing with an 8‐mm Gaussian filter. The reconstructed images were then converted to a semiquantitative image corrected by the injection dose and subject's body weight (=SUV).
Image analysis
The 18F‐FDG PET/CT images were retrospectively interpreted by a gynecologic oncologist (M.Y., with 10 years of experience in gynecologic oncology) with the consensus of an experienced radiologist (T.T., with 12 years of experience in oncologic PET) who had no knowledge of the other imaging results or the clinical data. Using an automatic registration software package (Advantage Workstation VS4; GE Medical Systems), volumes of interest were placed on the primary tumor and disseminated sites. The tumor contour was delineated to include voxels presenting SUV values >40% of SUVmax (Fig. 1).8 The extracted tumor volume was defined as MTV, and TLG was calculated as the product of the mean SUV and MTV.
Figure 1.
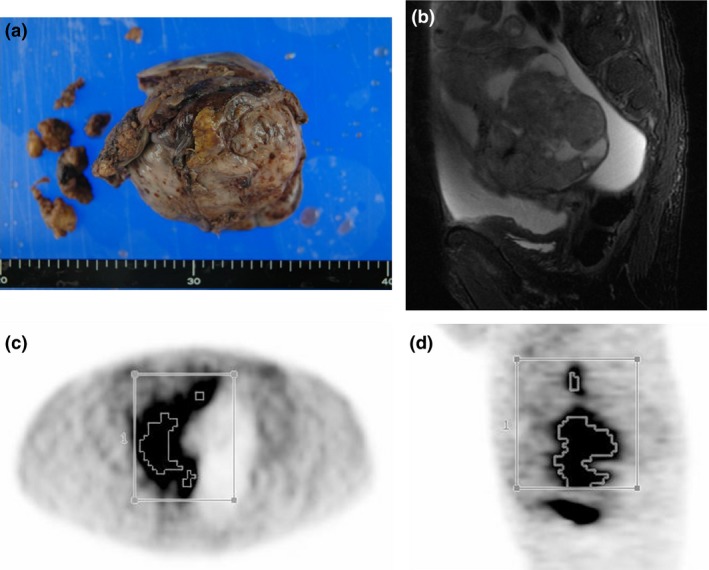
(a) Gross appearance of epithelial ovarian cancer. (b) Sagittal MRI T2‐weighted image. A volume of interest was set manually, and the contour around the target lesion, which was over 40% of maximum standardized uptake value, was automatically produced. Axial (c) and sagittal (d) PET images are shown.
Clinical end‐points and follow‐up
Data were collected from medical records to determine recurrence or death, along with other clinical characteristics. Progression‐free survival was defined as the time from surgical staging to date of confirmation of recurrence or to the date of the last clinical follow‐up. All patients underwent clinical follow‐up that included diagnostic imaging studies and blood tests and local examination. Clinical assessment was carried out every 1–3 months, and blood tests, including serum CA125 level, and imaging studies, such as contrast‐enhanced CT scan, were carried out every 6 months. If the clinical assessment or studies done during follow‐up showed abnormal findings, additional diagnostic studies such as 18F‐FDG PET/CT and/or histopathological confirmation were carried out to assess cancer recurrence or disease progression. A diagnosis of radiographic recurrent tumor was based on unequivocal findings by 18F‐FDG PET/CT. Time to recurrence was defined as time to date of confirmation of recurrence. In this study, the mean duration of clinical follow‐up was 39.6 ±18.95 months (median, 38 months).
Statistical analysis
Correlations between clinicopathological features (age, clinical stage, histopathological type, optimal surgery, or suboptimal surgery) and MTV, TLG, SUVmax, tumor size, and CA125 level were analyzed using Pearson's product‐moment correlation coefficient and the χ2‐test or Fisher's exact test. Cut‐off values of MTV, TLG, and SUVmax were decided by ROC curves, that of tumor size was the median, and that of CA125 was the baseline (≥35 UI/mL). The patients were divided into two subgroups using each cut‐off value; then the subgroups of MTV, TLG, and SUVmax were compared using Kaplan–Meier estimation and the log–rank test. A Cox proportional hazards model was used to fit the data from multivariable features. Statistical analysis was carried out by spss software 21.0 for Windows (IBM, Armonk, NY, USA).
Results
Patient characteristics
Thirty‐seven newly diagnosed EOC patients underwent 18F‐FDG PET/CT before treatment. The median age of the patients was 64 years (range, 29–87 years). Nineteen patients had recurrence during the follow‐up period. The patients' clinicopathological characteristics are listed in Table 1. The mean duration of clinical follow‐up was 39.6 ± 18.95 months (median, 38 months). The 2‐year disease PFS rate was 40.5%, and the median PFS time was 23.9 months. The tumors in 19 patients were serous carcinoma. Non‐serous carcinomas included mucinous carcinoma, clear‐cell carcinoma, and poorly differentiated carcinoma. Optimal surgery was carried out in 31 patients (83.8%), and suboptimal surgery was carried out in six patients (16.2%).
Table 1.
Clinicopathological characteristics of patients with epithelial ovarian cancer who participated in this study (n = 37)
| Feature | Value |
|---|---|
| Age, years, median (range) | 64 (29–87) |
| Serum CA125 level, n, ≤35 UI/mL/>35 UI/mL | 4/33 |
| Tumor size, cm, mean ± SD | 10.4 ± 4.3 |
| FIGO stage, n, I or II/III or IV | 10/27 |
| Pathology, n, serous/non serous | 19/18 |
| Operation, n, optimal/suboptimal | 31/6 |
CA125, carbohydrate antigen 125; FIGO, International Federation of Obstetrics and Gynecology.
Correlations between clinicopathological features and MTV, TLG, SUVmax, tumor size, and baseline serum CA125
The mean values of MTV, TLG, and SUVmax were 49.3 ± 91.4, 338.1 ± 795.0, and 10.4 ± 4.2, respectively. Metabolic tumor volume correlated with CA125 (r = 0.547, P < 0.001); TLG correlated with SUVmax and CA125 (SUVmax, r = 0.437, P = 0.007; CA125, r = 0.593, P < 0.001) (Fig. 2). Tumor size did not correlate with any features. As shown in Table 2, patients with high MTV, TLG, and SUVmax were likely to have tumors with high FIGO stage (P = 0.062, 0.008, and 0.067, respectively).
Figure 2.
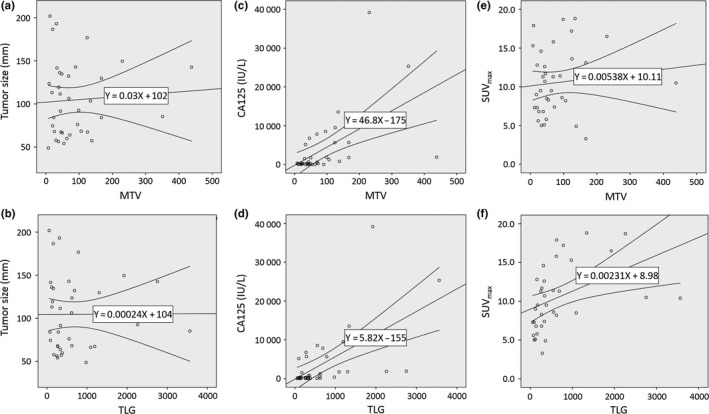
Correlations between metabolic tumor volume (MTV) and total lesion glycolysis (TLG) and tumor size (a, b), serum carbohydrate antigen 125 (CA125) level (c, d) and maximum standardized uptake value (SUVmax) (e, f).
Table 2.
Correlations between clinicopathological features and metabolic tumor volume (MTV), total lesion glycolysis (TLG), tumor size, serum carbohydrate antigen 125 (CA125) level, and maximum standardized uptake value (SUVmax) in patients with epithelial ovarian cancer (n = 37)
| Feature | MTV | TLG | Tumor size, cm | Serum CA125 level, IU/mL | SUVmax | ||||||||||
|---|---|---|---|---|---|---|---|---|---|---|---|---|---|---|---|
| <51.75 | ≥51.75 | P‐value | <348 | ≥348 | P‐value | <9.2 | ≥9.2 | P‐value | <35 | ≥35 | P‐value | <9.25 | ≥9.25 | P‐value | |
| n | 19 | 18 | 19 | 18 | 18 | 19 | 4 | 33 | 16 | 21 | |||||
| Age, years | |||||||||||||||
| <64 | 10 | 8 | 0.746 | 9 | 9 | 1.000 | 7 | 11 | 0.330 | 2 | 17 | 1.000 | 8 | 10 | 1.000 |
| ≥64 | 9 | 10 | 10 | 9 | 11 | 8 | 2 | 16 | 8 | 11 | |||||
| Stage | |||||||||||||||
| I or II | 8 | 2 | 0.062 | 9 | 1 | 0.008 | 4 | 6 | 0.714 | 2 | 8 | 0.557 | 7 | 3 | 0.067 |
| III or IV | 11 | 16 | 10 | 17 | 14 | 13 | 2 | 25 | 9 | 18 | |||||
| Pathology | |||||||||||||||
| Serous | 7 | 12 | 0.103 | 6 | 13 | 0.022 | 10 | 9 | 0.746 | 0 | 19 | 0.046 | 7 | 12 | 0.515 |
| Non‐serous | 12 | 6 | 13 | 5 | 8 | 10 | 4 | 14 | 9 | 9 | |||||
| Operation | |||||||||||||||
| Optimal | 4 | 2 | 0.660 | 2 | 4 | 0.405 | 4 | 2 | 0.405 | 0 | 6 | 1.000 | 2 | 4 | 0.680 |
| Suboptimal | 15 | 16 | 17 | 14 | 14 | 17 | 4 | 27 | 14 | 17 | |||||
Receiver operating characteristic curve of MTV, TLG, and SUVmax
Figure 3 shows the ROC curve of MTV, TLG, and SUVmax in PFS. The AUC of MTV, TLG, and SUVmax was 0.716, 0.758, and 0.570, respectively. The cut‐off values of MTV, TLG, and SUVmax were 51.8, 348.0, and 9.3, respectively, which were determined by the ROC curves.
Figure 3.
Receiver operating characteristic (ROC) analyses for determination of the cut‐off value of metabolic tumor volume (MTV) (a), total lesion glycolysis (TLG) (b), and maximum standardized uptake value (SUVmax) (c) for predicting progression‐free survival (PFS) in patients with epithelial ovarian cancer.
Predictive value of MTG, TLG, and SUVmax
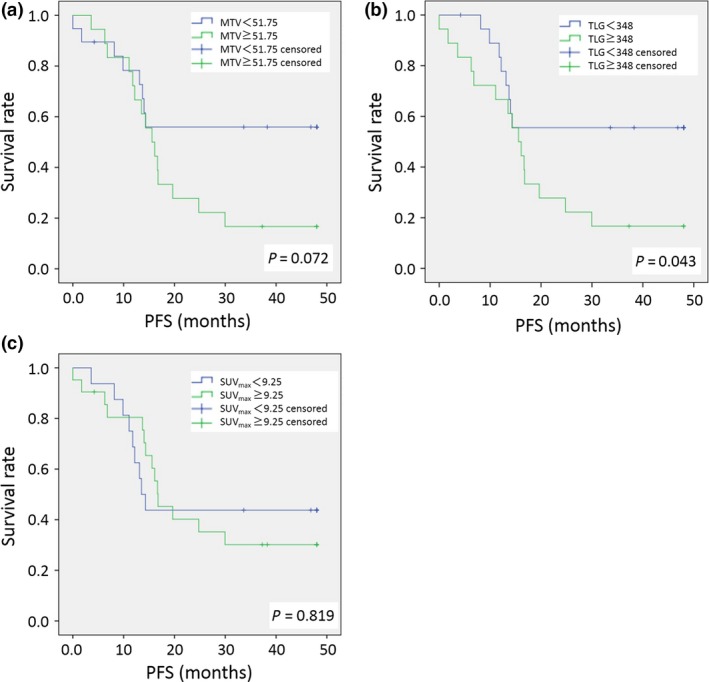
Kaplan–Meier analysis showed a significant difference in PFS between the groups categorized by TLG (P = 0.043; log–rank test). That of MTV and SUVmax did not show a significant difference (Fig. 4). Univariate analysis indicated that age, histological type (serous or non‐serous tumor), kind of operation (optimal surgery or suboptimal surgery), and TLG were statistically significant risk factors for poor PFS (Table 3). Univariate analysis of MTV, SUVmax, CA125, tumor size, and FIGO stage indicated no significant differences in poor PFS. Multivariate analysis adjusted according to clinicopathological features was carried out for MTV, TLG, SUVmax, tumor size, and CA125. Only TLG showed a significant difference (P = 0.038), and a 3.915‐fold increase in the hazard ratio of PFS.
Figure 4.
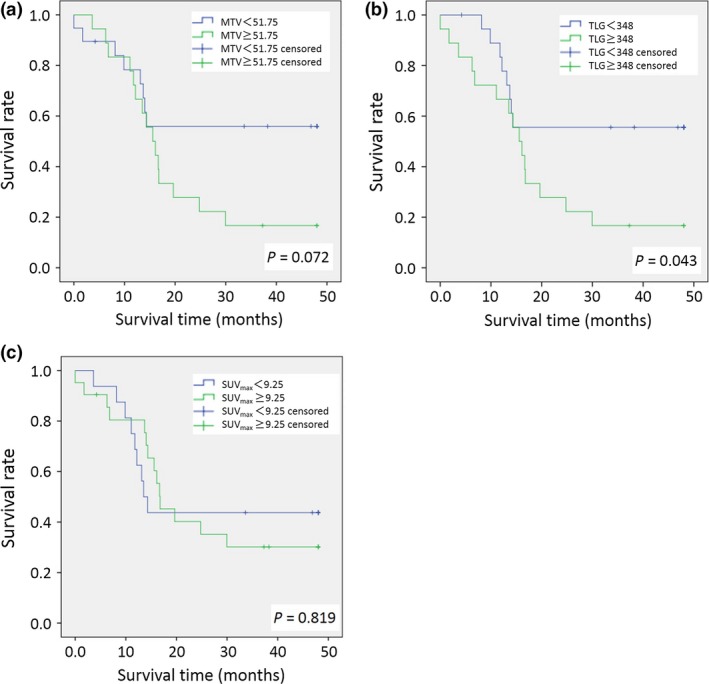
Kaplan–Meier survival graphs of metabolic tumor volume (MTV) (a), total lesion glycolysis (TLG) (b), and maximum standardized update value (SUVmax) (c) in patients with epithelial ovarian cancer.
Table 3.
Univariate and multivariate Cox proportional hazards models of progression‐free survival in patients with epithelial ovarian cancer (n = 37)
| Feature | Hazard ratio | P‐value |
|---|---|---|
| Univariate analysis | ||
| Age, <64 years versus ≥64 years | 2.714 | 0.025 |
| Stage, I or II versus III or IV | 3.673 | 0.037 |
| Pathology, serous versus non‐serous | 0.402 | 0.040 |
| Operation, optimal versus sub‐optimal | 0.129 | <0.001 |
| MTV, <51.75 versus ≥51.75 | 2.171 | 0.079 |
| TLG, <348 versus ≥348 | 2.374 | 0.050 |
| SUVmax, <9.25 versus ≥9.25 | 1.103 | 0.819 |
| CA125, <35 IU/mL versus ≥35 IU/mL | 1.352 | 0.684 |
| Tumor size, ≥9.2 cm versus <9.2 cm | 0.616 | 0.250 |
| Multivariate analysisa | ||
| MTV, <51.75 versus ≥51.75 | 2.369 | 0.081 |
| TLG, <348 versus ≥348 | 3.915 | 0.038 |
| SUVmax, <9.25 versus ≥9.25 | 0.945 | 0.909 |
| CA125, <35 IU/mL versus ≥35 IU/mL | 0.464 | 0.394 |
| Tumor size, ≥9.2 cm versus <9.2 cm | 0.766 | 0.591 |
Each variable was adjusted for age, International Federation of Obstetrics and Gynecology (FIGO) stage, pathology, and kind of operation. CA125, carbohydrate antigen 125; MTV, metabolic tumor volume; SUVmax, maximum standardized uptake value; TLG, total lesion glycolysis.
Discussion
This study reviewed patients with primary EOC who underwent scheduled primary cytoreductive surgery followed by adjuvant platinum‐based chemotherapy, in which assessment of metabolic tumor burden as determined by 18F‐FDG PET/CT in terms of MTV and TLG was used to predict PFS. Only TLG was found to be an independent predictive factor for outcome. Both MTV and TLG showed correlation with baseline serum CA125 level in reflecting the burden of viable tumor cells, and better predicted the risk of recurrence than SUVmax or tumor size.
Regarding primary EOC, only two previous studies have investigated the predictive value of volumetric parameters obtained by preoperative 18F‐FDG PET/CT. Chung et al.7 analyzed preoperative 18F‐FDG PET/CT in 55 patients with EOC before surgery. The results of their study showed that higher values of both MTV and TLG were associated with poor clinical outcomes, and that MTV and TLG were statistically significant predictive values of recurrence. Additionally, Chung et al.7 pointed out that MTV was more predictive of recurrence than TLG. However, Lee et al.8 reported that TLG was more predictive of recurrence than MTV, and also used multivariate analysis to show that TLG and tumor stage were independent factors for PFS. Our study indicated that TLG was a statistically significant risk factor for poor PFS according to univariate analysis.
The differences between the studies of Chung et al., Lee et al., and our study seem to be the methodology of measuring MTV and TLG and the various clinical characteristics of the enrolled patients. The study populations of Chung's study and our study had higher percentages of patients with advanced‐stage disease than Lee's study. In Chung's study and Lee's study, not all patients received platinum‐based adjuvant chemotherapy after operation (94.6% in the study of Chung et al.; 94.9% in the study of Lee et al.). In our study, 100% of patients received platinum‐based adjuvant chemotherapy. Whereas we recognize that a similarity in the high percentage of patients with advanced‐stage disease who received adjuvant platinum‐based chemotherapy may have existed between Chung's study and our study, it seems to us that the proportion of patients receiving adjuvant platinum‐based chemotherapy following optimal surgery was quite different (Chung et al. 61.8% vs. our study 83.8%). The median duration of PFS was 11 months in the Chung study and 23.9 months in our study.
Primary cytoreductive surgery followed by platinum‐based combination chemotherapy is the cornerstone of management for advanced EOC, and optimal cytoreduction is one of the most significant predictors of survival.9 On the contrary, other investigators have emphasized that the prognosis of EOC depends on the biologic behavior of the tumor rather than on surgical intervention.10, 11, 12 There are no up‐to‐date, clear, specific data on the association between the biologic behavior of EOC and optimal cytoreduction. However, it is clear that multiple factors impact patient survival including optimal cytoreduction and biologic behavior. Our study had less heterogeneity in the ratio of patients who underwent cytoreductive surgery than Chung's study. Thus, our study showed that metabolic tumor burden reflects the biological behavior of EOC more directly than Chung's study.
It is well known that 18F‐FDG PET/CT strategies are now commonplace in assessing changes in flux through glycolysis.13 18F‐FDG PET/CT is important for assessing the heterogeneity in glycolytic status in tumors. Warburg proposed that glycolytic shift was due to defects in mitochondrial function leading to impaired oxidative phosphorylation.14 Additionally, it has been shown that mitochondrial dysfunction provides a survival advantage to cancer cells, suggesting that mitochondria have a tumor suppressor function. This mitochondrial dysfunction promotes resistance to apoptosis induction due to mislocalization of the proapoptotic factors and reduced processing of apoptotic‐related genes. These genetic and metabolic mitochondrial alterations relating to energy metabolism are implicated in the modulation of drug sensitivity in cancer cells.15 Studies with cells that underwent chemically induced partial or total depletion of mitochondrial function have supported a role for mitochondrial dysfunction in cancer drug resistance. It has been reported that partial or total depletion of mitochondrial function causes cancer cells to become less sensitive to the chemotherapeutic drugs cisplatin and paclitaxel.16
Kurokawa et al.17 reported that FDG uptake is statistically related to intensity of GLUT‐1 expression and histologic grade in epithelial ovarian tumor. Expression of GLUT‐1 was shown to be the strongest parameter predicting positive FDG uptake. Expression of GLUT‐1 in epithelial ovarian tumor tissue increased gradually from borderline to malignant tumors, and FDG uptake as estimated by SUV showed the strongest correlation with staining intensity of GLUT‐1. It is reasonable to suppose that the value of glucose consumption as calculated by SUV in 18F‐FDG PET/CT predicts the level of GLUT‐1 in ovarian epithelial tumors.17
Although no study has yet explored the possible correlation between GLUT‐1 expression and chemosensitivity of EOC, recently, the relationship between GLUT‐1 expression and chemosensitivity of some human cancer cell lines has received more attention.18, 19, 20, 21 This may be because elevated GLUT‐1 expression provides energy to malignant tumors, allowing development of chemoradioresistance. GLUT‐1 causes chemoresistance by increasing cell turnover22 and upregulates the expression levels of the multidrug resistance‐123 and P‐glycoprotein genes.24 Overexpression of GLUT‐1 mRNA may be associated with the resistance to cisplatin of laryngeal carcinoma Hep‐2 cells.25 Based on these facts, it is possible to estimate or predict PFS according to the effect of chemosensitivity by using pretherapeutic PET/CT, if FDG accumulation of the tumor can be accurately measured.
Currently, measurement of tumor glycolytic shift by using SUVmax is widely used as an indicator of metabolic activity for various malignancies.26 However, SUVmax only represents the highest metabolic activity within the tumor and does not take the tumor extent into account. In contrast, MTV takes into account the metabolic active volume of all tumor lesions, which is the sum of voxels over 40% of SUVmax. Furthermore, TLG encompasses both the level of tumor glucose utilization and the volume of metabolically active tumor lesions. Thus, a large TLG can reflect a small volume of tumor lesion with high FDG uptake or a large volume with low FDG uptake.7, 8 Because TLG reflects both metabolic burden and disease extent, it can provide valuable information on whole‐tumor glycolytic activity and also provide predictive information for EOC patients who receive platinum‐based adjuvant chemotherapy after cytoreductive surgery. The results of our study showed that TLG was the only independent prognostic factor among several important factors in primary EOC patients.
It is well known that CA125 levels of <35 IU/mL are now accepted as normal in monitoring the course of EOC.27, 28 Gupta and Lis29 reviewed the usefulness of CA125 levels in monitoring the progress of patients with EOC. Regarding epidemiologic studies on the association between absolute post‐chemotherapy CA125 levels and survival in EOC, three retrospective studies, three prospective studies, and one consecutive case series study have been conducted. These seven studies showed that post‐chemotherapy serum CA125 level is a good prognostic indicator for survival. Additionally, these studies suggested that patients with serum CA125 values within the normal range (<35 IU/mL) after chemotherapy had significantly longer overall survival and PFS than did patients whose CA125 levels remained high after chemotherapy.29 This is the rationale for the CA125 cut‐off level of 35 IU/mL in the present study.
In this study, we analyzed the relationship between serum CA125 and TLG, MTV, and SUVmax. CA125 was linearly correlated with MTV and TLG. Univariate analysis revealed that serum CA125 did not show any significant difference for prediction of ovarian cancer recurrence, but TLG showed significant correlation for prediction of ovarian cancer recurrence. This may be the reason for the lack of specificity of serum CA125; but measurement of CA125 is clinically useful because of its high sensitivity and its simplicity.
Tumor size, reflecting pathological tumor burden, has not been found to be associated with survival in patients with primary ovarian cancer.30, 31, 32 Our study results also did not reveal any tendency toward an association of tumor size with outcome in patients who received platinum‐based adjuvant chemotherapy after cytoreductive surgery.
Both FIGO stage and optimal cytoreduction at debulking surgery are well known prognostic factors of survival in patients with primary ovarian cancer.33, 34, 35 In the present study, FIGO stage showed a tendency, but without statistical significance, for association with outcome in patients who received platinum‐based adjuvant chemotherapy after cytoreductive surgery. However, there was a significant association between optimal surgery and serous histology type with good outcome in those patients. These facts indicate that in patients with ovarian primary tumor, not only FIGO stage, but also chemosensitivity of primary tumor are important for prediction of survival associated with histological type and volume of residual tumor after cytoreductive surgery. Total lesion glycolysis reflects both the metabolic burden and disease extent, assessing heterogeneous changes in flux through glycolysis associated with chemoresistance, and may be an important factor for prediction in EOC. One of the reasons is that ovarian cancer patients have a high recurrence rate despite undergoing optimal primary cytoreductive surgery.
The major limitations of this study were the retrospective study design, data collection from only a single center, and the relatively small sample size. Our study used detailed electronic FDG PET/CT imaging data and a uniform institutional ovarian cancer data system for medical records, together with follow‐up to strengthen the findings of the data. Despite the study's limitations, this is the first report on the predictive performance of metabolic tumor burden measured by 18F‐FDG PET/CT (MTV and TLG) in ovarian cancer patients who received platinum‐based adjuvant chemotherapy after cytoreductive surgery. The interesting findings of this study indicate an urgent need for a prospective multicenter validation study using standardized protocols across different FDG PET/CT scanners.
In summary, the present study provided evidence to support the clinical significance of metabolic tumor burden measured by FDG PET/CT imaging in primary ovarian cancer patients who undergo scheduled primary cytoreductive surgery followed by adjuvant platinum‐based chemotherapy. Only TLG was found to be an independent predictor based on multivariate analysis of PFS, and was a more effective predictor than MTV, serum CA125 level, SUVmax, and tumor size. Total lesion glycolysis could serve as a potential surrogate biomarker for recurrence in patients who undergo primary cytoreductive surgery followed by platinum‐based chemotherapy, and could assist in identifying patients at high risk for recurrence who need more aggressive treatment.
Disclosure Statement
The authors have no conflict of interest.
Abbreviations
- AUC
area under the plasma concentration–time curve
- CA125
carbohydrate antigen 125
- EOC
epithelial ovarian cancer
- 18F‐FDG PET/CT
positron emission tomography–computed tomography using 18F‐fludeoxyglucose
- FIGO
International Federation of Obstetrics and Gynecology
- GLUT‐1
glucose transporter 1
- MTV
metabolic tumor volume
- ROC
receiver operating characteristic
- PFS
progression‐free survival
- SUVmax
maximum standardized uptake value
- TLG
total lesion glycolysis
Acknowledgments
This study was partially funded by a Grant‐in‐Aid for Scientific Research from the Japan Society for the Promotion of Science (15H04981).
Cancer Sci 107 (2016) 478–485
Funding Information
Japan Society for the Promotion of Science (15H04981).
References
- 1. Tingulstad S, Skjeldestad FE, Halvorsen TB, Hagen B. Survival and prognostic factors in patients with ovarian cancer. Obstet Gynecol 2003; 101: 885–91. [DOI] [PubMed] [Google Scholar]
- 2. Mury D, Woelber L, Jung S et al Prognostic and predictive relevance of CA‐125 at primary surgery of ovarian cancer. J Cancer Res Clin Oncol 2011; 137: 1131–7. [DOI] [PMC free article] [PubMed] [Google Scholar]
- 3. van Altena AM, Kolwijck E, Spanjer MJ, Hendriks JC, Massuger LF, de Hullu JA. CA125 nadir concentration is an independent predictor of tumor recurrence in patients with ovarian cancer: a population‐based study. Gynecol Oncol 2010; 119: 265–9. [DOI] [PubMed] [Google Scholar]
- 4. Kim HS, Park NH, Chung HH, Kim JW, Song YS, Kang SB. Serum CA‐125 level after 6 cycles of primary adjuvant chemotherapy is a useful prognostic factor for complete responders' survival in patients with advanced epithelial ovarian cancer. Oncol Res Treat 2008; 31: 315–20. [DOI] [PubMed] [Google Scholar]
- 5. Konishi H, Takehara K, Kojima A et al Maximum standardized uptake value of fluorodeoxyglucose positron emission tomography/computed tomography is a prognostic factor in ovarian clear cell adenocarcinoma. Int J Gynecol Cancer 2014; 24: 1190–4. [DOI] [PubMed] [Google Scholar]
- 6. Risum S, Loft A, Høgdall C et al Standardized FDG uptake as a prognostic variable and as a predictor of incomplete cytoreduction in primary advanced ovarian cancer. Acta Oncol 2011; 50: 415–9. [DOI] [PubMed] [Google Scholar]
- 7. Chung HH, Kwon HW, Kang KW et al Prognostic value of preoperative metabolic tumor volume and total lesion glycolysis in patients with epithelial ovarian cancer. Ann Surg Oncol 2012; 19: 1966–72. [DOI] [PubMed] [Google Scholar]
- 8. Lee JW, Cho A, Lee JH et al The role of metabolic tumor volume and total lesion glycolysis on ¹⁸F‐FDG PET/CT in the prognosis of epithelial ovarian cancer. Eur J Nucl Med Mol Imaging 2014; 41: 1898–906. [DOI] [PubMed] [Google Scholar]
- 9. Chang SJ, Bristow RE. Evolution of surgical treatment paradigms for advanced‐stage ovarian cancer: redefining ‘optimal’ residual disease. Gynecol Oncol 2012; 125: 483–92. [DOI] [PubMed] [Google Scholar]
- 10. Covens AL. A critique of surgical cytoreduction in advanced ovarian cancer. Gynecol Oncol 2000; 78: 269–74. [DOI] [PubMed] [Google Scholar]
- 11. Berman ML. Future directions in the surgical management of ovarian cancer. Gynecol Oncol 2003; 90: S33. [DOI] [PubMed] [Google Scholar]
- 12. Crawford SC, Vasey PA, Paul J, Hay A, Davis JA, Kaye SB. Does aggressive surgery only benefit patients with less advanced ovarian cancer? Results from an international comparison within the SCOTROC‐1 trial. J Clin Oncol 2005; 23: 8802–11. [DOI] [PubMed] [Google Scholar]
- 13. de Geus‐Oei LF, Vriens D, van Laarhoven HW, van der Graaf WT, Oyen WJ. Monitoring and predicting response to therapy with 18F‐FDG PET in colorectal cancer: a systematic review. J Nucl Med 2009; 50: 43S–54S. [DOI] [PubMed] [Google Scholar]
- 14. Vander Heiden MG, Cantley LC, Thompson CB. Understanding the Warburg effect: the metabolic requirements of cell proliferation. Science 2009; 324: 1029–33. [DOI] [PMC free article] [PubMed] [Google Scholar]
- 15. Levine AJ, Puzio‐Kuter AM. The control of the metabolic switch in cancers by oncogenes and tumor suppressor genes. Science 2010; 330: 1340–4. [DOI] [PubMed] [Google Scholar]
- 16. Warmoes MO, Locasale JW. Heterogeneity of glycolysis in cancers and therapeutic opportunities. Biochem Pharmacol 2014; 92: 12–21. [DOI] [PMC free article] [PubMed] [Google Scholar]
- 17. Kurokawa T, Yoshida Y, Kawahara K et al Expression of GLUT‐1 glucose transfer, cellular proliferation activity and grade of tumor correlate with [F‐18]‐fluorodeoxyglucose uptake by positron emission tomography in epithelial tumors of the ovary. Int J Cancer 2004; 109: 926–32. [DOI] [PubMed] [Google Scholar]
- 18. Abouzeid AH, Patel NR, Rachman IM, Senn S, Torchilin VP. Anti‐cancer activity of anti‐GLUT1 antibody‐targeted polymeric micelles co‐loaded with curcumin and doxorubicin. J Drug Target 2013; 21: 994–1000. [DOI] [PubMed] [Google Scholar]
- 19. Wang YD, Li SJ, Liao JX. Inhibition of glucose transporter 1 (GLUT1) chemosensitized head and neck cancer cells to cisplatin. Technol Cancer Res Treat 2013; 12: 525–35. [DOI] [PubMed] [Google Scholar]
- 20. Chan DA, Sutphin PD, Nguyen P et al Targeting GLUT1 and the Warburg effect in renal cell carcinoma by chemical synthetic lethality. Sci Transl Med 2011; 3: 94ra70. [DOI] [PMC free article] [PubMed] [Google Scholar]
- 21. Shimanishi M, Ogi K, Sogabe Y et al Silencing of GLUT‐1 inhibits sensitization of oral cancer cells to cisplatin during hypoxia. J Oral Pathol Med 2013; 42: 382–8. [DOI] [PubMed] [Google Scholar]
- 22. Evans A, Bates V, Troy H et al Glut‐1 as a therapeutic target: increased chemoresistance and HIF‐1‐independent link with cell turnover is revealed through COMPARE analysis and metabolomic studies. Cancer Chemother Pharmacol 2008; 61: 377–93. [DOI] [PubMed] [Google Scholar]
- 23. Vishvakarma NK, Kumar A, Singh V, Singh SM. Hyperglycemia of tumor microenvironment modulates stage‐dependent tumor progression and multidrug resistance: implication of cell survival regulatory molecules and altered glucose transport. Mol Carcinog 2013; 52: 932–45. [DOI] [PubMed] [Google Scholar]
- 24. Seo S, Hatano E, Higashi T et al P‐glycoprotein expression affects 18F‐fluorodeoxyglucose accumulation in hepatocellular carcinoma in vivo and in vitro. Int J Oncol 2009; 34: 1303–12. [PubMed] [Google Scholar]
- 25. Xu YY, Wu TT, Zhou SH et al Apigenin suppresses GLUT‐1 and p‐AKT expression to enhance the chemosensitivity to cisplatin of laryngeal carcinoma Hep‐2 cells: an in vitro study. Int J Clin Exp Pathol 2014; 7: 3938–47. [PMC free article] [PubMed] [Google Scholar]
- 26. Lee JW, Lee JH, Cho A et al The performance of contrast‐enhanced FDG PET/CT for the differential diagnosis of unexpected ovarian mass lesions in patients with nongynecologic cancer. Clin Nucl Med 2015; 40: 97–102. [DOI] [PubMed] [Google Scholar]
- 27. Bast RC Jr, Klug TL, St John E et al A radioimmunoassay using a monoclonal antibody to monitor the course of epithelial ovarian cancer. N Engl J Med 1983; 309: 883–7. [DOI] [PubMed] [Google Scholar]
- 28. Díaz‐Padilla I, Razak AR, Minig L, Bernardini MQ, María Del Campo J. Prognostic and predictive value of CA‐125 in the primary treatment of epithelial ovarian cancer: potentials and pitfalls. Clin Transl Oncol 2012; 14: 15–20. [DOI] [PubMed] [Google Scholar]
- 29. Gupta D, Lis CG. Role of CA125 in predicting ovarian cancer survival – a review of the epidemiological literature. J Ovarian Res 2009; 2: 13. [DOI] [PMC free article] [PubMed] [Google Scholar]
- 30. Farghaly SA. Current diagnosis and management of ovarian cysts. Clin Exp Obstet Gynecol 2014; 41: 609–12. [PubMed] [Google Scholar]
- 31. Vargas HA, Miccò M, Hong SI et al Association between morphologic CT imaging traits and prognostically relevant gene signatures in women with high‐grade serous ovarian cancer: a hypothesis‐generating study. Radiology 2015; 274: 742–51. [DOI] [PMC free article] [PubMed] [Google Scholar]
- 32. Baser E, Gungor T, Togrul C, Turkoglu O, Celen S. Preoperative prediction of poor prognostic parameters and adjuvant treatment in women with pure endometrioid type endometrial cancer: what is the significance of tumor markers? Eur J Gynaecol Oncol 2014; 35: 513–8. [PubMed] [Google Scholar]
- 33. Obeidat B, Latimer J, Crawford R. Can optimal primary cytoreduction be predicted in advanced stage epithelial ovarian cancer? Role of preoperative serum CA‐125 level. Gynecol Obstet Invest 2004; 57: 153–6. [DOI] [PubMed] [Google Scholar]
- 34. Fotopoulou C, Savvatis K, Kosian P et al Quaternary cytoreductive surgery in ovarian cancer: does surgical effort still matter? Br J Cancer 2013; 108: 32–8. [DOI] [PMC free article] [PubMed] [Google Scholar]
- 35. Athavale R, Thomakos N, Godfrey K et al The effect of epithelial and stromal tumor components on FIGO stages III and IV ovarian carcinosarcomas treated with primary surgery and chemotherapy. Int J Gynecol Cancer 2007; 17: 1025–30. [DOI] [PubMed] [Google Scholar]