

Abstract
Several molecular targeting drugs are being evaluated for endometrial cancer; selecting patients whose cancers are sensitive to these agents is of paramount importance. Previously, we developed the cancer tissue‐originated spheroid method for primary cancer cells taken from patients’ tumors as well as patient‐derived xenografts. In this study, we successfully prepared and cultured cancer tissue‐originated spheroids from endometrial cancers. Characteristics of the original tumors were well retained in cancer tissue‐originated spheroids including morphology and expression of p53 or neuroendocrine markers. We screened 79 molecular targeting drugs using two cancer tissue‐originated spheroid lines derived from endometrioid adenocarcinoma grade 3 and serous adenocarcinoma. Among several hits, we focused on everolimus, a mammalian target of rapamycin complex 1 inhibitor, and YM155, a survivin inhibitor. When sensitivity to everolimus or YM155 was assessed in 12 or 11 cancer tissue‐originated spheroids, respectively, from different endometrial cancer patients, the sensitivity varied substantially. The cancer tissue‐originated spheroids sensitive to everolimus showed remarkable suppression of proliferation. The phosphorylation status of the mammalian target of rapamycin complex 1 downstream molecules before and after everolimus treatment did not predict the effect of the drug. In contrast, the cancer tissue‐originated spheroids sensitive to YM155 showed remarkable cell death. The effect of YM155 was also confirmed in vivo. The histological type correlated with YM155 sensitivity; non‐endometrioid adenocarcinomas were sensitive and endometrioid adenocarcinomas were resistant. Non‐canonical autophagic cell death was the most likely cause of cell death in a sensitive cancer tissue‐originated spheroid. Thus, sensitivity assays using cancer tissue‐originated spheroids from endometrial cancers may be useful for screening drugs and finding biomarkers.
Keywords: CTOS, drug screening, endometrial cancer, sensitivity assay, YM155
Endometrial cancer is the most common gynecologic malignancy in the USA and European Union.1, 2 The incidence and mortality rates of the disease are tending to increase worldwide, including in Japan.3 Treatment strategies for endometrial cancer are generally based on surgery if the tumors are resectable. Adjuvant chemotherapy and/or radiation therapy are used for patients in high risk groups. For patients with inoperable tumors, chemotherapy, radiation, and/or hormone therapy are carried out. According to the International Federation of Gynecology and Obstetrics report in 2006, the 5‐year survival rate is 85–91% for patients with stage I, but <21% for patients with stage IV disease.4 To improve the prognosis, novel treatment strategies must be developed. Many clinical trials are underway, including those evaluating molecular targeting therapies such as inhibitors of the PI3K/mTOR pathway, vascular endothelial growth factor, and EGFR/herceptin‐2.5 So far, none of these have improved overall or disease‐free survival. However, each trial included some patients who achieved CR or PR. Thus, biomarkers predicting CR or PR for each drug are necessary to improve the prognosis.
Genome alterations have been revealed to be predictive biomarkers of some molecular targeting therapies in some cancers. For example, mutations in EGFR and BCR‐ABL are useful biomarkers of the corresponding molecular targeting inhibitors for selecting patients sensitive to these drugs with lung adenocarcinoma and chronic myelogenous leukemia, respectively.6, 7 On the other hand, KRAS mutations predict resistance of mAbs against EGFR in patients with colorectal cancer.8, 9 Gene mutations present in endometrial cancer have also been intensively researched, although no gene alteration so far is available as a biomarker for each drug. For example, neither gene mutations in the PI3K/mTOR/phosphatase and tensin homolog, PTEN, pathway nor Her2 gene amplification, which is often observed in endometrial cancer,10 predicts the effect of corresponding inhibitors. Detecting single genome alterations is not enough to predict the drug's effect, probably because of the complex signaling network in endometrial cancer cells. To understand this complexity, bioassays in vitro are required.
Recently, we developed a preparation and culture method, the CTOS method, for primary cancer cells from patients’ tumors as well as patient‐derived xenografts.11 With this method, cell–cell contact is maintained throughout the process of preparation and culturing of cancer cells from the tumors. One can efficiently obtain pure cancer cells from various cancers including colon, lung, bladder, prostate, brain, and the uterine cervix. Cancer tissue‐originated spheroids are cultured in spheroid form in a serum‐free medium, which was developed for culturing human embryonic stem cells. The spheroids preserve the original characteristics of cancer cells, both in vitro and in vivo.11, 12, 13, 14
In this study, we applied CTOS technology to endometrial cancer. Spheroids were successfully prepared from endometrial cancers and maintained the original tumor characteristics, as has been seen with other types of cancers. Using CTOS, both from primary tumors and CTOS‐derived xenograft tumors, we screened a panel of molecular targeting drugs and obtained several candidate drugs. Then, we assessed the effects of the drugs on a panel of CTOS derived from different patients’ tumors. We further explored biomarkers for the drugs that correlated with sensitivity in CTOS assays.
Materials and Methods
Cancer tissue‐originated spheroid preparation and culture
This study was approved by the institutional ethics committees at Osaka Medical Center for Cancer and Cardiovascular Diseases and Osaka University (Osaka, Japan). Surgical specimens were obtained from patients treated with hysterectomy at either hospital after providing informed consent. Preparation and culture of CTOS were carried out according to a previously described protocol.11 Briefly, surgical samples or xenograft tumors of NOD/SCID mice were digested with Liberase DH (Roche Applied Science, Mannheim, Germany) and filtered through cell strainers. Fragments on the 100‐ or 40‐μm cell strainer (BD Falcon, Franklin Lakes, NJ, USA) were collected. Cancer tissue‐originated spheroids were cultured in StemPro hESC (Invitrogen, Carlsbad, CA, USA).
Immunohistochemistry
Immunohistochemistry was carried out as previously described.14 The primary antibody against p53 (RTU‐p53‐DO7) was obtained from Novacastra (Newcastle, UK), cleaved caspase‐3 and PCNA (PC10) from Cell Signaling Technologies (Danvers, MA, USA), synaptophysin (clone SY38) from Dako (Glostrup, Denmark), and chromogranin A and LAMP2 (clone GL2A7) from Abcam (Cambridge, UK). After secondary antibody incubation, sections were visualized using a fluorescence method or biotin‐amplified method (NovaRed; Vector Laboratories, Burlingame, CA, USA). Fluorescence images were obtained using confocal microscopy (TCS SPE; Leica Microsystems, Wetzlar, Germany).
Sensitivity assay
An inhibitor kit (Inhibitor kit IV version 2.2) containing 79 molecular targeting drugs was kindly provided by the Screening Committee of Anticancer Drugs (Japan) (Table S1). The inhibitors were diluted with StemPro at doses of 10 nM or 100 nM. One CTOS was placed in one well of a 96‐well plate, and six CTOS were examined for one dose of each drug. After 7 days of culture, CTOS viability was evaluated by measuring intracellular ATP levels (CellTiter‐Glo Luminescent Cell Viability Assay; Promega, Fitchburg, WI, USA), corrected for the CTOS size at day 0. Images were taken using CellInsight CX5 High‐Content Screening Platform (Thermo Fisher Scientific, Waltham, MA, USA), and CTOS size was automatically measured. For the sensitivity assay for each drug, CTOS were cultured in StemPro hESC containing inhibitors at the indicated doses. Cancer tissue‐originated spheroids were exposed to the inhibitors for 7 days. Spheroid viability was evaluated by measuring intracellular ATP levels at day 7 and corrected for the CTOS size at day 0. Images were taken at ×10 magnification using an IX70 microscope (Olympus, Tokyo, Japan), and CTOS size was measured using Adobe Photoshop CS 5.1 (Adobe Systems, San Jose, CA, USA). Half maximal inhibitory concentration (IC50) values were calculated with GraphPad Prism 6 software (GraphPad Software, San Diego, CA, USA) using the sigmoidal dose–response function. For staining of dead cells, PI (Calbiochem, San Diego, CA, USA) was added to the medium at a concentration of 1 μg/mL and incubated at 37°C for 10 min. After CTOS were washed, fluorescence images were obtained. Control CTOS were treated in parallel with respective concentrations of DMSO as a vehicle control.
Reagents
RAD‐001 (everolimus) was purchased from Toronto Research Chemicals (Toronto, ON, Canada), YM155 from Millipore (Billerica, MA, USA), OSI‐027 from Selleckchem (Houston, TX, USA), and 3MA from Sigma‐Aldrich (St. Louis, MO, USA).
Western blot analysis
Western blotting was carried out as previously described.13 Primary antibodies used against pS6 (Ser235/236), caspase‐3, and cleaved caspase‐3 (Asp175), pAKT (T308), pAKT (S473), p4EBP1 (53H11), survivin (71G4B7), EGFR, pERK (Thr202/Tyr204), and γH2AX (Ser139) were obtained from Cell Signaling Technologies. β‐actin was from Sigma‐Aldrich, PARP was from BD Biosciences (San Jose, CA, USA), and LC3 (autophagy APG8b: MAP1LC3B) was from Abgent (San Diego, CA, USA).
Animal studies
Animal studies were carried out in compliance with the guidelines of the institutional animal study committee of Osaka Medical Center for Cancer and Cardiovascular Diseases. A mixture of 200 CTOS in Matrigel was implanted s.c. into the flank of 4‐week‐old female NOD/SCID mice (CLEA Japan, Shizuoka, Japan). YM155 was suspended in saline and administered using an osmotic pump (ALZET mini‐osmotic pump, model 2001; DURECT, Cupertino, CA, USA) to achieve a continuous dose of 5 mg/kg according to the manufacturer's instructions. When the tumor diameter reached 5 mm, the pump was s.c. implanted and removed after 9 days. Tumor volume was measured every 2–3 days and calculated with the formula: 0.5 × width2 × length.
Statistical analysis
Statistical analysis was carried out with GraphPad Prism 6. The statistical significance was tested using unpaired t‐tests. Values of P < 0.05 were considered to indicate statistical significance.
Results
Preparation and culture of CTOS from endometrial cancer
We analyzed 117 tumor samples from patients with endometrial cancer (Tables 1,S2). The CTOS were prepared and cultured as previously described (Fig. 1a).11 The overall success rate of CTOS formation was 92% (108/117). The overall success of CTOS culture in which CTOS were able to be cultured for more than 2 weeks was 62% (72/117) and differed among histological types (Table 1). Among the histological types in which more than five different patient samples were examined, the highest success rate was in serous adenocarcinoma (92%; 11/12). The pattern of CTOS growth represented the original morphological characteristics (Fig. 1b). For example, in CTOS from endometrioid adenocarcinoma grade 1, more than 95% showed multiple budding structures with dark lumens inside. In contrast, in CTOS from endometrioid adenocarcinoma grade 3, more than 50% showed homogenous content with a smooth surface. The CTOS from serous adenocarcinoma showed smaller buddings, reflecting the papillary structure in the original tumors (Fig. 1b). Immunohistochemistry analysis showed that the expression levels of p53 in the original tumors were maintained in CTOS (Fig. 1c). Expression of synaptophysin and chromogranin A were also preserved in CTOS from large cell neuroendocrine carcinomas (Fig. 1d). When CTOS were s.c. injected into NOD/SCID mice, 50% (34/68) generated tumors (Table 1). Morphological characteristics including gland‐like structure, solid growth, and papillary pattern were similar to the respective original tumors (Fig. 1e).
Table 1.
Success rate of cancer tissue‐originated spheroid (CTOS) preparation, culture, and xenograft formation from endometrial cancers
| Histology | CTOS preparation | Xenograft | |||
|---|---|---|---|---|---|
| n | CTOS formation, n (%) | CTOS culture, n (%) | n | Tumor formation, n (%) | |
| EmG1 | 46 | 44 (96) | 27 (59) | 23 | 6 (26) |
| EmG2 | 18 | 15 (83) | 9 (50) | 7 | 5 (71) |
| EmG3 | 16 | 14 (88) | 12 (75) | 10 | 7 (70) |
| Serous | 12 | 12 (100) | 11 (92) | 9 | 7 (78) |
| Carcinosarcoma | 11 | 11 (100) | 6 (55) | 8 | 3 (38) |
| Mixed | 8 | 6 (75) | 5 (63) | 6 | 3 (50) |
| LCNEC | 1 | 1 (100) | 1 (100) | 1 | 1 (100) |
| Clear cell | 2 | 2 (100) | 1 (50) | 1 | 1 (100) |
| Poorly differentiated | 1 | 1 (100) | 0 (0) | 1 | 1 (100) |
| Mucinous | 1 | 1 (100) | 0 (0) | 1 | 0 (0) |
| Adenosarcoma | 1 | 1 (100) | 0 (0) | 1 | 0 (0) |
| Total | 117 | 108 (92) | 72 (62) | 68 | 34 (50) |
EmG, endometrioid adenocarcinoma Grade; Serous, serous adenocarcinoma; Mixed, mixed carcinoma; LCNEC, large cell neuroendocrine carcinoma; Clear cell, clear cell carcinoma; Mucinous, mucinous adenocarcinoma; CTOS formation, >10 CTOS at 24 h after preparation; CTOS culture, >10 viable CTOS at 2 weeks after preparation; n, number of samples
Figure 1.
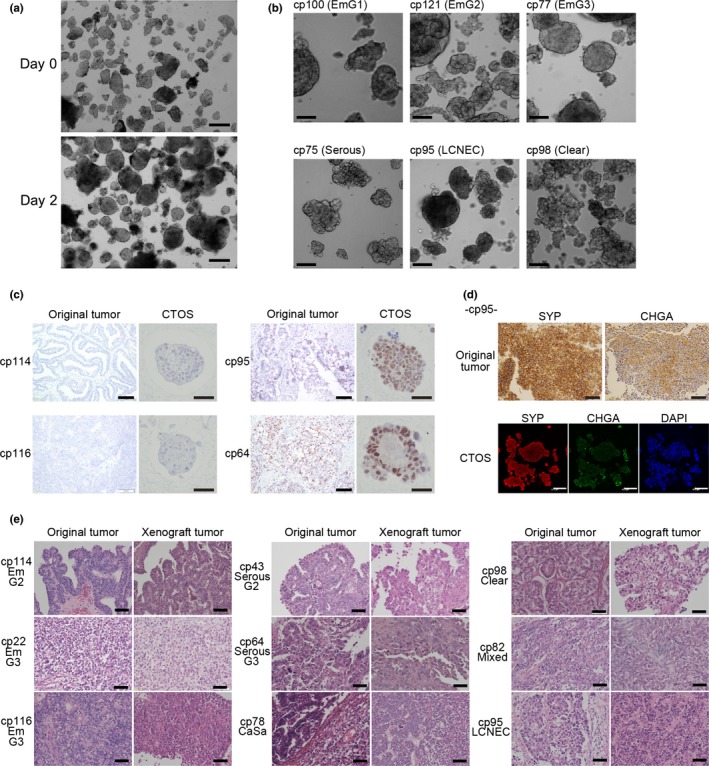
Characteristics of original tumors were preserved in cancer tissue‐originated spheroids (CTOS) from endometrial cancer and their xenografts. (a) Phase contrast images of CTOS from cp116, endometrioid adenocarcinoma grade 3 (EmG3), immediately after preparation (Day 0) and after 2 days of culture (Day 2). Scale bar = 100 μm. (b) Phase contrast images of CTOS from various histological types as indicated. Scale bar = 100 μm. (c) Immunohistochemistry of p53 in original tumors (scale bar = 100 μm) and CTOS (scale bar = 50 μm). (d) Immunohistochemistry of synaptophysin (SYP) and chromogranin A (CHGA) in a large cell neuroendocrine carcinoma (LCNEC) case. Serial sections from the original tumor were stained. Double staining in CTOS. Scale bars: upper panels, 100 μm; lower panels, 50 μm. (e) H&E staining of original tumors and CTOS‐derived xenograft tumors. Scale bar = 50 μm. CaSa, carcinosarcoma; Clear, clear cell carcinoma; Mixed, mixed carcinoma; Serous, serous adenocarcinoma.
Drug screening using CTOS lines
Because the CTOS retained the morphological characteristics of the original tumors, CTOS from individual patient samples might provide a better platform for drug screening. We carried out drug screening using two CTOS lines, cp22 and cp43. Cp22 was derived from an endometrioid adenocarcinoma grade 3, whereas cp43 was from a serous adenocarcinoma. Both CTOS were able to be passaged in vitro. The panel of drugs consisted of 79 different kinds of molecular targeted agents (Table S2). For cp22, two drugs, the proteasome inhibitor bortezomib and the survivin inhibitor YM155, showed remarkable growth suppression at 10 nM (Fig. 2a, Table S2). Two mTORC1 inhibitors, temsirolimus and everolimus, showed moderate effects. For cp43, bortezomib and YM155 were effective, but not temsirolimus nor everolimus (Fig. 2b, Table S2).
Figure 2.
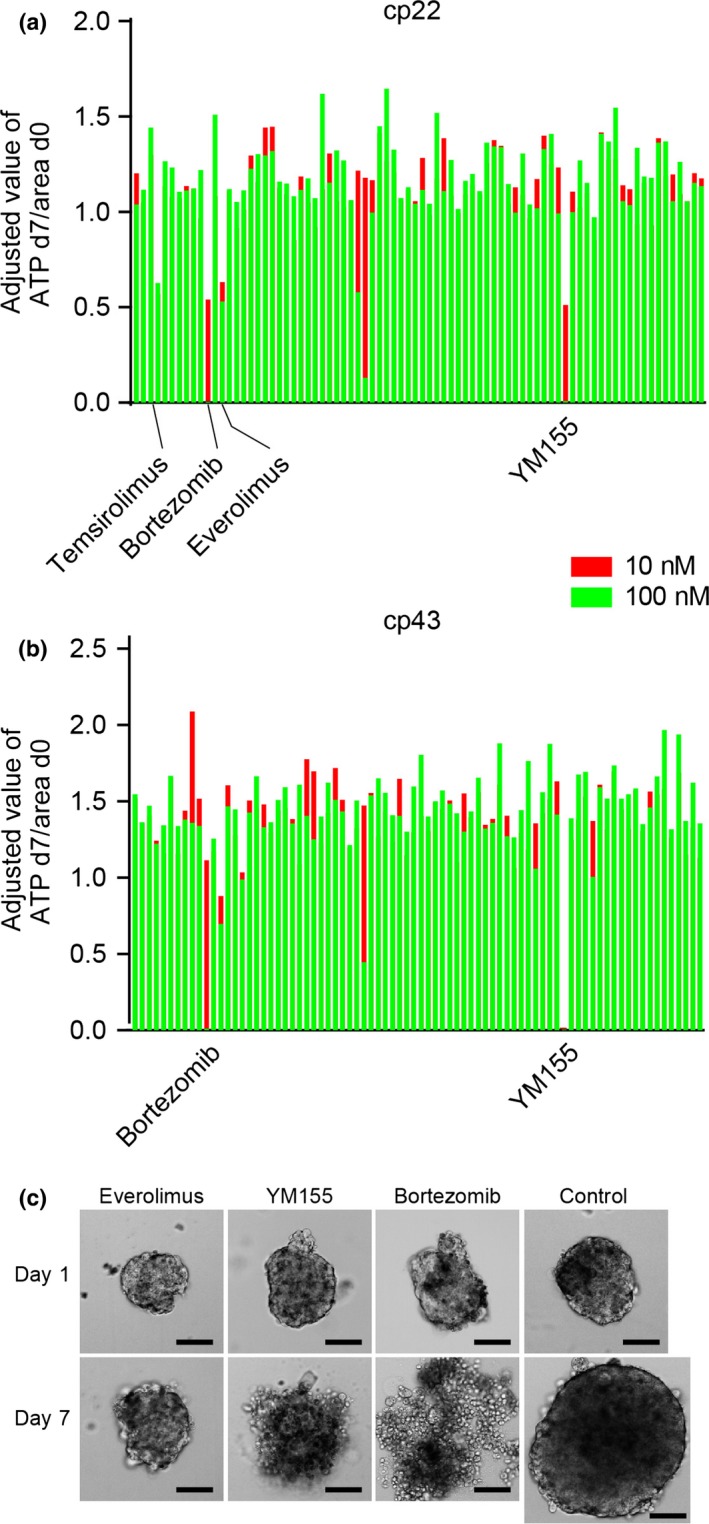
Drug screening using two endometrial cancer tissue‐originated spheroids (CTOS). (a,b) Cp22 (endometrioid adenocarcinoma G3) (a) and cp43 (serous adenocarcinoma) (b) were subjected to a drug screening test using 79 different signaling inhibitors. Each bar indicates an individual drug. Two doses (red bar, 10 nM; green bar, 100 nM) were examined for each drug. Relative ATP values to the control (non‐treated CTOS) at day 7 (d7), adjusted by the area at day 0 (d0), are shown. (c) Phase contrast images of CTOS of cp22 before (day 0) and after 7 days of exposure (day 7) to the indicated drugs. Control is non‐treated CTOS. Scale bar = 100 μm.
As for the gross appearance of cp22 CTOS (Fig. 2c), the CTOS exposed to everolimus did not grow for 7 days, but maintained a spheroid form with a smooth surface, brightness, and transparency. In contrast, the CTOS exposed to bortezomib and YM155 showed a disorganized shape with an irregular surface, and low transparency, which are the characteristics of cell death in CTOS.11
Sensitivity assay for everolimus using a panel of CTOS from different patient tumors
We first selected everolimus for further analysis. Everolimus is a rapalog, which is a class of allosteric inhibitors of mTOR similar to rapamycin, a classical mTOR inhibitor. Everolimus is now in clinical use for treatment of renal cell cancers.15 We assessed the sensitivity to everolimus of 12 CTOS from different endometrial cancer patients. There were substantial differences in sensitivity among different CTOS (Fig. 3a). Consistent with the drug screening, cp22 showed a dose‐dependent response and was the most sensitive among all the CTOS examined. Cp43 was intermediately sensitive. Some of the CTOS showed remarkable resistance. Next, we investigated the mechanism of growth inhibition by everolimus in cp22 CTOS. Treatment with everolimus remarkably inhibited proliferation, with reduced PCNA staining, but a remarkable difference was not observed in cleaved caspase‐3 staining (Fig. 3b). Taken together with the gross appearance (Fig. 2c), growth suppression with everolimus was due to inhibition of proliferation but not induction of cell death.
Figure 3.
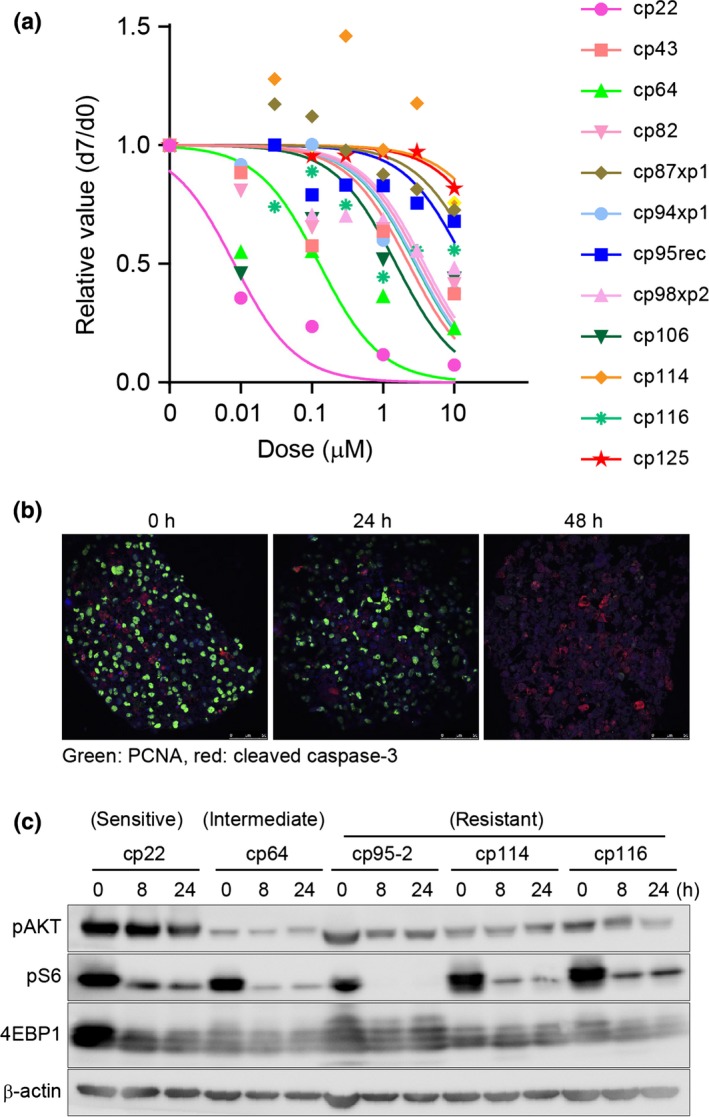
Sensitivity assay and intracellular signaling with a mammalian target of rapamycin complex 1 inhibitor in panels of endometrial cancer tissue‐originated spheroids (CTOS). (a) Dose–response curve for everolimus. Twelve CTOS from different patients’ tumors were examined. CTOS were prepared from original tumors or xenograft tumors. xp1, mouse tumor derived from primary CTOS line. Markers in the graph indicate the median value at each dose. (b) Double staining of cleaved caspase‐3 (red) and proliferating cell nuclear antigen (PCNA; green) in cp22 CTOS after exposure to 1 μM everolimus at the indicated time point. (c) Western blotting of CTOS exposed to 1 μM everolimus. CTOS, time after exposure, and antibodies are indicated. pAKT antibody is against S473. Sensitivity of each CTOS in (a) are shown at the top.
Search for biomarkers of everolimus
Next, we tested whether changes in downstream signaling can act as a biomarker in the CTOS assay. The target of everolimus, mTORC1, is a kinase that phosphorylates multiple signaling molecules, including S6K and 4EBP1, and regulates translation.16 Ribosomal protein S6 is a substrate of S6K.16 We examined the phosphorylation status of those downstream molecules by Western blotting before and after treatment with everolimus (Fig. 3c). In non‐treated CTOS, the phosphorylation status of S6 and 4RBP1 varied among CTOS. When CTOS were treated with 1 μM everolimus, phosphorylation of S6 was remarkably inhibited, even in resistant CTOS. The phosphorylation of 4EBP1 was moderately suppressed in all CTOS, whereas phosphorylation was recovered in some CTOS after 24 h. Feedback activation of AKT was observed only in cp114, a resistant CTOS. Thus, the phosphorylation status of the mTORC1 downstream molecules before and after everolimus treatment cannot act as a clear biomarker for predicting the effect of the drug.
Sensitivity assay for YM155 using a panel of CTOS from different patient tumors
Next, we focused on YM155. YM155 was developed as a small molecule targeting expression of survivin (BIRC5), a member of the IAP family.17 Expression of survivin is reportedly suppressed by YM155, both in vitro and in vivo.17 We assessed the sensitivity to YM155 in 11 CTOS from different endometrial cancer patients. The sensitivity varied among CTOS as was observed with everolimus (Fig. 4a). All CTOS showed clear dose‐dependent responses. Cp22 and cp43, which were used in the initial drug screening, turned out to be the most resistant and sensitive, respectively, of all the CTOS examined. Propidium iodide staining revealed that cp43 showed remarkable cell death without condensation of the nuclei (Fig. 4b).
Figure 4.
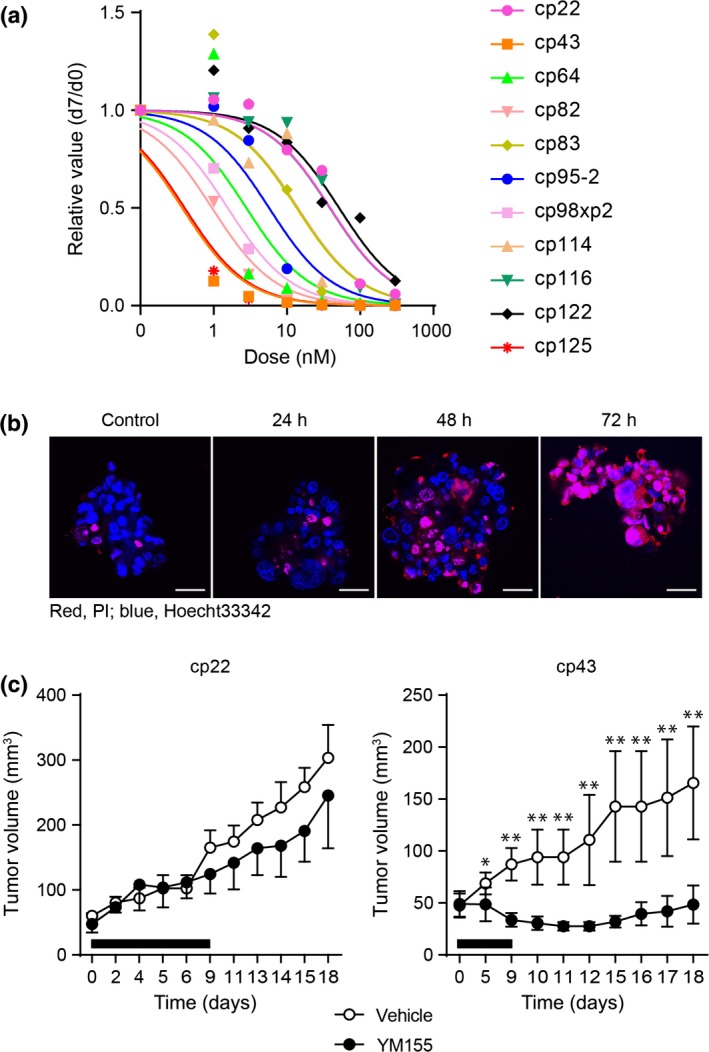
Sensitivity assay with a survivin inhibitor in panels of endometrial cancer tissue‐originated spheroids (CTOS). (a) Dose–response curve for YM155. Eleven CTOS from different patients’ tumors were examined. CTOS were prepared from original tumors or xenograft tumors. xp1, mouse tumor derived from primary CTOS line. Markers in the graph indicate the median value at each dose. (b) Fluorescence images of CTOS (cp43) stained with propidium iodide (PI). The times after exposure to YM155 (10 nM) are indicated. Blue, Hoechst 33342; red, PI. Scale bar = 50 μm. (c) In vivo effect of YM155. Mice with xenografts from cp22 and cp43 were treated with YM155. Tumor volume and the time (days) after initiation of the treatment are indicated. Black bars indicate the period of YM155 treatment. Mean ± SD is shown. Only upper or lower SD values are shown for vehicle‐ or YM155‐treated mice, respectively, in the graph of cp22. Cp22, YM155 (n = 3), vehicle (n = 3); Cp43, YM155 (n = 5), vehicle (n = 6). *P < 0.05; **P < 0.01.
Next, we tested whether the results of the in vitro assay were similar to those of the in vivo assay. Cp43, a sensitive CTOS in vitro, and cp22, a resistant CTOS in vitro, were injected into NOD/SCID mice. Treatment of the mice with YM155 showed significant suppression of tumor growth in mice bearing cp43 but not cp22 tumors compared with vehicle treatment (Fig. 4c).
Search for biomarkers of YM155
Cancer tissue‐originated spheroids were separated into two groups, sensitive (six cases) and resistant (five cases) to YM155 according to the IC50 values of CTOS, to less or more than 10 nM, respectively. Among the clinicopathological parameters examined, the histological type alone correlated with YM155 sensitivity. All CTOS from the non‐endometrioid adenocarcinomas were in the sensitive group (Fig. 5a). The average IC50 values were significantly different (P < 0.002) between the non‐endometrioid and endometrioid groups.
Figure 5.
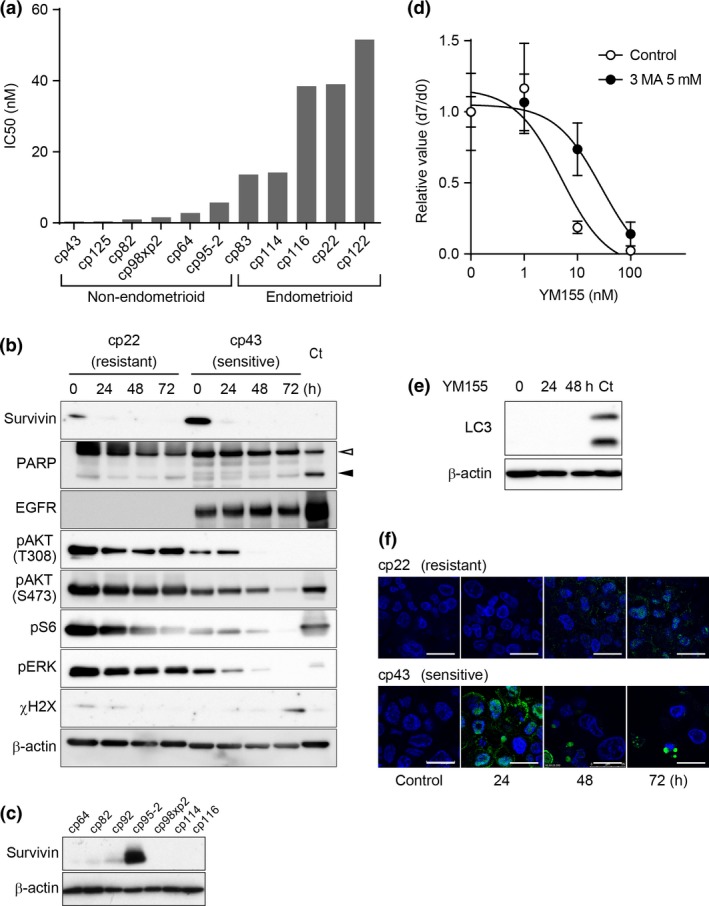
Candidates of biomarkers for YM155 in endometrial cancer tissue‐originated spheroids (CTOS). (a) Correlation between sensitivity to YM155 and histological types of endometrial cancer. CTOS are divided into two groups, endometrioid and non‐endometrioid. Values of the bars indicate the IC 50 for YM155 in Fig. 4a of each CTOS. CTOS are ordered by the IC50 values. (b) Western blotting of CTOS cp43 (sensitive) and cp22 (resistant) exposed to 10 nM YM155. CTOS, time after exposure, and antibodies are indicated. Ct, control: for PARP, mLC1, lung cancer CTOS, 24 h after 10 μg/mL cisplatin exposure, and for γH2AX, mLC5, lung cancer CTOS, 2 h after 5 Gy irradiation. (c) Western blotting of survivin in various CTOS. (d) Dose response curve for cp43 CTOS treated with or without 5 nM 3MA 24 h before exposure to YM155 at the indicated doses. Relative ATP values at day 7 to the control (non‐treated CTOS) adjusted by the area at day 0 are shown. (e) Western blotting of LC3 in cp43 CTOS treated with 10 nM YM155. The times after exposure are shown. Ct, control: MIApaca2, a pancreatic cancer cell line, autophagy‐related protein 5 knocked down, placed in anoxia for 48 h. White arrow head, intact PARP; black arrow head, cleaved PARP. (f) Immunofluorescent staining of LAMP2 (green) in cp22 and cp43 CTOS exposed to 10 nM YM155. The times after exposure are shown. Blue, DAPI. Scale bar, 20 μm.
Next, we analyzed intracellular signaling in YM155‐treated CTOS, focusing on the reported mechanisms of YM155‐induced cell death. YM155 was developed as an inhibitor of survivin, which is involved in apoptosis.17 In cp22 and cp43, PARP was not cleaved, indicating that cell death did not proceed through typical apoptosis (Fig. 5b), consistent with the results showing that PI‐stained nuclei were neither condensed nor fragmented (Fig. 4b). Next, tumors with high expression levels of survivin are reportedly sensitive to YM155.18 Western blotting revealed that survivin was expressed more in sensitive cp43 than resistant cp22 (Fig. 5b), although the expression levels of survivin were not correlated with sensitivity to YM155 (Fig. 5c). YM155 suppressed survivin expression in both the sensitive and resistant CTOS. Next, EGFR degradation is reportedly promoted by YM155 treatment in pancreatic cancer cells.19 The resistant cp22 did not express EGFR. In the sensitive cp43, EGFR levels did not change within 72 h after YM155 treatment (Fig. 5b). Nonetheless, in the sensitive cp43, phosphorylation of AKT, S6 (a downstream target of mTOR), and ERK were remarkably suppressed by YM155 compared with the resistant cp22. Finally, DNA damage is reported as one of the causes of death induced by YM155. A marker of DNA damage, γ‐H2AX, appeared in the sensitive cp43 72 h after YM155 treatment (Fig. 5b). It was not detected at 48 h when cell death was already apparent (Fig. 4b). Taken together, non‐apoptotic cell death was induced by YM155 and suppression of AKT might be related to the cell death.
YM155 also reportedly induces autophagic cell death.18, 20, 21 Pretreatment with 3MA, an inhibitor of autophagy, suppressed cell death in cp43 (Fig. 5d). LC3 was not detected in the CTOS (Fig. 5e). Lamp2 positive‐staining small puncta were transiently increased at 24 h (Fig. 5f). The autophagosome is formed by the hierarchical recruitment of autophagy‐related proteins including LC3. As an alternative to this canonical pathway, autophagosomes can also form from only a subset of autophagy‐related proteins.22 Thus, YM155 may promote autophagosome formation through non‐canonical autophagy, at least in this sensitive CTOS.
Discussion
Development of biomarkers predicting sensitivity is of paramount importance for the success of developing molecular targeting drugs. In this study, we showed that CTOS can be efficiently prepared and cultured from tumors of the corpus uteri. Using CTOS derived from endometrial cancers, we screened a panel of molecular targeting drugs. We found two candidate drugs, everolimus and YM155, and tested them in multiple CTOS from individual patient tumors. The response of individual CTOS showed striking diversity, as has been observed for other drugs in other cancers.11, 13, 14 Separating CTOS into sensitive and resistant groups can contribute to the search for biomarkers. This study provides a useful step towards establishing a basis for larger scale screening. Although the success rate of the CTOS sensitivity assay from individual biopsy samples needs to be further improved, the CTOS assay could be applied to planning strategies for treatment of individual patients. Assessing the direct effect of the drugs in an in vitro assay would be useful in cases in which the signaling network is too complicated to predict the effect using a few gene mutations or an abnormal status of a branch of signaling pathway.
Cancer tissue‐originated spheroid‐based screening assays can be advantageous compared with conventional methods. Cell line‐based drug screening has been the major platform for decades.23 Most of the cell lines were established in 2‐D cultures with serum‐containing medium. Because of the time and selection during the establishment process, cell lines are likely to be irreversibly changed from the original tumors.24, 25 In contrast, CTOS can be prepared with high yield from patients’ tumors as well as from mouse xenografts, and are stable in culture. Furthermore, original cancer cell characteristics are relatively preserved in CTOS not only from endometrial cancer (Fig. 1), but also from various other cancers.11, 12, 13, 14 Attempts have also been made to apply primary culture sensitivity assays, although it is difficult to prepare sufficient samples for drug screening. We used mouse xenografts derived from CTOS, from which we successfully prepared enough CTOS of homogeneous quality for drug screening. The number of cells can be expanded by generating an appropriate number of xenografts.
Since the development of rapamycin, several derivatives have been developed as rapalogs targeting mTORC1.16 As the PI3K/AKT/mTOR pathway is often aberrantly activated in cancers, these rapalogs were applied to cancer treatment. Temsirolimus is used as a first‐line drug for renal cancer and everolimus as a third‐line drug. Additionally, a number of clinical trials have been carried out in multiple cancer types including gynecologic malignancies.26, 27 In endometrial cancer, eight phase II trials were reported in 5 years.28 Furthermore, mTORC1 ATP kinase inhibitors and dual inhibitors of PI3K/mTOR and mTORC1/mTORC2 have been further developed, some of which are currently in clinical trials.16, 26 Because the effect of the rapalogs was unfortunately moderate in these clinical trials, biomarkers for predicting response to these drugs have been intensively explored, although none are available so far.29 In this study, we showed that the effect was substantially different among individual CTOS. The effect of everolimus in sensitive CTOS was cytostatic but not cytotoxic, as was reported in other cancers.30 Suppression of the downstream pathway was observed in all CTOS, even in resistant ones. These results suggest that the PI3K/AKT/mTOR pathway cannot act as a predictive biomarker for everolimus in endometrial cancer.
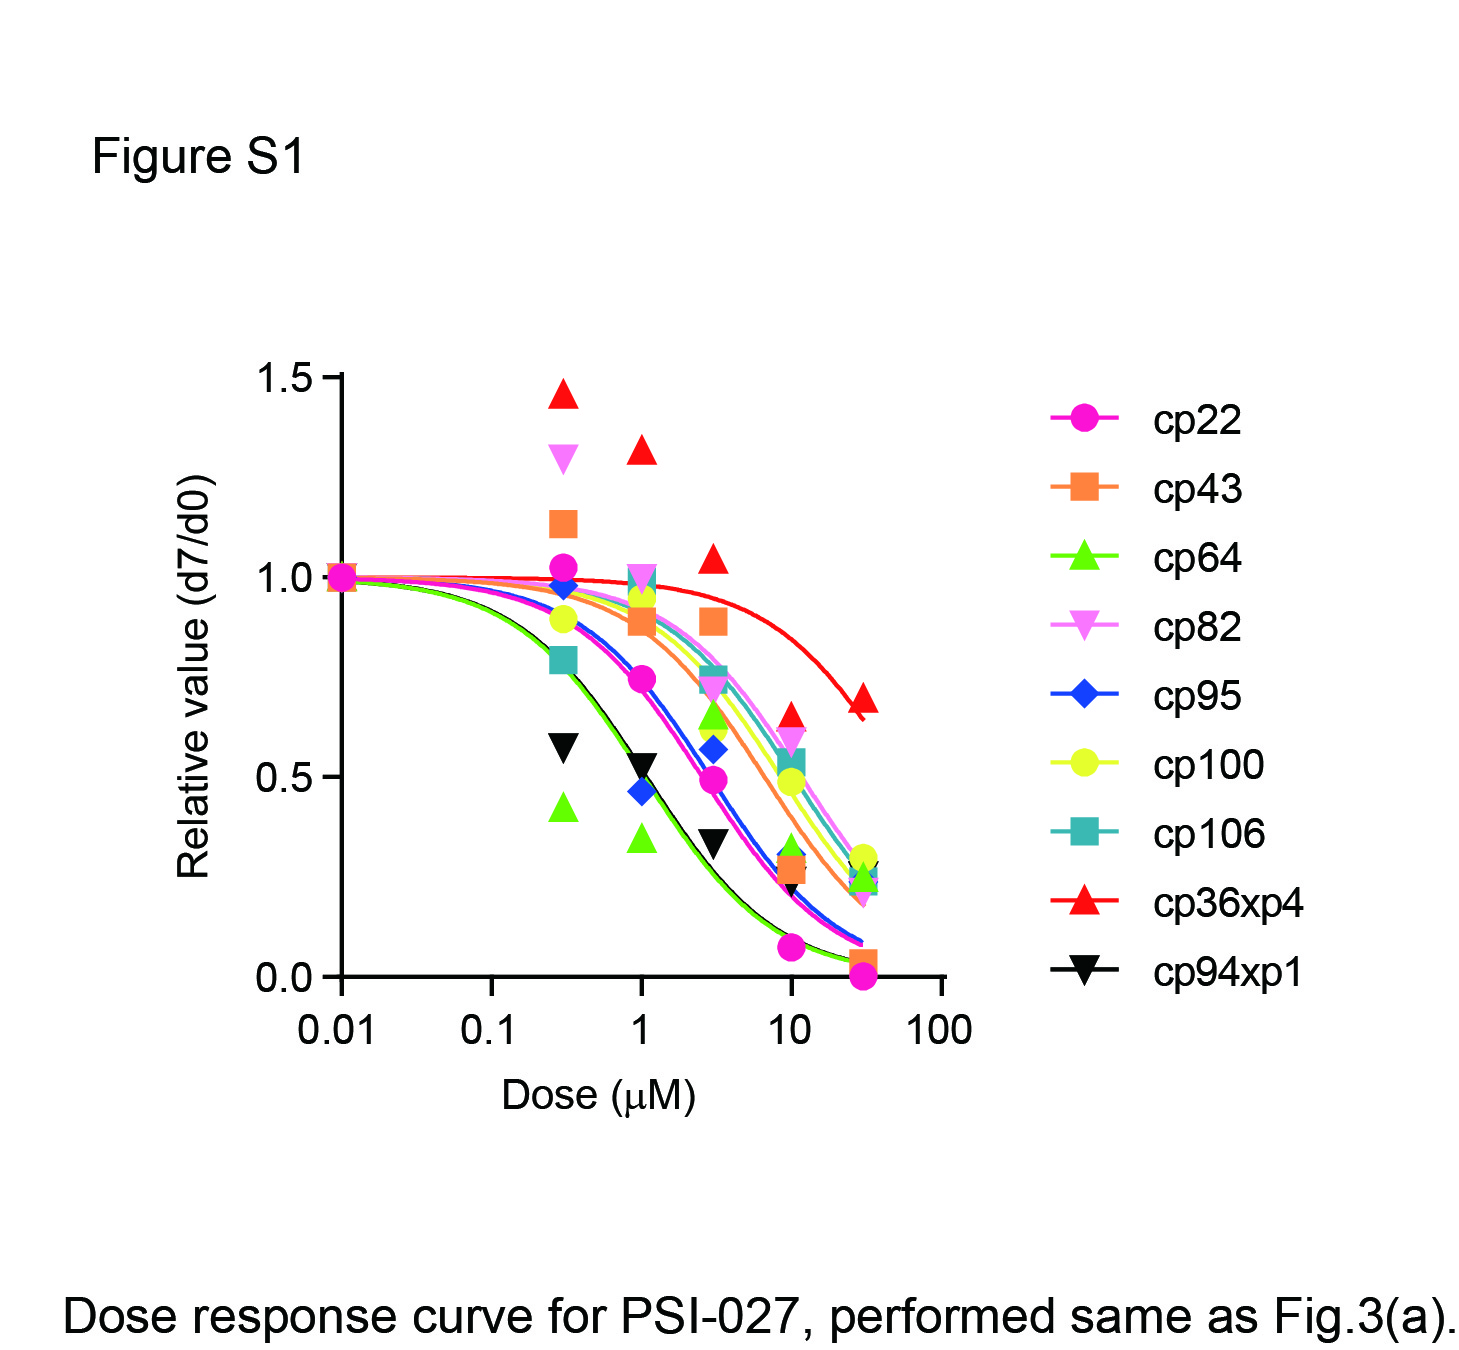
In the list of drugs used in the screening, a dual inhibitor of mTORC1 and mTORC2, torkinib, was included. Torkinib did not show any effect in the drug screening, even in high dose. We tested OSI‐027, another dual inhibitor of mTORC1 and mTORC2 (Fig. S1). These CTOS were also resistant to OSI‐027 at the tested doses. These results indicate that only mTORC1 inhibitors were effective in the tested CTOS but not dual inhibitors. In these CTOS, mTORC2 activity might be necessary for the effect of mTORC1 inhibitors.
YM155 was developed as a small compound suppressing the expression of survivin (BIRC5).17 Survivin belongs to the IAP family, which inhibits apoptosis.31 Both mRNA and protein levels were suppressed by YM155 in HeLa and prostate cancer cells in vivo, and cell proliferation and tumor growth were suppressed.17 YM155 reportedly interacts with and inhibits a protein complex that activates the survivin promoter.32, 33 Effects of YM155 other than suppression of the survivin promoter have also been reported, including promotion of EGFR degradation19 and induction of DNA damage.34 In this study, massive cell death was induced in a sensitive CTOS, cp43, treated with YM155, although none of those reported mechanisms was related. It is possible that survivin is not a real target of YM155 in the induction of cell death of cp43. We showed that an alternative autophagic death is the most likely mechanism in cp43, although this result requires further study using multiple sensitive CTOS lines of endometrial cancer to determine whether the characteristic mode of cell death by YM155 in a CTOS is a common mechanism.
Because of the promising results with YM155 in preclinical studies including endometrial cancer,35, 36 phase II clinical trials for YM155 have been carried out in various cancers.35 None of them have yet proceeded to phase III because a limited number of patients have achieved responses. Development of biomarkers to select patients for whom the drug will be effective is crucial. In this study, we showed that the CTOS sensitivity assay, using biopsy samples from patients’ tumors, could determine a biomarker for YM155. We also found that non‐endometrioid histological types may be good candidates for YM155, although it is necessary to examine a larger number of samples in future to confirm these results.
Disclosure Statement
The authors have no conflict of interest to declare.
Abbreviations
- AKT
protein kinase B
- CR
complete response
- CTOS
cancer tissue‐originated spheroid
- EGFR
epidermal growth factor receptor
- γH2AX
phosphorylated histone H2AX
- IAP
inhibitor of apoptosis
- 3MA
3‐methyladenine
- mTOR
mammalian target of rapamycin
- mTORC
mammalian target of rapamycin complex
- p
phosphorylated
- PARP
poly(ADP‐ribose) polymerase
- PCNA
proliferating cell nuclear antigen
- PI
propidium iodide
- PI3K
phosphoinositide 3‐kinase
- PR
partial response
Supporting information
Fig. S1. Dose–response curve for PSI‐027 for various CTOSs.
Table S1. List of the molecular targeting drugs used in the screening, and relative growth in each dose of drug.
Table S2. Case description, and cancer tissue‐originated spheroid (CTOS) characteristics of endometrial cancer specimen.
Acknowledgments
This work was supported in part by grants‐in‐aid from the Project for Development of Innovative Research on Cancer Therapeutics (M.I., H.O., and H.E.), the Japan Society for the Promotion of Science (Kakenhi 26462522, K.Y.), the Takeda Science Foundation (M.I.), and the Osaka Foundation for the Prevention of Cancer and Cardiovascular Diseases (M.I.).
Cancer Sci 107 (2016) 452–460
Funding Information
Japan Agency for Medical Research and Development; Japan Society for the Promotion of Science; Takeda Science Foundation; Osaka Foundation for the Prevention of Cancer and Cardiovascular Diseases.
References
- 1. Sorosky JI. Endometrial cancer. Obstet Gynecol 2012; 120: 383–97. [DOI] [PubMed] [Google Scholar]
- 2. Weiderpass E, Antoine J, Bray FI, Oh JK, Arbyn M. Trends in corpus uteri cancer mortality in member states of the European Union. Eur J Cancer 2014; 50: 1675–84. [DOI] [PubMed] [Google Scholar]
- 3. Ushijima K. Current status of gynecologic cancer in Japan. J Gynecol Oncol 2009; 20: 67–71. [DOI] [PMC free article] [PubMed] [Google Scholar]
- 4. Creasman WT, Odicino F, Maisonneuve P et al Carcinoma of the corpus uteri. Int J Gynecol Obstet 2006; 95: S105–43. [DOI] [PubMed] [Google Scholar]
- 5. Dedes KJ, Wetterskog D, Ashworth A, Kaye SB, Reis‐Filho JS. Emerging therapeutic targets in endometrial cancer. Nat Rev Clin Oncol 2011; 8: 261–71. [DOI] [PubMed] [Google Scholar]
- 6. Lynch TJ, Bell DW, Sordella R et al Activating mutations in the epidermal growth factor receptor underlying responsiveness of non‐small‐cell lung cancer to gefitinib. N Engl J Med 2004; 350: 2129–39. [DOI] [PubMed] [Google Scholar]
- 7. O'Brien SG, Guilhot F, Larson RA et al Imatinib compared with interferon and low‐dose cytarabine for newly diagnosed chronic‐phase chronic myeloid leukemia. N Engl J Med 2003; 348: 994–1004. [DOI] [PubMed] [Google Scholar]
- 8. Bokemeyer C, Bondarenko I, Makhson A et al Fluorouracil, leucovorin, and oxaliplatin with and without cetuximab in the first‐line treatment of metastatic colorectal cancer. J Clin Oncol 2009; 27: 663–71. [DOI] [PubMed] [Google Scholar]
- 9. Van Cutsem E, Kohne CH, Hitre E et al Cetuximab and chemotherapy as initial treatment for metastatic colorectal cancer. N Engl J Med 2009; 360: 1408–17. [DOI] [PubMed] [Google Scholar]
- 10. Cancer Genome Atlas Research N , Kandoth C, Schultz N et al Integrated genomic characterization of endometrial carcinoma. Nature 2013; 497: 67–73. [DOI] [PMC free article] [PubMed] [Google Scholar]
- 11. Kondo J, Endo H, Okuyama H et al Retaining cell‐cell contact enables preparation and culture of spheroids composed of pure primary cancer cells from colorectal cancer. Proc Natl Acad Sci USA 2011; 108: 6235–40. [DOI] [PMC free article] [PubMed] [Google Scholar]
- 12. Okuyama H, Yoshida T, Endo H et al Involvement of heregulin/HER3 in the primary culture of human urothelial cancer. J Urol 2013; 190: 302–10. [DOI] [PubMed] [Google Scholar]
- 13. Endo H, Okami J, Okuyama H et al Spheroid culture of primary lung cancer cells with neuregulin 1/HER3 pathway activation. J Thorac Oncol 2013; 8: 131–9. [DOI] [PubMed] [Google Scholar]
- 14. Nakajima A, Endo H, Okuyama H et al Radiation sensitivity assay with a panel of patient‐derived spheroids of small cell carcinoma of the cervix. Int J Cancer 2014; 134: 2949–2960. [DOI] [PubMed] [Google Scholar]
- 15. Atkins MB, Yasothan U, Kirkpatrick P. Everolimus. Nat Rev Drug Discov 2009; 8: 535–6. [DOI] [PubMed] [Google Scholar]
- 16. Laplante M, Sabatini David M. mTOR signaling in growth control and disease. Cell 2012; 149: 274–93. [DOI] [PMC free article] [PubMed] [Google Scholar]
- 17. Nakahara T, Kita A, Yamanaka K et al YM155, a novel small‐molecule survivin suppressant, induces regression of established human hormone‐refractory prostate tumor xenografts. Cancer Res 2007; 67: 8014–21. [DOI] [PubMed] [Google Scholar]
- 18. Wang YF, Zhang W, He KF et al Induction of autophagy‐dependent cell death by the survivin suppressant YM155 in salivary adenoid cystic carcinoma. Apoptosis 2014; 19: 748–58. [DOI] [PMC free article] [PubMed] [Google Scholar]
- 19. Na YS, Yang SJ, Kim SM et al YM155 induces EGFR suppression in pancreatic cancer cells. PLoS ONE 2012; 7: e38625. [DOI] [PMC free article] [PubMed] [Google Scholar]
- 20. Zhang L, Zhang W, Wang YF et al Dual induction of apoptotic and autophagic cell death by targeting survivin in head neck squamous cell carcinoma. Cell Death Dis 2015; 6: e1771. [DOI] [PMC free article] [PubMed] [Google Scholar]
- 21. Cheng SM, Chang YC, Liu CY et al YM155 down‐regulates survivin and XIAP, modulates autophagy and induces autophagy‐dependent DNA damage in breast cancer cells. Br J Pharmacol 2015; 172: 214–34. [DOI] [PMC free article] [PubMed] [Google Scholar]
- 22. Dupont N, Codogno P. Non‐canonical autophagy: facts and prospects. Curr Pathobiol Rep 2013; 1: 263–71. [Google Scholar]
- 23. Shoemaker RH. The NCI60 human tumour cell line anticancer drug screen. Nat Rev Cancer 2006; 6: 813–23. [DOI] [PubMed] [Google Scholar]
- 24. Birgersdotter A, Sandberg R, Ernberg I. Gene expression perturbation in vitro–a growing case for three‐dimensional (3D) culture systems. Semin Cancer Biol 2005; 15: 405–12. [DOI] [PubMed] [Google Scholar]
- 25. Lee J, Kotliarova S, Kotliarov Y et al Tumor stem cells derived from glioblastomas cultured in bFGF and EGF more closely mirror the phenotype and genotype of primary tumors than do serum‐cultured cell lines. Cancer Cell 2006; 9: 391–403. [DOI] [PubMed] [Google Scholar]
- 26. Wander SA, Hennessy BT, Slingerland JM. Next‐generation mTOR inhibitors in clinical oncology: how pathway complexity informs therapeutic strategy. J Clin Invest 2011; 121: 1231–41. [DOI] [PMC free article] [PubMed] [Google Scholar]
- 27. Husseinzadeh N, Husseinzadeh HD. mTOR inhibitors and their clinical application in cervical, endometrial and ovarian cancers: a critical review. Gynecol Oncol 2014; 133: 375–81. [DOI] [PubMed] [Google Scholar]
- 28. Lheureux S, Wilson M, Mackay HJ. Recent and current Phase II clinical trials in endometrial cancer: review of the state of art. Expert Opin Investig Drugs 2014; 23: 773–92. [DOI] [PubMed] [Google Scholar]
- 29. Salvesen HB, Haldorsen IS, Trovik J. Markers for individualised therapy in endometrial carcinoma. Lancet Oncol 2012; 13: e353–61. [DOI] [PubMed] [Google Scholar]
- 30. Hay N, Sonenberg N. Upstream and downstream of mTOR. Genes Dev 2004; 18: 1926–45. [DOI] [PubMed] [Google Scholar]
- 31. Altieri DC. Survivin, versatile modulation of cell division and apoptosis in cancer. Oncogene 2003; 22: 8581–9. [DOI] [PubMed] [Google Scholar]
- 32. Cheng Q, Ling X, Haller A et al Suppression of survivin promoter activity by YM155 involves disruption of Sp1‐DNA interaction in the survivin core promoter. Int J Biochem Mol Biol 2012; 3: 179–97. [PMC free article] [PubMed] [Google Scholar]
- 33. Yamauchi T, Nakamura N, Hiramoto M et al Sepantronium bromide (YM155) induces disruption of the ILF3/p54(nrb) complex, which is required for survivin expression. Biochem Biophys Res Commun 2012; 425: 711–6. [DOI] [PubMed] [Google Scholar]
- 34. Winter GE, Radic B, Mayor‐Ruiz C et al The solute carrier SLC35F2 enables YM155‐mediated DNA damage toxicity. Nat Chem Biol 2014; 10: 768–73. [DOI] [PMC free article] [PubMed] [Google Scholar]
- 35. Rauch A, Hennig D, Schafer C et al Survivin and YM155: how faithful is the liaison? Biochim Biophys Acta 2014; 1845: 202–20. [DOI] [PubMed] [Google Scholar]
- 36. Fukuda T, Wada‐Hiraike O, Oda K et al Putative tumor suppression function of SIRT6 in endometrial cancer. FEBS Lett 2015; 589: 2274–81. [DOI] [PubMed] [Google Scholar]
Associated Data
This section collects any data citations, data availability statements, or supplementary materials included in this article.
Supplementary Materials
Fig. S1. Dose–response curve for PSI‐027 for various CTOSs.
Table S1. List of the molecular targeting drugs used in the screening, and relative growth in each dose of drug.
Table S2. Case description, and cancer tissue‐originated spheroid (CTOS) characteristics of endometrial cancer specimen.