Abstract
Background:
Traumatic brain injury (TBI) is a life-threatening disease worldwide. Regulatory T cells (Treg cells) were involved in the immunological system in central nervous system. It is defined as a subpopulation of CD4+ cells that express CD25 and transcription factor forkhead box P3. The level of circulating Treg cells increases in a variety of pathologic conditions. The purpose of this study was to uncover the role of circulating Treg cells in TBI.
Methods:
A clinical study was conducted in two neurosurgical intensive care units of Tianjin Medical University General Hospital and Second Hospital of Tianjin Medical University (Tianjin, China). Forty patients and 30 healthy controls were recruited from August 2013 to November 2013. Circulating Treg cells was detected on the follow-up period of 1, 4, 7, 14, and 21 days after TBI. Blood sample (1 ml) was withdrawn in the morning and processed within 2 h.
Results:
There was no significant difference in the level of circulating Treg cells between TBI patients and normal controls during follow-up. TBI patients exhibited higher circulating Treg level than normal controls on the 1st day after TBI. Treg level was decreased on the 4th day, climbed up on the 7th day and peaked on 14th day after TBI. Treg cells declined to the normal level on 21th day after TBI. The level of circulating Treg cells was significantly higher in survival TBI patients when compared to nonsurvival TBI patients. TBI patients with improved conditions exhibited significantly higher circulating Treg level when compared to those with deteriorated conditions. The circulating Treg level was correlated with neurologic recovery after TBI. A better neural recovery and lower hospital mortality were found in TBI patients with circulating Treg cells more than 4.91% in total CD4+ mononuclear cells as compared to those with circulating Treg cells less than 4.91% in total CD4+ mononuclear cells in the first 14 days.
Conclusions:
The level of circulating Treg cells is positively correlated with clinical outcome of TBI. The level of Treg cells predicts the progress for TBI patients and may be a target in TBI treatment.
Keywords: Clinical Outcome, Dynamic Change, Prognostic Marker, Regulatory T cell, Traumatic Brain Injury
INTRODUCTION
Traumatic brain injury (TBI) is a life-threatening disease worldwide. The primary brain injury leads to rupture of neurons and axons breakage which results in an increment of local inflammatory factors. Posttraumatic secondary brain injury also plays a pivotal role in the prognosis of TBI. This posttraumatic injury was correlated with pro-inflammatory factors and immune cells from blood to the site of injury infiltrated the parenchyma of the brain. Excessive production of pro-inflammatory cytokines by activation of lymphocytes and microglia was associated with a poor clinical outcome after TBI.[1]
Regulatory T cells (Treg cells) were involved in the immunological system in central nervous system (CNS).[2] Treg cells are capable of modulating effector T cells and antigen-presenting cells (APC) and they secrete anti-inflammatory cytokines, including interleukin-10 (IL-10) and transforming growth factor-β.[1,3,4] The depletion of the Treg cells profoundly increases mortality in cecal ligation and puncture mice.[5] Consistently, the absence of Treg was demonstrated to correlate with an increased delayed brain damage and deteriorated functional outcome in C57BL/6 mice.[1] The injection of exogenous Treg cells resulted in improved outcome in BALB/c/OLA mice.[6,7] Induction of Tregs would benefit the disease pathology.[8] Cerebral tumor necrosis factor-alpha, interferon-gamma, and IL-1β were down-regulated by Treg cells.[1] This activity serves as a restraining self-checking mechanism to prevent excessive reaction of the beneficial immunity in response to CNS injury.[7]
Human Treg cells were first characterized as CD4+ CD25+ T cells in 2001 based on the finding that mouse Treg cells constitutively express CD25.[9] T cells that express the IL-2 receptor α chain (CD25) control auto-reactive T cells in vivo. Natural CD4+ CD25+ T cells suppress autoimmune responses via inhibition of self-reactive T cells.[10] In 2003, forkhead box P3 (Foxp3) was described as a control gene for Treg cell development and function[9] Humans that lack functional Foxp3 develop immunodysregulation.[11] For now, Treg cells are defined as a subpopulation of CD4 hematopoietic cells that express CD25 and transcription factor Foxp3.[11]
Naturally occurring Treg cells are thymus-derived. An undetectable number of peripheral Treg cells was found after thymectomy.[10] CD25 and Foxp3 expression emerged lately in CD4+ CD8− single-positive thymocytes. Treg cells are released from the thymus to peripheral blood. The levels of circulating Tregs increase in a variety of pathologic conditions, including stroke and encephalomyelitis.[1,12] However, whether circulating Treg cells affect the clinical outcome in TBI remained obscure. The objectives of this study were to estimate: (1) The level of circulating Treg cells in patients with TBI as compared to healthy controls; (2) Dynamic changes of circulating Treg cells in patients during a follow-up of 21 days after TBI; (3) The correlation between circulating Treg cells and severity based on Glasgow Coma Scale score (GCS) at admission; (4) The correlation between circulating Treg cells and clinical outcome.
METHODS
Study design
The inclusion criteria include: (1) Human subjects with TBI; (2) Admitted within 24 h after TBI; (3) Abnormal findings under computed tomography scan.
The exclusion criteria include: (1) Patients with complex trauma involving body trunk and limbs; (2) Patients with hematologic disorders; (3) Patients with cancer; (4) Patients on sedation; (5) Patients with insufficient data.
Blood sample collection
Traumatic brain injury patients admitted to Tianjin General Hospital and Second Hospital of Tianjin Medical University from August 2013 to November 2013 were enrolled. Forty TBI patients and 30 healthy controls were recruited for the study. The study was approved by the Institutional Review Board of Tianjin Medical University in human subjects for medical research. All patients or guardians signed consent forms before enrollment. The fasting venous blood samples (1 ml) were collected in the morning with ethylenediaminetetraacetic acid tube (0.5 mmol/L final concentration). Circulating Treg cells was detected on the follow-up period of 1, 4, 7, 14, and 21 days after TBI. Blood samples were also collected from healthy subjects to obtain the normal reference values. Blood samples were processed within 2 h after blood draw.
Regulatory T cell measurement by flow cytometry
We used CD4, CD25 and Foxp3 as markers to identify circulating Treg cells. The triple staining allows us to identify CD4(+)CD25(+)Foxp3(+) circulating Treg cells. 300 μl of red cell lysis solution was added to 100 μl of blood for 15 min at room temperature. The mix was subjected to a density gradient centrifugation at 450 ×g for 10 min at room temperature. The supernatant was removed, and the pellet was resuspended with phosphate-buffered saline (PBS). The cells were labeled with R-phycoerythrin (PE)-conjugated monoclonal CD25 antibody (BD Pharmingen, USA) and fluorescein isothiocyanate-conjugated CD4 monoclonal antibody (BD Pharmingen) for 20 min at room temperature. One ml Foxp3 Fixation buffer (eBioscience, USA) was added into the suspension and incubated for 30 min. One ml Foxp3 permeabilization buffer (eBioscience) was mixed and incubated for 10 min. The cells were then labeled with peridinin chlorophyll (PerCP)-conjugated Foxp3 monoclonal antibody (BD Pharmingen) after washed with 2 ml PBS. Stained cells were washed with 2 ml PBS again and analyzed by flow cytometry (BD FACS Calibur, BD Biosciences). To eliminate the interferences by nonspecific bindings, both PE-conjugated and PerCP-conjugated mouse immunoglobulin G were used. Cells were first run on forward, and side scatter to select mononuclear cells from cell aggregates, platelets, and cellular debris. For triple fluorescence detection, cells were first gated for their CD4 positivity and then for CD25 positivity. Treg cells were detected as gated cells that were stained for Per CP fluorescence positivity and quantified as the percentage of Treg cells in CD4+ mononuclear cells.
Neurological functional outcome measurement
Glasgow Coma Scale score was employed to demonstrate the severity of neurological deficits at 1, 4, 7, 14, and 21 days after TBI. Patients were separated into mild (GCS score of 13–15), moderate (GCS score of 9–12), and severe (GCS score of <8) injury when admitted. Improvement was defined as an unchanged GCS score of 15 or an increment more than 1 point during the follow-up period.[13] Deterioration was defined as a decrement more than one point during the follow-up period.[13]
All patients admitted were treated according to the international guidelines for TBI treatment. We did not administer any medicine that affects circulating Treg cells during the follow-up.
Statistical analysis
The data are expressed as mean ± standard error of the mean. Categorical variables were compared using the Pearson Chi-square test. Comparisons between groups for continuous variables were performed with Student's t-test or two-way analysis of variance (ANOVA). Univariate correlations were performed with Pearson correlation coefficients. Multivariate correlations were performed with binary logistic regression analysis. Repeated measurement ANOVA was used to compare the numbers of circulating Treg cells at each time point.
Receiver operating characteristic curves were analyzed, and a cut-off point was calculated to predict neurological recovery. Crude and adjusted odds ratio with 95% confidence interval was calculated. A P < 0.05 was considered to be statistically significant. All analyses were performed using the SPSS software (version 19.0, SPSS, USA) and GraphPad Software (Version 5.0, GraphPad Prism, USA).
RESULTS
A total of 40 patients were finally enrolled into the statistical analysis. The demographic information of the patients and controls is shown in Table 1. Among the 40 TBI patients, 13 patients received blood transfusion with an average amount of 600 ml. To assess the interference by blood transfusion, a comparison of Treg cells between blood transfused TBI patients and nonblood transfused TBI patients was conducted. There was no significant difference in Treg cell level between TBI patients who received blood transfusion and those without blood transfusion (P = 0.3972, Figure 1). The data suggested that blood transfusion does not influence the level of Treg cells.
Table 1.
Demographic features of the TBI patients and normal controls
| Characteristics | Healthy subjects (n = 30) | Patients with traumatic brain injury (n = 40) | P |
|---|---|---|---|
| Age (years) | 47.8 ± 4.3 | 51.9 ± 3.1 | 0.4334 |
| Sex (male/female) | 16/14 | 24/16 | 0.5773 |
| Premedical history, n (%) | |||
| Hypertension | 5 (16.7) | 7 (17.5) | 0.9271 |
| Coronary artery disease | 2 (6.7) | 2 (5.0) | 0.7670 |
| Diabetes mellitus | 2 (6.7) | 3 (7.5) | 0.8935 |
| Hyperlipidemia | 0 (0) | 1 (2.5) | 0.6108 |
| Stroke | 1 (3.3) | 4 (10.0) | 0.3071 |
| Smoking habits | 5 (16.7) | 8 (20.0) | 0.7230 |
| Alcohol consumption | 2 (6.7) | 3 (7.5) | 0.8935 |
| Transfusion | 3 (10.0) | 5 (12.5) | 0.7454 |
| Vital signs at admission | |||
| Systolic pressure (mmHg) | 138.2 ± 2.8 | 141.6 ± 3.0 | 0.4274 |
| Diastolic pressure (mmHg) | 80.3 ± 1.2 | 80.6 ± 1.7 | 0.9018 |
| Pulse rate (bpm) | 79.5 ± 1.9 | 82.1 ± 2.1 | 0.3741 |
| Respiratory rate (/min) | 18.6 ± 0.9 | 19.6 ± 0.6 | 0.2905 |
| Body temperature (°C) | 36.5 ± 0.1 | 36.8 ± 0.1 | 0.0169 |
| Medication, n (%) | |||
| Aspirin | 2 (6.7) | 4 (10.0) | 0.6242 |
| ACEI | 2 (6.7) | 3 (7.5) | 0.8935 |
| Clopidogrel | 1 (3.3) | 2 (5.0) | 0.7350 |
| CCB | 3 (10.0) | 4 (10.0) | 1.0000 |
| Insulin | 0 (0) | 1 (2.5) | 0.6108 |
| Statins | 1 (3.3) | 2 (5.0) | 0.7350 |
TBI: Traumatic brain injury; ACEI: angiotensin converting enzyme inhibitor; CCB: calcium channe blocker.
Figure 1.
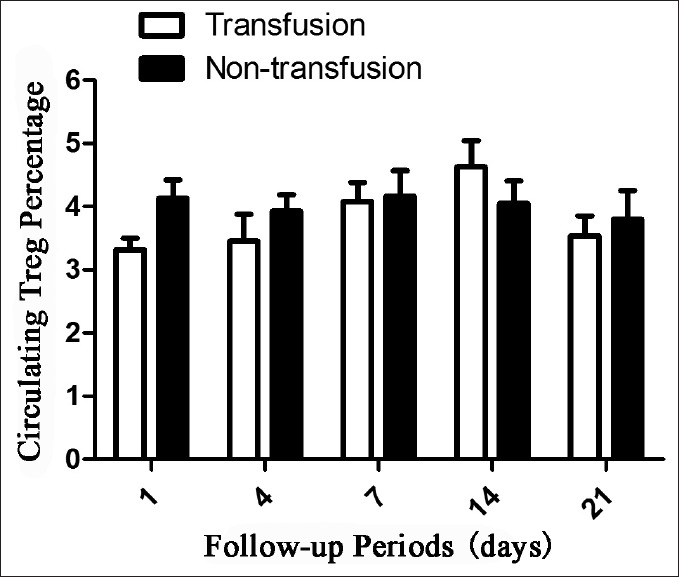
Effect of blood transfusion on the levels of circulating regulatory T cells in traumatic brain injury patients.
No significance in circulating Treg cells was found between TBI patients and normal controls throughout the follow-up period (P = 0.0974). The level of circulating Treg cells in TBI patients has an increasing trend on the 1st day and was decreased to normal reference level on the 4th day after TBI when compared to healthy controls. However, the level of Treg cell climbed up on the 7th day and peaked on 14th day after TBI and then declined to normal control level on the 21th day after TBI. The dynamic changes of circulating Treg cells during a follow-up of 21 days are shown in Figure 2.
Figure 2.
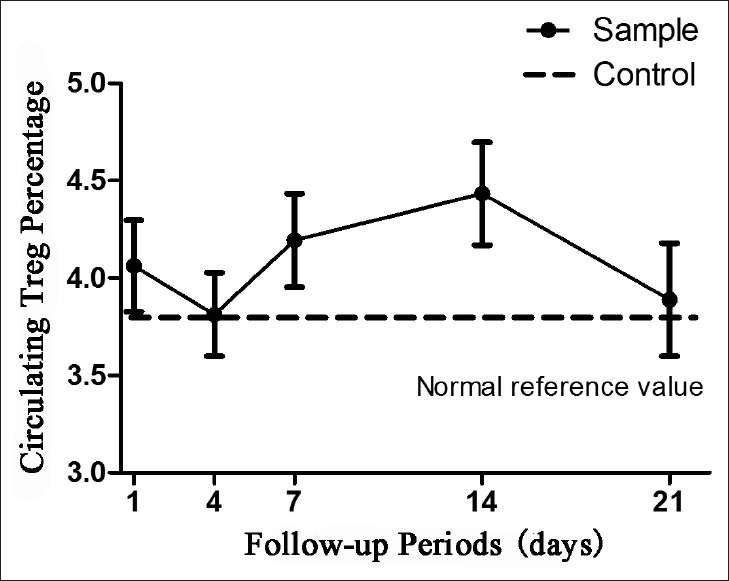
Dynamic changes of circulating regulatory T cells in traumatic brain injury patients as compared to normal controls.
Of the 40 TBI patients, 34 patients survived, and 6 patients died during the follow-up period of 21 days. Among the survival TBI patients, the clinical conditions were improved in 26 patients and deteriorated in 8 patients. The baseline data of TBI patients are shown in Table 2.
Table 2.
Baseline data of the included patients with TBI
| Characteristics | All (n = 40) | Improvement (n = 24) | Deterioration (n = 16) | P |
|---|---|---|---|---|
| Age (years) | 51.9 ± 3.1 | 49.1 ± 4.0 | 56.2 ± 5.1 | 0.2724 |
| Sex (Male/Female) | 24/16 | 14/10 | 10/6 | 0.7922 |
| Time from injury to admission (hours) | 5.96 ± 0.94 | 5.79 ± 1.09 | 6.22 ± 1.73 | 0.8982 |
| Glasgow Coma Scale score | 12.6 ± 0.5 | 14.3 ± 0.2 | 10.1 ± 1.0 | 0.0000 |
| Anisocoria, n (%) | 6 (15.0) | 1 (4.2) | 5 (31.2) | 0.0422 |
| Loss of consciousness ≥ 30 min, n (%) | 12 (30.0) | 3 (12.5) | 9 (56.2) | 0.0058 |
| Mechanism of injury, n (%) | ||||
| Falls | 4 (10.0) | 3 (12.5) | 1 (6.2) | 0.5264 |
| Stumble | 11 (27.5) | 7 (29.2) | 4 (25.0) | 0.7727 |
| Syncope | 3 (7.5) | 0 (0) | 3 (18.8) | 0.1009 |
| Traffic accidents | 20 (50.0) | 12 (50.0) | 8 (50.0) | 1.0000 |
| Violence | 2 (5.0) | 2 (8.3) | 0 (0) | 0.4117 |
| Computed tomography finding, n (%) | ||||
| Extradural hematoma | 8 (20.0) | 1 (4.2) | 7 (43.8) | 0.0113 |
| Subdural hematoma | 14 (35.0) | 8 (33.3) | 6 (37.5) | 0.7867 |
| Subarachmoid hemorrhage | 27 (67.5) | 17 (63.0) | 10 (62.5) | 0.5822 |
| Intracerebral hematoma | 11 (27.5) | 7 (29.2) | 4 (25.0) | 0.7727 |
| Brain contusion | 24 (60.0) | 14 (58.3) | 10 (62.5) | 0.7922 |
| Skull fracture | 11 (27.5) | 6 (25.0) | 5 (31.2) | 0.6650 |
| Collision region, n (%) | ||||
| Frontal | 8 (20.0) | 5 (20.8) | 3 (18.8) | 0.8718 |
| Occipital | 14 (35.0) | 10 (41.7) | 4 (25.0) | 0.2834 |
| Parietal | 7 (17.5) | 3 (12.5) | 4 (25.0) | 0.3161 |
| Temporal | 11 (27.5) | 5 (20.8) | 6 (37.5) | 0.2527 |
| Facial | 4 (10.0) | 4 (16.7) | 0 (0) | 0.1947 |
| Type of injury, n (%) | ||||
| Open | 10 (25.0) | 6 (25.0) | 4 (25.0) | 1.0000 |
| Closed | 30 (75.0) | 18 (75.0) | 12 (75.0) | 1.0000 |
| Injury severity, n (%) | ||||
| Mild | 28 (70.0) | 23 (95.8) | 5 (31.2) | 0.0007 |
| Moderate | 5 (12.5) | 1 (4.2) | 4 (25.0) | 0.0826 |
| Severe | 7 (17.5) | 0 (0) | 7 (43.8) | 0.0155 |
TBI: Traumatic brain injury.
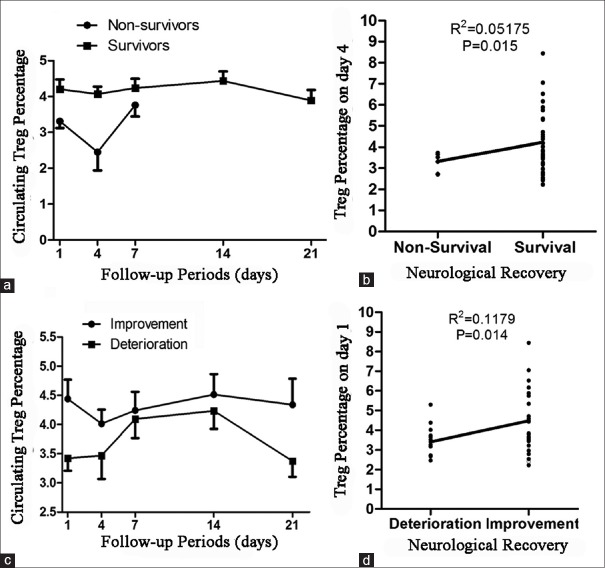
The overall level of circulating Treg cells throughout the 21 days of follow-up was significantly decreased in nonsurvival TBI patients when compared to survival TBI patients (P = 0.0132, Figure 3a). Among different time points, the circulating Treg cell was significantly higher on the 4th day after TBI in survival TBI patients when compared to nonsurvival TBI patients (P = 0.015, Figure 3b). The overall level of circulating Treg cells throughout the 21 days of follow-up was significantly higher in TBI patients with improved conditions when compared to those with deteriorated conditions (P = 0.0163, Figure 3c). Among different time points, the circulating Treg cells on the 1st day and 21th day after TBI was significantly higher in TBI patients with improved conditions when compared to those with deteriorated conditions (P = 0.014; P = 0.046, Figure 3d).
Figure 3.
The correlation between regulatory T cells (Treg cells) and neurologic recovery. (a) The average Treg cells in survival traumatic brain injury (TBI) patients were higher than in nonsurvival TBI patients throughout the follow-up period; (b) The circulating Treg cells in survival TBI patients were significantly higher than in nonsurvival TBI patients on the 4th day after TBI (P < 0.05); (c) The average Treg cells in TBI patients with improved conditions was higher than those with deteriorated conditions throughout the follow-up period; (d) The circulating Treg cells in TBI patients with improved conditions were significantly higher than those with deteriorated conditions on the 1st day after TBI (P < 0.05).
Moreover, the magnitude of change from the 1st day in circulating Treg cells was markedly greater for TBI patients with improved conditions when compared those with deteriorated conditions (P = 0.0302, Figure 4a). However, there was no significant difference between patients with mild TBI and those with moderate and severe TBI (P = 0.1867, Figure 4b).
Figure 4.
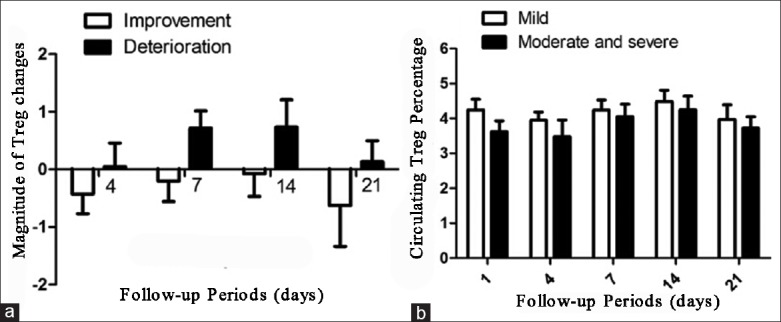
(a) The magnitude of regulatory T cell (Treg cell) changes exhibited different trends in traumatic brain injury (TBI) patients compared with improved conditions and those with deteriorated conditions; (b) There was no significant difference in circulating Treg cells between patients with mild TBI and those with moderate and severe TBI.
As Treg cells reached a climax within the first 14 days after TBI, peripheral Treg cell in the first 14 days was analyzed by receiver operating characteristic curves and areas under the curve [Figure 5]. The analysis identified 4.91% of circulating Treg cells in total CD4+ mononuclear cells as the cut-off point for a sensitive and specific outcome prediction (area under the curve 0.5917, 95% confidence interval 0.4904–0.6930, P = 0.1382).
Figure 5.
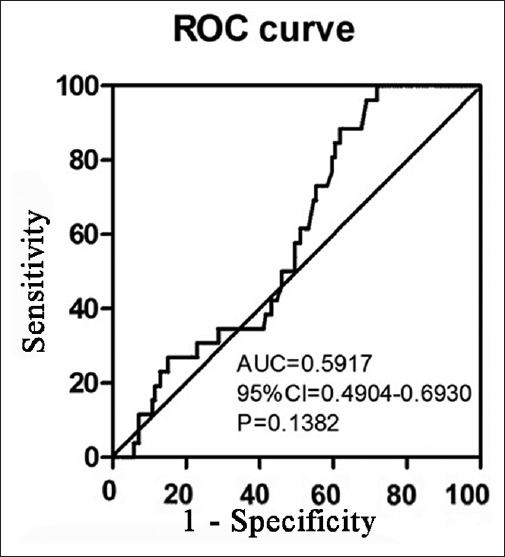
Receiver operating characteristic curve of regulatory T cell in traumatic brain injury patients in the first 14 days.
The binary logistic regression analysis indicated that circulating Treg cell >4.91% independently predicts neurologic recovery (odds ratio: 0.229, 95% confidence interval: 0.056–0.931, P = 0.039). However, an adjusted odds ratio of 0.064 (95% confidence interval: 0.004–1.032, P = 0.053) was obtained after adjustment for age and GCS at admission.
Furthermore, a Kaplan–Meier survival curve based on the magnitude of the increase in circulating Treg cells in the first 14 days was performed. The TBI patients with circulating Treg cells <4.91% had higher hospital mortality than those with circulating Treg cells more than 4.91% [Figure 6].
Figure 6.
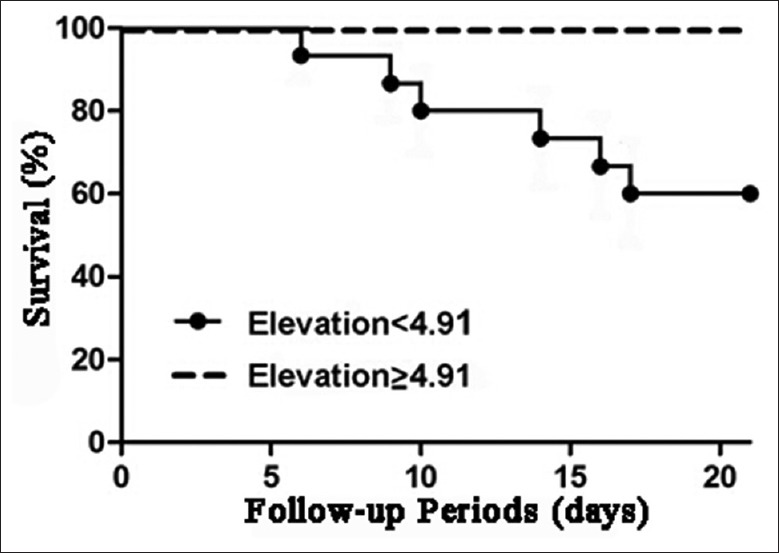
Survival curve of traumatic brain injury patients with circulating regulatory T cells (Treg cells) more than 4.91% and those with circulating Treg cells <4.91% in the first 14 days.
DISCUSSION
Regulatory T cells have a neuroprotective effect in CNS.[2,7] Treg cells are capable of down-regulating inflammatory factors and inhibiting the activity of effector T cells and APCs.[1,14] Inhibition of brain inflammatory responses has proved to be neuroprotective in various models of neurodegeneration, as well as after neurotrauma.[3,15] In this study, we found that increasing circulating Treg cells is correlated with functional outcome after TBI and may predict the prognosis after TBI.
This clinical study was conducted to examine the dynamic change of Treg cells in peripheral blood. The results indicate that Treg cells have the potential to act as a therapeutic target and a diagnostic tool for TBI progress. We propose that increase of Treg cells in TBI patients may lead to a better clinical outcome. The crude odds ratio by univariate regression is <0.05. Although the significance of adjusted odds ratio was not found in this study, a P = 0.053 is quite close to 0.05. A significance may be found after a large-scale clinical study. A value of 4.91% cells can be defined as a prognostic value for TBI.
In this study, we only counted the percentage of CD4(+)CD25(+)Foxp3(+) Treg cells. Although the dynamic changes of total Treg cells in peripheral blood after TBI is elucidated in this article, the dynamic changes of functional Treg cells in peripheral blood after TBI remains obscure.[16] The clinical outcome was assessed using GCS at the end of follow-up instead of using Glasgow Outcome Score (GOS) at long-term such as 3 or 6 months after TBI. The Treg levels were measured only in the first 21 days after TBI. It is unclear how Treg level change from the end of follow-up to the time of GOS assessment. A GOS at long-term such as 3 or 6 months will be performed in the future study to see whether early Treg levels are correlated with long-term functional outcome.
The trend of Treg levels may be explained as follows: The elevation of Treg cells in patients with TBI on day 1 was a response to CNS injury and local autoimmunity.[7,17] Most circulating Treg cells were consumed within the first 3 days which resulted in a decrease of Treg cell level on the 4th day after TBI.[10] The decrement of Treg cells on the 4th day after TBI is more obvious in nonsurvival TBI patients and TBI patients with deteriorated conditions. As more new occurring Treg cells were released, Treg cell levels were increased on day 7 and finally reached a climax on day 14 after TBI. A decrease of Treg cells was observed on day 21 after TBI as the local inflammatory response attenuated. We found that circulating Treg cells were significantly lower in TBI patients with poor outcome. Therefore, increasing Treg cells may benefit functional outcome after TBI.
However, there are a few limitations to this study. First, the number of patients enrolled in this study was not large enough to give a strong conclusion. Second, patients did not receive operation but received common medicine in Neurosurgery Department. It is uncertain whether these medications would affect circulating Treg cells.
In conclusion, the results suggest that the level of circulating Treg cells is positively correlated with clinical outcome of TBI. The level of Treg cells may predict the progress of TBI patients and may be as a therapeutic target in TBI treatment.
Footnotes
Edited by: Li-Shao Guo
Source of Support: Nil.
Conflict of Interest: None declared.
REFERENECES
- 1.Liesz A, Suri-Payer E, Veltkamp C, Doerr H, Sommer C, Rivest S, et al. Regulatory T cells are key cerebroprotective immunomodulators in acute experimental stroke. Nat Med. 2009;15:192–9. doi: 10.1038/nm.1927. [DOI] [PubMed] [Google Scholar]
- 2.McGeachy MJ, Stephens LA, Anderton SM. Natural recovery and protection from autoimmune encephalomyelitis: Contribution of CD4+CD25+regulatory cells within the central nervous system. J Immunol. 2005;175:3025–32. doi: 10.4049/jimmunol.175.5.3025. [DOI] [PubMed] [Google Scholar]
- 3.Huang X, Reynolds AD, Mosley RL, Gendelman HE. CD 4+T cells in the pathobiology of neurodegenerative disorders. J Neuroimmunol. 2009;211:3–15. doi: 10.1016/j.jneuroim.2009.04.006. [DOI] [PMC free article] [PubMed] [Google Scholar]
- 4.Liu Y, Teige I, Birnir B, Issazadeh-Navikas S. Neuron-mediated generation of regulatory T cells from encephalitogenic T cells suppresses EAE. Nat Med. 2006;12:518–25. doi: 10.1038/nm1402. [DOI] [PubMed] [Google Scholar]
- 5.Jia W, Cao L, Yang S, Dong H, Zhang Y, Wei H, et al. Regulatory T cells are protective in systemic inflammation response syndrome induced by zymosan in mice. PLoS One. 2013;8:e64397. doi: 10.1371/journal.pone.0064397. [DOI] [PMC free article] [PubMed] [Google Scholar]
- 6.Kipnis J, Avidan H, Caspi RR, Schwartz M. Dual effect of CD4+CD25+regulatory T cells in neurodegeneration: A dialogue with microglia. Proc Natl Acad Sci U S A. 2004;101(Suppl 2):14663–9. doi: 10.1073/pnas.0404842101. [DOI] [PMC free article] [PubMed] [Google Scholar]
- 7.Kipnis J, Mizrahi T, Hauben E, Shaked I, Shevach E, Schwartz M. Neuroprotective autoimmunity: Naturally occurring CD4+CD25+regulatory T cells suppress the ability to withstand injury to the central nervous system. Proc Natl Acad Sci U S A. 2002;99:15620–5. doi: 10.1073/pnas.232565399. [DOI] [PMC free article] [PubMed] [Google Scholar]
- 8.Cabbage SE, Huseby ES, Sather BD, Brabb T, Liggitt D, Goverman J. Regulatory T cells maintain long-term tolerance to myelin basic protein by inducing a novel, dynamic state of T cell tolerance. J Immunol. 2007;178:887–96. doi: 10.4049/jimmunol.178.2.887. [DOI] [PubMed] [Google Scholar]
- 9.Sakaguchi S, Miyara M, Costantino CM, Hafler DA. FOXP3+ regulatory T cells in the human immune system. Nat Rev Immunol. 2010;10:490–500. doi: 10.1038/nri2785. [DOI] [PubMed] [Google Scholar]
- 10.Beissert S, Schwarz A, Schwarz T. Regulatory T cells. J Invest Dermatol. 2006;126:15–24. doi: 10.1038/sj.jid.5700004. [DOI] [PubMed] [Google Scholar]
- 11.Vignali DA, Collison LW, Workman CJ. How regulatory T cells work. Nat Rev Immunol. 2008;8:523–32. doi: 10.1038/nri2343. [DOI] [PMC free article] [PubMed] [Google Scholar]
- 12.Yan Y, Zhang GX, Gran B, Fallarino F, Yu S, Li H, et al. IDO upregulates regulatory T cells via tryptophan catabolite and suppresses encephalitogenic T cell responses in experimental autoimmune encephalomyelitis. J Immunol. 2010;185:5953–61. doi: 10.4049/jimmunol.1001628. [DOI] [PMC free article] [PubMed] [Google Scholar]
- 13.Liu L, Wei H, Chen F, Wang J, Dong JF, Zhang J. Endothelial progenitor cells correlate with clinical outcome of traumatic brain injury. Crit Care Med. 2011;39:1760–5. doi: 10.1097/CCM.0b013e3182186cee. [DOI] [PMC free article] [PubMed] [Google Scholar]
- 14.O’Connor RA, Anderton SM. Foxp3+ regulatory T cells in the control of experimental CNS autoimmune disease. J Neuroimmunol. 2008;193:1–11. doi: 10.1016/j.jneuroim.2007.11.016. [DOI] [PubMed] [Google Scholar]
- 15.Hilton GD, Stoica BA, Byrnes KR, Faden AI. Roscovitine reduces neuronal loss, glial activation, and neurologic deficits after brain trauma. J Cereb Blood Flow Metab. 2008;28:1845–59. doi: 10.1038/jcbfm.2008.75. [DOI] [PMC free article] [PubMed] [Google Scholar]
- 16.Miyara M, Yoshioka Y, Kitoh A, Shima T, Wing K, Niwa A, et al. Functional delineation and differentiation dynamics of human CD4+ T cells expressing the FoxP3 transcription factor. Immunity. 2009;30:899–911. doi: 10.1016/j.immuni.2009.03.019. [DOI] [PubMed] [Google Scholar]
- 17.Sakaguchi S, Yamaguchi T, Nomura T, Ono M. Regulatory T cells and immune tolerance. Cell. 2008;133:775–87. doi: 10.1016/j.cell.2008.05.009. [DOI] [PubMed] [Google Scholar]


