

Abstract
Background:
Multiple myeloma (MM) is a malignant tumor, which takes the second place in malignant blood disease. The clinical symptoms are complicated that make more difficult to diagnose and therapy. Lots of researches focus on the proteins about MM in order to solve those problems. We used proteomic methods to find potential biomarkers in MM patients.
Methods:
We applied the peptide ligand library beads (PLLBs) to deplete high abundance proteins in serum for finding potential pathogenic factors and biomarkers of MM. Using 1D-Gel-liquid chromatography-tandem mass spectrometry (LC-MS/MS), we identified 789 and 849 unique serum proteins in MM patients and in healthy controls, respectively.
Results:
Twenty-two proteins were found differentially expressed between the two groups including serum amyloid A protein, vitamin D-binding protein isoform-1 precursor, plasma kallikrein, and apolipoprotein A-I. Changes of integrin alpha-11 and isoform-1 of multimerin-1 were validated with Western blotting. The linkage of the differentially expressed proteins and the pathogenesis pathways of MM were discussed.
Conclusions:
PLLB combined with 1D-gel-LC-MS/MS analysis is an efficient method to identify differentially expressed proteins in serum from patients with MM.
Keywords: Integrin Alpha-11, Isoform-1 of Multimerin-1, Liquid Chromatography-tandem Mass Spectrometry, Multiple Myeloma, Peptide Ligand Library Bead
INTRODUCTION
Multiple myeloma (MM) is a clonal B-cell disorder in which malignant plasma cells (PCs) accumulate in the bone marrow, resulting in lytic bone lesions and excessive amounts of monoclonal proteins. Although therapeutic interventions have been developed, and the overall survival has been improved over the last decade,[1] almost all patients with MM, who survive initial treatment will develop drug resistance and relapse. Abnormal methylation of tumor suppressor genes is a common event in malignant PC disorders.[2,3] Aberrant global methylation patterns also affect the molecular pathogenesis of myeloma.[4]
Proteomics has been widely employed for MM research.[5,6,7,8,9,10,11,12,13,14] The potential therapeutic targets in human MM are investigated by differentially profiling of purified MM and normal PCs using two-dimensional (2D) gel electrophoresis.[8] A total of 43 differentially expressed proteins are identified and six of them are confirmed with Western blotting, including profilin-1, glutathione peroxidase 1, annexin A1, proteasome subunit alpha type-5, proteasome activator subunit-2, and proteasome subunit beta type-10. Extensive proteomic studies have also been carried out for studying the response of myeloma cells to drug treatment.[9,13] However, few studies have reported the identification of markers for MM diagnosis. A recent study by Rajpal et al. identified a biomarker panel from serum that predicts the response to thalidomide-based therapy in newly diagnosed myeloma patients. By using a combination of immunodepletion and 2D-DIGE, differentially expressed proteins between responders and nonresponders were detected including zinc-a2-glycoprotein, vitamin D-binding protein, serum amyloid A (SAA), β2-microglobulin (BMG), and haptoglobin[15,16] developed a method for assessing the quality of surface-enhanced laser desorption/ionization time-of-flight (SELDI-TOF) data based on a correlation matrix. The correlation matrix approach was applied to the Mascot. Lytic of bone disease study to efficiently identify low-quality spectra prior to postanalysis. The results demonstrate the potential application of this method in the identification of biomarkers for myeloma associated lytic bone disease. Recently, we applied the SELDI-TOF MS and matrix-assisted laser desorption/ionization TOF (MALDI-TOF) MS to identify serum biomarkers of MM.[17] The limitations of SELDI-TOF analysis include low resolution and the intrinsic limitation of MALDI-TOF as a quantitative tool. Furthermore, it is difficult to further identify proteins on chips or weak cation exchange beads. Therefore, the combination of protein fractionation and liquid chromatography-tandem mass spectrometry (LC-MS/MS) with high-resolution mass spectrometer is an alternative method for protein profiling and biomarker discovery.
One challenge to identify these candidate biomarkers from serum or plasma is that there is an extensive dynamic concentration range of proteins in bio-fluids. Serum albumin is the major carrier and transporter at a concentration of about 45 mg/ml. However, most of the important indicators changing in physiological states may be present at <1 pg/ml. Methods have been developed to deplete the high abundance proteins derived from serum/plasma, such as immunodepletion, organic precipitation, affinity purification and solid phase extraction.[18,19]
Peptide ligand library affinity chromatography is a novel method for capturing and identifying the low abundance proteins.[20] In this method, a solid-phase combinatorial library of hexapeptides is coupled, via a short spacer, on poly (hydroxymethecrylate) beads, by a modified Merrifield approach. The hexapeptide ligands are synthesized from natural amino acids, so the library contains millions of linear hexapeptide that are able to interact with a very large number of proteins present in a complex proteome. Sennels et al.[21] have reported a large-scale proteomic study of human serum using peptide library beads and mass spectrometry. Analysis of the elution from this combinatorial library resulted in the identification of 1559 proteins including a large number of low abundance proteins. In the present work, we applied the peptide ligand library beads (PLLBs)-based affinity method to the differential analysis of myeloma serum samples versus serum samples of healthy individuals. Using a label-free semi-quantitative approach, we found that expression levels of 22 proteins significantly differed between serum samples from healthy control and MM patients.
METHODS
Sample collection
Blood samples were taken from eight patients with MM and eight healthy subjects. All the patients with MM from the MM Research Center at the Beijing Chao-Yang Hospital (Beijing, China) were diagnosed according to the Durie-Salmon staging system. The healthy controls were obtained from the Medical Examination Center of the Beijing Chao-Yang Hospital. The research protocol was approved by the Ethics Committee of Beijing Chao-Yang Hospital. Serum samples were obtained from the peripheral blood by centrifuging at 4000 r/min for 10 min at 4°C, and stored at −80°C until analyzed.
Sample preparation
Serum samples from 8 patients with MM were pooled together. And the eight healthy controls were pooled together, too. A 300 μl sample of the pooled serum samples was centrifuged to eliminate particles in suspension. Eight milligram of the PLLB resin (Peptide International, Lexington, KY) was suspended in 100 μl of 50% methanol for 10 min and was washed three times with phosphate-buffered saline (PBS) solution (pH = 7.4). The PLLBs are currently the product of Bio-Rad Laboratories, Inc. (Hercules, CA, USA) under the trade name of ProteoMiner. The pooled serum samples were incubated with the PLLB resin at room temperature (22–25°C) on a soft shaker for 2 h. After removing the unbound fraction, the PLLB resin was washed three times with PBS solution. Proteins were eluted from the beads by incubating with LDS sample buffer (Invitrogen, Grand Island, NY, USA) at 100°C for 5 min.
Protein separation on 1D-sodium dodecyl sulfate-polyacrylamide gel electrophoresis, in-gel digestion and liquid chromatography-tandem mass spectrometry analysis
Proteins were separated on a 4–12% gradient tris-glycine sodium dodecyl sulfate (SDS)-gel (Invitrogen, USA), and the gel bands were stained with colloidal Coomassie blue (Invitrogen). Each lane was cut into 15 slices and each gel slice was reduced with 10 mmol/L DTT and alkylated with 100 mmol/L iodoacetamide. Then in-gel digestion was carried out with the Sequence Grade Modified Trypsin (Promega) in 50 mmol/L ammonium bicarbonate at 37°C overnight. The peptides were extracted twice with 1% trifluoroacetic acid in 50% acetonitrile aqueous solution for 30 min.
For LC-MS/MS analysis, each digestion product was separated by a 60 min gradient elution at a flow rate of 0.25 μl/min with the Dionex 3000 nano-HPLC system, which was directly interfaced with the Thermo LTQ-Orbitrap mass spectrometer. The analytical column was a home-made fused silica capillary column (75 μm ID, 100 mm length; Upchurch, USA) packed with C-18 resin (300 A, 5 μm, Varian, USA). Mobile phase A consisted of 0.1% formic acid, and mobile phase B consisted of 100% acetonitrile and 0.1% formic acid. The LTQ-Orbitrap mass spectrometer was operated in the data-dependent acquisition mode using the Xcalibur 2.0.7 software (Thermo Fisher Scientific Inc., USA) and there was a single full-scan mass spectrum in the Obritrap (400–1800 m/z, 30,000 resolution), followed by 6 data-dependent MS/MS scans in the ion trap at 35% normalized collision energy.
Data processing
The MS/MS spectra from each LC-MS/MS run were searched against IPI human database by Sequest in ProteinDiscover. The following search parameters were used in all of the Sequest searches: Maximum of 2 missed trypsin cleavages, cysteine carbamidomethylation as a fixed modification, methionine oxidation and N/Q deamination as the variable modification. The maximum error tolerance was 20 ppm for MS and 0.8 Da for MS/MS. The filter is score 1.9 versus 1 charges, 2.2 versus 2 charges, 2.75 versus 3 charges, and at least 1 peptide every protein. Quantitation of protein expression by spectra counts for each identified proteins was carried out using an in-house developed Perl script. Significance was regarded only when the ratio of spectra counts between two groups were more than 2 or <0.5. Extracted ion currents for selected peptides were also used to quantify the protein concentrations from different samples.
Western blotting analysis
Sixty microgram of protein from the pooled serum of 8 patients with MM and eight healthy controls was separated in NuPAGE Novex 4–12% bis-tris gradient gels (Invitrogen) and transferred to a nitrocellulose membranes (Millipore, Billerica, MA, USA) for 30 min using 1 × NuPAGE transfer buffer. Nitrocellulose membranes were blocked overnight at 4°C in blocking buffer (5% skim milk, 0.1% Tween 20, 0.01 mol/L PBS). After washes with washing buffer (0.1% Tween, 0.01 mol/L PBS), the membranes were incubated with primary antibodies in the blocking buffer for 120 min. Antiantibodies antibodies made against specific to integrin alpha-1 and isoform-1 of multimerin-1 (Abcam, Cambridge, MA, USA) were used at 1:1000 and 1:2000 dilution, respectively. After washing, the membrane was incubated with second antibodies (goat anti-mouse/HRP Conjugate, Santa Cruz, Paso Robles, CA, USA) for integrin alpha-1 and isoform-1 of multimerin-1 and detected with the Pierce chemiluminescent (ECL) kit (Thermo, Waltham, MA, USA). Levels of proteins were then quantified by Image Quant TL Activation Wizard software, USA.
RESULTS
Subject characteristics
The patients in our study were newly diagnosed with MM and their serum samples were collected prior to any treatment. Serum samples of healthy people were also collected and used as the controls. The concentrations of BMG and serum albumin were measured as listed in Table 1. BMG is a prognostic factor, and albumin is relevant to the patients’ health status.
Table 1.
Concentrations of BMG and serum albumin for MM patients
| Patients | 1 | 2 | 3 | 4 | 5 | 6 | 7 | 8 |
|---|---|---|---|---|---|---|---|---|
| β2-MG (mg/L) | 23.70 | 4.50 | 3.09 | 5.02 | 10.10 | 1.73 | 4.56 | 11.00 |
| ALB (g/L) | 28.9 | 30.0 | 24.5 | 31.0 | 26.0 | 34.8 | 35.9 | 28.9 |
BMG: β2-microglobulin; MM: Multiple myeloma.
Peptide ligand library bead-based serum sample preparation
As shown in Figure 1, separation of 2 μl of pooled serum is displayed in lanes 1 and 2, indicating that major proteins that is albumin, are overwhelming and make low abundance proteins less visible on the gel. Two elutaions from PLLBs are shown in lanes 3 and 4, indicating the enrichment of low-abundance proteins and the drastically reduced levels of the most abundant proteins present in the serum.
Figure 1.
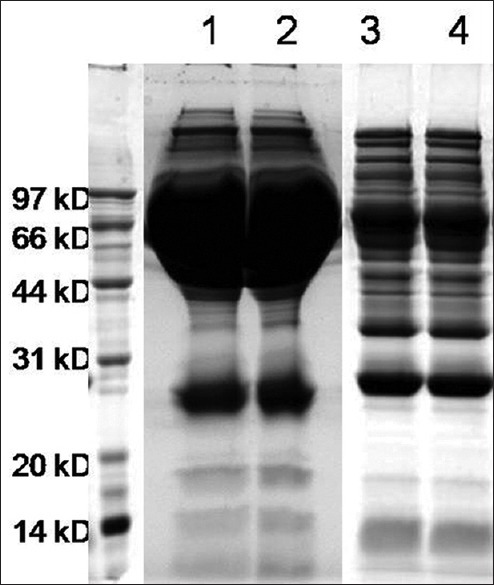
Peptide ligand library bead-based serum sample preparation. Lane 1 and Lane 2: 2 μl of the pooled serum; Lane 3 and Lane 4: The elutions from the peptide ligand library beads.
Identification of proteins by 1D-Gel-LC-MS/MS: Gel bands were excised and digested with trypsin. The tryptic peptides from each gel band were analyzed by LC-MS/MS. Based on the searching criteria for protein hits, 849 and 789 proteins were identified from samples of healthy controls and patients with MM, respectively. The false positive rate for proteins identified with Mascot, as calculated by the decoy database search, was estimated to be 2%. Although the number of proteins identified is not as high as what has been reported, our results are more reliable since the MS measurement was carried out with a LTQ-Obritrap mass spectrometer with the mass measurement error less than 10 ppm. The studies carried out with LTQ usually use 3 Da as the mass measurement error, which greatly increases the false positive rate.
Using PLLB treatment, we were able to identify some low abundance proteins and proteins that are seldom implicated in MM, such as integrin alpha-11 and isoform-1 of multimerin-1. The MS/MS spectra of selected tryptic peptides FVLVQENRPTLTDIVELR from isoform-1 of multimerin-1 and IQNLGLFPIHGMMMK from integrin alpha-11 are displayed in Figure 2a and b, respectively, in which all major fragment ions match the b and y ions of the peptides from these two proteins.
Figure 2.
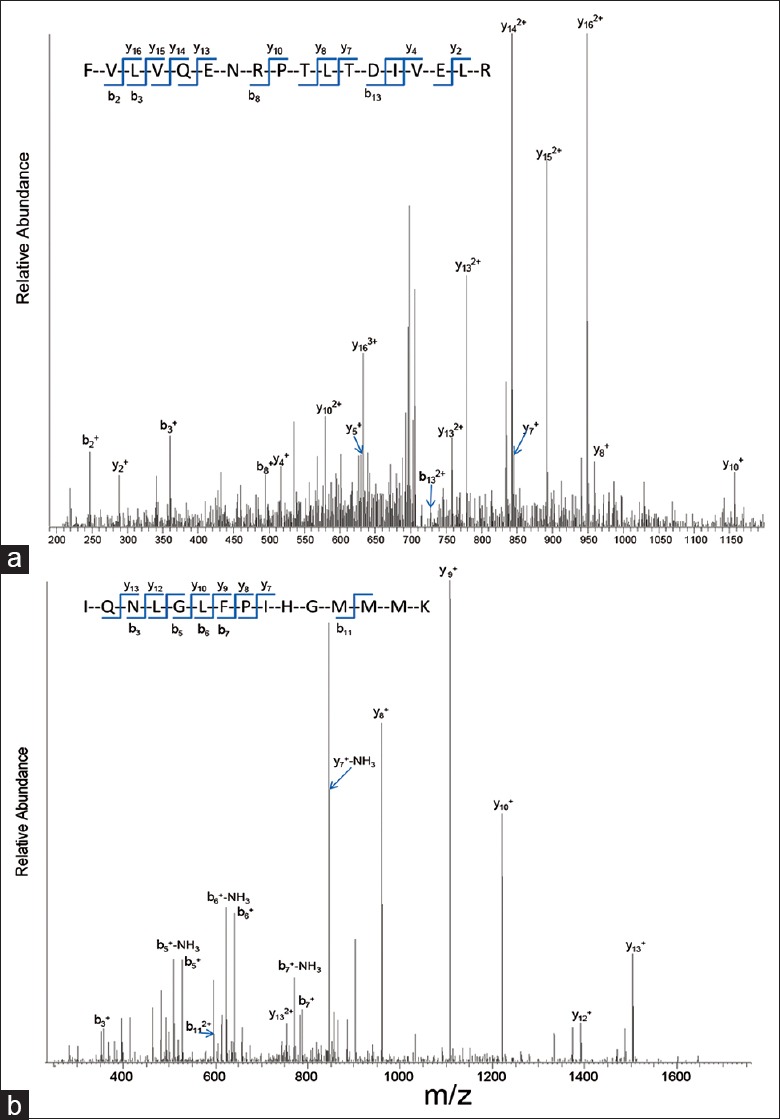
(a) The Mass spectrometry (MS)/MS spectra of selected tryptic peptides FVLVQENRPTLTDIVELR from isoform-1 of multimerin-1; (b) The MS/MS spectra of selected tryptic peptides IQNLGLFPIHGMMMK from integrin alpha-11.
Differential analysis of protein expression between multiple myeloma and controls
Spectral count was used to quantify the expression levels of proteins in the selected gel bands, as well as the whole lane. Spectra count uses the number of spectra that has been assigned to a specific protein, to quantify the relative abundance of protein from two samples, and it has been widely applied to biological systems. Using two-fold or more changes as a determinant, we identified the expression of 10 proteins down-regulated and that of 12 proteins up-regulated in patients with MM compared to healthy controls. We also used an alternative approach, the extracted ion current, to confirm the quantitation results from the spectra counts. These up- and down-regulated proteins are displayed in Table 2.
Table 2.
Differentially expressed serum proteins between patients with MM and healthy controls by PLLB affinity combining with one-dimensional SDS-PAGE gel-LC-MS/MS
| IPI number | Description |
|---|---|
| Up regulated | |
| IPI00006146 | Serum amyloid A2 isoform a |
| IPI00006543 | Complement factor H-related 5 |
| IPI00007221 | Plasma serine protease inhibitor |
| IPI00008554 | Angiogenin |
| IPI00032328 | Isoform HMW of Kininogen-1 |
| IPI00297284 | Insulin-like growth factor-binding protein 2 precursor |
| IPI00552578 | Serum amyloid A protein |
| IPI00896419 | Isoform 1 of inter-alpha-trypsin inhibitor heavy chain H4 |
| IPI00654888 | Plasma kallikrein |
| IPI00020435 | Transcription factor SOX-11 |
| IPI00239413 | Isoform 7 of Nesprin-2 |
| IPI00398625 | Hornerin |
| Down regulated | |
| IPI00021841 | Apolipoprotein A-I |
| IPI00022229 | Apolipoprotein B-100 |
| IPI00029739 | Isoform 1 of complement factor H |
| IPI00163804 | Isoform 1 of NEDD4-binding protein 2-like 1 |
| IPI00385250 | Protease, serine, 3 |
| IPI00553177 | Isoform 1 of alpha-1-antitrypsin |
| IPI00012269 | Isoform 1 of multimerin-1 |
| IPI00218949 | Isoform short of complement factor H-related protein 2 |
| IPI00215613 | Integrin alpha-11 |
| IPI00555812 | Vitamin D-binding protein isoform 1 precursor |
MM: Multiple myeloma; PLLB: Peptide ligand library beads; MS: Mass spectrometry; LC: Liquid chromatography; SDS-PAGE: Sodium dodecyl sulphate-polyacrylamide gel electrophoresis.
Validation of proteomic results by Western blotting analysis
Two of the differentially expressed proteins were selected for immunodetection in undepleted plasma using specific antibodies to integrin alpha-11 and isoform-1 of multimerin-1 and the differential serum levels were confirmed by Western blotting analysis [Figure 3]. The immunoblotting analysis showed decreased integrin alpha-11 in the serum of MM patients with a mean band intensity of (2425 ± 562) (mean optical density units) versus controls at (1177 ± 560) (P < 0.01, Student's t-test, two-tailed). Isoform-1 of multimerin-1 appeared to be down-regulated in MM patients at (3019 ± 641) versus controls at (11,988 ± 846) P < 0.01). Results from Western blotting were consistent with those from spectral counts, showing that both proteins were down-regulated in the MM patients (integrin alpha-11, 116 spectral counts and isoform-1 of multimerin-1, 13 spectral counts) versus healthy controls (integrin alpha-11, 384 spectral counts and isoform-1 of multimerin-1, 44 spectral counts). The relative abundance profiles, as determined by Western blotting analysis, were therefore consistent with the quantitative spectral counts data obtained for these two proteins.
Figure 3.
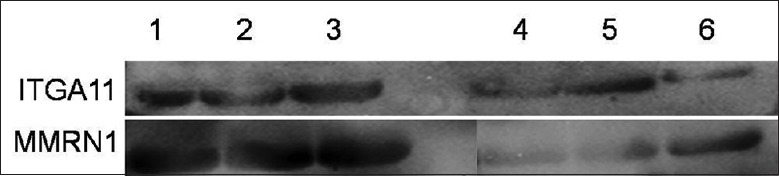
Lane 1, Lane 2 and Lane 3 were the three healthy people's serum; Lane 4, Lane 5 and Lane 6 were the three patient's serum.
DISCUSSION
In the present study, we employed a novel method of peptide ligand library affinity chromatography combining with 1D-gel-LC-MS/MS analysis to identify proteins differentially expressed in the sera of MM patients compared to those of healthy controls. It has been amply documented that the PLLBs are an efficient means to reduce high abundance proteins for the identification of low-abundance proteins. Analysis of serum samples treated with PLLB in triplicate resulted in the identical 1D-SDS images in our experiments and in the literature.
Of the 22 proteins differently expressed in our series, the expression level of apolipoprotein A-I is lower in the sera of MM patients than in sera of healthy individuals. Apolipoprotein A-I is the major apolipoprotein of high-density lipoprotein, and it promotes efflux of cholesterol from cells. It has been found that expression of apolipoprotein A-I is decreased in ovarian cancer.[22] The expression of insulin-like growth factor-binding protein 2 precursor, that regulates the function of insulin is higher in the MM patients. It has been reported that insulin-like growth factor-binding protein 2 is elevated in non-Hodgkin's lymphoma.[23] SAA has been found differentially expressed in renal cancer. We found that the expression of SAA is higher in MM patients. A recent study indicates that the expression level of SAA is higher in serum from MM patients who were nonresponders to thalidomide-based therapy. Our study suggests that SAA may also be a marker for diagnosis of MM. Vitamin D-binding protein, that is a member of a multigene family including alpha-fetoprotein and albumin, reversibly binds and transports vitamin D and its metabolites to target cells. Our study shows that the expression of vitamin D-binding protein is decreased in MM patients. Plasma kallikrein participates in the surface-dependent activation of blood coagulation, fibrinolysis, kinin generation, and inflammation. The expression level of plasma kallikrein was found to be elevated in MM patients in the present study.
We also found two novel proteins, integrin alpha-11 subunit and isoform-1 of multimerin-1 integrin alpha-11 was found to be overexpressed in nonsmall cell lung carcinoma (NSCLC) and in esophageal squamous cell carcinoma.[24] The integrin alpha-11 subunit binds the integrin beta-1 subunit to form a heterodimer, and α11 β1 integrin is one of the four receptors for interstitial collagen to modulate the growth of NSCLC cells.[25] The expression of the integrin alpha-11 subunit is lower in MM patients compare to the normal individuals. Isoform-1 of multimerin-1 was found to be a potential serum biomarker for lung cancer. Normally, multimerin-1 is not detectable in plasma. Using both proteomic analysis and Western blot, we found that the expression of isoform-1 of multimerin-1 is decreased in MM patients. It would be useful to compare the changes in protein concentration before and after therapy, however, we currently do not have enough data for this evaluation. We will do this comparison in the future.
In conclusion, our results demonstrate that PLLB affinity chromatography combining with 1D-gel-LC-MS/MS analysis is a useful method to identify proteins differently expressed in the sera of MM patients. The changes of protein expression are mainly associated with the complement and coagulation cascade, lipid metabolism, and extracellular matrix remodeling, which concomitantly take part in the pathogenesis of MM. Integrin alpha-11 subunit and isoform-1 of multimerin-1are potential biomarkers for diagnosis of MM.
ACKNOWLEDGMENTS
We thank the Cell Biology Facility and the Protein Chemistry Facility at the Center for Biomedical Analysis of Tsinghua University for sample analysis.
Footnotes
Edited by: De Wang
Source of Support: This work was supported in part by the National Natural Science Foundation of China (No. 30872391and No. 31270871).
Conflict of Interest: None declared.
REFERENECES
- 1.Parkin DM, Bray F, Ferlay J, Pisani P. Global cancer statistics, 2002. CA Cancer J Clin. 2005;55:74–108. doi: 10.3322/canjclin.55.2.74. [DOI] [PubMed] [Google Scholar]
- 2.Chapman MA, Lawrence MS, Keats JJ, Cibulskis K, Sougnez C, Schinzel AC, et al. Initial genome sequencing and analysis of multiple myeloma. Nature. 2011;471:467–72. doi: 10.1038/nature09837. [DOI] [PMC free article] [PubMed] [Google Scholar]
- 3.Chim CS, Kwong YL, Fung TK, Liang R. Methylation profiling in multiple myeloma. Leuk Res. 2004;28:379–85. doi: 10.1016/j.leukres.2003.08.008. [DOI] [PubMed] [Google Scholar]
- 4.Walker BA, Wardell CP, Chiecchio L, Smith EM, Boyd KD, Neri A, et al. Aberrant global methylation patterns affect the molecular pathogenesis and prognosis of multiple myeloma. Blood. 2011;117:553–62. doi: 10.1182/blood-2010-04-279539. [DOI] [PubMed] [Google Scholar]
- 5.Micallef J, Dharsee M, Chen J, Ackloo S, Evans K, Qiu L, et al. Applying mass spectrometry based proteomic technology to advance the understanding of multiple myeloma. J Hematol Oncol. 2010;3:13. doi: 10.1186/1756-8722-3-13. [DOI] [PMC free article] [PubMed] [Google Scholar]
- 6.Ge F, Bi LJ, Tao SC, Xu XD, Zhang ZP, Kitazato K, et al. Proteomic analysis of multiple myeloma: Current status and future perspectives. Proteomics Clin Appl. 2011;5:30–7. doi: 10.1002/prca.201000044. [DOI] [PubMed] [Google Scholar]
- 7.Ge F, Li WL, Bi LJ, Tao SC, Zhang ZP, Zhang XE. Identification of novel 14-3-3ζ interacting proteins by quantitative immunoprecipitation combined with knockdown (QUICK) J Proteome Res. 2010;9:5848–58. doi: 10.1021/pr100616g. [DOI] [PubMed] [Google Scholar]
- 8.Xiao CL, Zhang ZP, Xiong S, Lu CH, Wei HP, Zeng HL, et al. Comparative proteomic analysis to discover potential therapeutic targets in human multiple myeloma. Proteomics Clin Appl. 2009;3:1348–60. doi: 10.1002/prca.200900068. [DOI] [PubMed] [Google Scholar]
- 9.Ge F, Zhang L, Tao SC, Kitazato K, Zhang ZP, Zhang XE, et al. Quantitative proteomic analysis of tumor reversion in multiple myeloma cells. J Proteome Res. 2011;10:845–55. doi: 10.1021/pr100992e. [DOI] [PubMed] [Google Scholar]
- 10.Ge F, Xiao CL, Bi LJ, Tao SC, Xiong S, Yin XF, et al. Quantitative phosphoproteomics of proteasome inhibition in multiple myeloma cells. PLoS One. 2010;5:9. doi: 10.1371/journal.pone.0013095. [DOI] [PMC free article] [PubMed] [Google Scholar]
- 11.Lu CH, Ge F, Liu Z, Li R, Xiao CL, Zeng HL. Detection of abundant proteins in multiple myeloma cells by proteomics. J Proteomics Bioinform. 2010;3:5–9. [Google Scholar]
- 12.Ge F, Xiao CL, Yin XF, Lu CH, Zeng HL, He QY. Phosphoproteomic analysis of primary human multiple myeloma cells. J Proteomics. 2010;73:1381–90. doi: 10.1016/j.jprot.2010.03.004. [DOI] [PubMed] [Google Scholar]
- 13.Jia H, Ge F, Lu X, Zeng H, Li L, Chen Z, et al. Proteomics of apoptosis of multiple myeloma cells induced by proteasome inhibitor PS-341. Zhong Nan Da Xue Xue Bao Yi Xue Ban. 2010;35:784–91. doi: 10.3969/j.issn.1672-7347.2010.08.003. [DOI] [PubMed] [Google Scholar]
- 14.Cumova J, Potacova A, Zdrahal Z, Hajek R. Proteomic analysis in multiple myeloma research. Mol Biotechnol. 2011;47:83–93. doi: 10.1007/s12033-010-9326-x. [DOI] [PubMed] [Google Scholar]
- 15.Rajpal R, Dowling P, Meiller J, Clarke C, Murphy WG, O’Connor R, et al. A novel panel of protein biomarkers for predicting response to thalidomide-based therapy in newly diagnosed multiple myeloma patients. Proteomics. 2011;11:1391–402. doi: 10.1002/pmic.201000471. [DOI] [PubMed] [Google Scholar]
- 16.Hong H, Dragan Y, Epstein J, Teitel C, Chen B, Xie Q, et al. Quality control and quality assessment of data from surface-enhanced laser desorption/ionization (SELDI) time-of flight (TOF) mass spectrometry (MS) BMC Bioinformatics. 2005;6(Suppl 2):S5. doi: 10.1186/1471-2105-6-S2-S5. [DOI] [PMC free article] [PubMed] [Google Scholar]
- 17.Wang QT, Li YZ, Liang YF, Hu CJ, Zhai YH, Zhao GF, et al. Construction of amultiple myeloma diagnostic model by magnetic bead-based MALDI-TOF mass spectrometry of serum and pattern recognition software. Anat Rec Adv Integr Anat Evol Biol. 2009;292:604–10. doi: 10.1002/ar.20871. [DOI] [PubMed] [Google Scholar]
- 18.Hammond D, Lathrop J. FIoNA: The discovery of trace therapeutic proteins from complex biological mixtures. Innov Pharm Technol. 2005;17:38–41. [Google Scholar]
- 19.Fortis F, Guerrier L, Areces LB, Antonioli P, Hayes T, Carrick K, et al. A new approach for the detection and identification of protein impurities using combinatorial solid phase ligand libraries. J Proteome Res. 2006;5:2577–85. doi: 10.1021/pr060090s. [DOI] [PubMed] [Google Scholar]
- 20.Thulasiraman V, Lin S, Gheorghiu L, Lathrop J, Lomas L, Hammond D, et al. Reduction of the concentration difference of proteins in biological liquids using a library of combinatorial ligands. Electrophoresis. 2005;26:3561–71. doi: 10.1002/elps.200500147. [DOI] [PubMed] [Google Scholar]
- 21.Sennels L, Salek M, Lomas L, Boschetti E, Righetti PG, Rappsilber J. Proteomic analysis of human blood serum using peptide library beads. J Proteome Res. 2007;6:4055–62. doi: 10.1021/pr070339l. [DOI] [PubMed] [Google Scholar]
- 22.Zhang Z, Bast RC, Jr, Yu Y, Li J, Sokoll LJ, Rai AJ, et al. Three biomarkers identified from serum proteomic analysis for the detection of early stage ovarian cancer. Cancer Res. 2004;64:5882–90. doi: 10.1158/0008-5472.CAN-04-0746. [DOI] [PubMed] [Google Scholar]
- 23.Mohnike K, Kluba U, Blum WF, Aumann V, Vorwerk P, Mittler U. Serum concentrations of insulin-like growth factors (IGF)-I and IGF-II and IGF binding proteins (IGFBP)-2 and IGFBP-3 in 49 children with ALL, NHL or solid tumors. Klin Padiatr. 1995;207:225–9. doi: 10.1055/s-2008-1046545. [DOI] [PubMed] [Google Scholar]
- 24.Chai J, Modak C, Ouyang Y, Wu SY, Jamal MM. CCN1 induces ß-catenin translocation in esophageal squamous cell carcinoma through integrin a11. ISRN Gastroenterol 2012. 2012 doi: 10.5402/2012/207235. 207235. [DOI] [PMC free article] [PubMed] [Google Scholar]
- 25.Zeng X, Hood BL, Sun M, Conrads TP, Day RS, Weissfeld JL, et al. Lung cancer serum biomarker discovery using glycoprotein capture and liquid chromatography mass spectrometry. J Proteome Res. 2010;9:6440–9. doi: 10.1021/pr100696n. [DOI] [PMC free article] [PubMed] [Google Scholar]