Abstract
Optical coherence tomography (OCT) is becoming an increasingly important imaging technology in the Biomedical field. However, the application of OCT is limited by the ubiquitous noise. In this study, the noise of OCT heart tube image is first verified as being multiplicative based on the local statistics (i.e. the linear relationship between the mean and the standard deviation of certain flat area). The variance of the noise is evaluated in log-domain. Based on these, a joint probability density function is constructed to take the inter-direction dependency in the contourlet domain from the logarithmic transformed image into account. Then, a bivariate shrinkage function is derived to denoise the image by the maximum a posteriori estimation. Systemic comparative experiments are made to synthesis images, OCT heart tube images and other OCT tissue images by subjective assessment and objective metrics. The experiment results are analysed based on the denoising results and the predominance degree of the proposed algorithm with respect to the wavelet-based algorithm. The results show that the proposed algorithm improves the signal-to-noise ratio, whereas preserving the edges and has more advantages on the images containing multi-direction information like OCT heart tube image.
1 Introduction
Optical coherence tomography (OCT) is used to image the structure and function of the developing embryonic avian heart [1]. It is a non-invasive and contact-free technology that can deliver high resolution images. Therefore it becomes an ideal imaging technique to study the formation of the chicken heart tube [2]. However, since a coherent detection is needed to extract the weak signal in a wide dynamic range, the OCT signal is subject to the speckle noise: the image quality is degraded because of the grainy appearance and obscuring small-intensity features [3]. This limits the subsequent application of the OCT images, for example image segmentation, registration, restoration and three-dimensional (3D) reconstruction. Therefore image denoising is a key step for the study of the chicken heart tube with the OCT technology. The noise model is the basic component to deduce a reasonable denoising algorithm, [4] indicated that the introduction of the noise statistical information is able to obtain a better denoising algorithm. As a result, it is important to discuss the noise model of OCT heart tube image to obtain an effective denoising method, which will be discussed in Section 2.
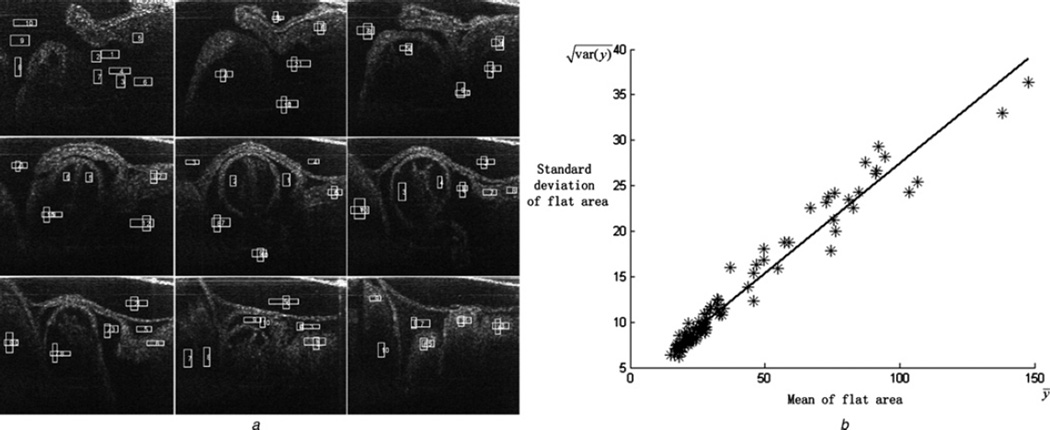
In respect to OCT image denoising methods, space domain methods improve the OCT heart tube image quality to certain extent while the edges are always blurred. For example Lee filter [5], rotating Kernel transformation (RKT) filter [6], weighted median filter [7] are used to denoising the OCT image. However, the denoising effects are limited [4, 8]. In the frequency domain, the wavelet transform is an important method for image denoising because of its excellent time-frequency characteristics [9–13]. Adler et al. [9] proposed an OCT image denoising algorithm by combining the wavelet-based method with a special spatial structure of the OCT image, such as the horizontal structures of OCT retinal images. Deng and Liang [10] proposed a wavelet-based OCT image denoising method based on the bivariate shrinkage function [11]. So far, the regions of interesting (ROIs) of the images being studied by the aforementioned methods are mostly around the boundary of two fields, and the attention was specially paid to horizontal edges, such as the OCT retinal images [9, 10]. However, there are more types of objects or ROIs in OCT heart tube images, as shown in Fig. 1a. The wavelet transform lacks directionality and can only represent horizontal, vertical and diagonal information of the image. For denoising other types of structures as shown in Fig. 1a, a more flexible orientation-adaptive transform method is highly needed.
Fig. 1.
Flat ROIs in nine OCT heart tube images and the relationship between their corresponding mean and standard deviation
a Flat regions selected from nine OCT heart tube images
b Mean and standard deviation of the selected regions
The mean and standard deviation fit a linear relationship, as shown in Fig. 1b
Candes and Donoho proposed the curvelet transform that can capture the intrinsic geometrical structures such as curved edges in an image [14]. The method was improved and applied to image denoising by Starck et al. [15] and was introduced to OCT image denoising by Jian et al. [16]. Inspired by the curvelet transform, Do and Vetterli proposed the contourlet transform for image expansion [17]. Compared with the wavelet and curvelet transform, the contourlet transform offers a high degree of directionality and anisotropy and does a better job in the image expansion. There have since then been many applications employing the contourlet transform for denoising various types of images [17–22]. However, according to the reviews in [4, 8], there have been few literatures studying the OCT image denoising based on the contourlet transform. In addition, Po and Do revealed the strong inter-direction dependency among contourlet coefficients [20]. This means that the thresholding rules for contourlet-based denoising should take the inter-direction dependency into account.
In this paper, we focus on denoising the OCT heart tube image without layered structure as shown in Fig. 1a. The paper is organised as follows. Section 2 experimentally verifies that the noise of OCT heart tube images is multiplicative instead of additive and evaluates the statistic of noise in log-domain. Section 3 introduces our new OCT image denoising algorithm based on the contourlet transform and the exploration of the coefficient inter-direction dependency. The experimental results in Section 4 show that the proposed algorithm outperforms all aforementioned algorithms, especially for the images containing multi-direction like OCT heart tube image. Moreover, finally Section 5 draws conclusions and summarises the future work. The parts of preliminary works are published in [23].
2 Noise analysis of OCT heart tube images
The noise estimation is of importance to denoising algorithm and is directly related to the type of the noise, several literatures have discussed the method of estimating noise [24–26]. The speckle noise in OCT image is usually regarded as multiplicative noise [11]. However, few papers have verified this in detail. In this section, we provide experimental evidence to prove that the noise of OCT heart tube image is indeed multiplicative. Thus, the logarithmic transform can be performed on the OCT image to obtain an additive noise model which can be handled more effectively than the multiplicative model. Moreover, the standard deviation of the additive noise is derived in the log-domain.
2.1 Noise model of OCT heart tube image
Let the noise model of OCT be as follows
| (1) |
where y is the observed image, x is the noiseless image and n is the noise. In order to verify this noise model, the statistics of flat areas in the OCT heart tube image are discussed. The mean and the variance of y in flat areas can be obtained by assuming the independence between x and n, as shown in the following equations
| (2) |
| (3) |
where k is the mean of the noise n. For flat areas, var(x) ≃ 0, and we obtain
| (4) |
Substitute (4) and (2) into (3), we obtain
| (5) |
Then the standard deviation of noise σn can be obtained as follows
| (6) |
If the OCT heart tube images meet the assumption of (1), the standard deviation and mean of the flat areas are in a linear relationship, and the ratio should be σn/k. In order to verify this relationship, the standard deviation and mean of the flat areas selected from ten OCT heart tube images are calculated and presented in Figs. 1a and b. Fig. 1a contains nine of the selected images. Using a straight line to fit the points in Fig. 1b, we can obtain the slope of the line, that is, the ratio of standard deviation σn and mean k of the noise. The experiment illustrates that the standard deviation and mean of flat areas are indeed in a linear relationship. This evidently indicates that the noise of the OCT heart tube image is multiplicative.
2.2 Additive noise model in log-domain
Since many denoising algorithms were proposed based on the additive noise model, the multiplicative noise is transformed to additive noise through the logarithmic transform and analysed in detail as follows
| (7) |
The noise in log-domain can be written as
| (8) |
The equation above can be rewritten as function of (n−k)
| (9) |
The expression (9) can be extended into a (n−k) power series with Taylor expansion
| (10) |
Then we can obtain
| (11) |
| (12) |
Let the mean of the multiplicative noise k be 1 (which is a reasonable hypothesis because the mean of multiplicative k is the reflectance ratio of the OCT system), we can obtain Eη = 0 and . Furthermore, we assume that the noise of OCT heart tube image has a Gaussian distribution of (0, σn) in the log-domain.
3 Denoising method based on bivariate shrinkage function in contourlet domain
In this section, the bivariate shrinkage function is derived exploiting inter-direction dependency in contourlet domain. The inter-direction dependency shows the relationship between the reference coefficient (the coefficient we want to handle) and its cousin coefficient (the coefficient at the same scale and spatial location but in another different direction). The empirical joint distribution of the reference-cousin contourlet coefficient pairs is investigated and modelled by a non-Gaussian probability density function (PDF). Finally, a bivariate shrinkage function is derived and used to reduce the noise of OCT heart tube image.
3.1 Joint distribution model of contourlet coefficients
After logarithmic transform and contourlet transform, we obtain
| (13) |
| (14) |
where y1 and y2 are the observations of the noisy coefficient and its cousin, respectively; wi and εi are the noiseless coefficient and the noise element in contourlet domain, respectively.
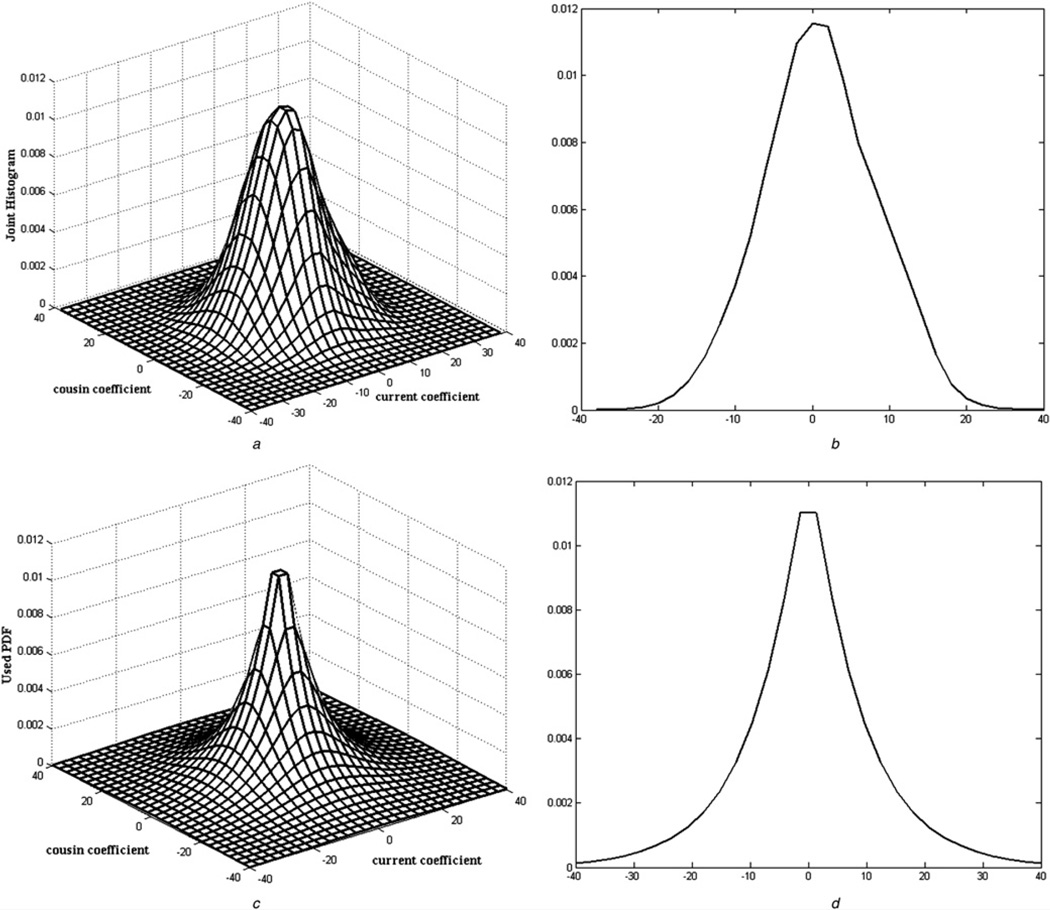
The high signal-to-noise ratio (SNR) and approximate noiseless OCT images in [27] are used to reveal the empirical joint distribution of reference-cousin contourlet coefficient pairs shown in Figs. 2a and b. The distribution has a high peak value and long trailing and apparently does not fit to the Gaussian distribution model. We use a non-Gaussian PDF as (15) to model the above joint distribution shown in Figs. 2c and d
| (15) |
where K is a constant which represents the amplitude of the distribution showed in Fig. 2c and σ is the standard deviation of noiseless coefficients.
Fig. 2.
Empirical and bivariate PDF based joint distributions for the contourlet coefficients
a Empirical joint reference-cousin histogram of contourlet coefficients
b and d 2D cross-sections of Figs. 2a and c, respectively
c Bivariate PDF proposed for joint PDF to simulate Fig. 2a is defined in (15)
3.2 Inter-direction dependency-based shrinkage function
Combining (13) and (14), we obtain
| (16) |
where y = (y1, y2), w = (w1, w2), ε = (ε1, ε2).
The standard maximum a posteriori (MAP) estimation for w given y is
| (17) |
According to the Bayesian rule, (17) can be rewritten as
| (18) |
As shown in (18), in order to calculate the estimation of w, the PDF of the noise is required. In Section 2, the type, mean and standard deviation of the noise in OCT heart tube image have been discussed in the log-domain. The noise still obeys a Gaussian distribution of (0, σn) after performing the contourlet transform. Its PDF can be written as
| (19) |
Equations (15) and (19) are used to deduce the evaluate of noiseless coefficient, the result can be written as (20) and (21). The detailed derivation can be found in [11]
| (20) |
where (see (21))
| (21) |
3.3 OCT image denoising algorithm
Using the shrinkage function deduced above to reduce the noise of the OCT heart tube image in coutourlet domain, the steps are shown as follows:
Apply sequentially the logarithmic transform and the contourlet transform on the OCT heart tube image.
Obtain the cousin coefficient y2 corresponding to the reference coefficient y1.
Calculate σn using the method explained in Section 2.
Obtain the standard deviation using the , where σy1 is the standard deviation of the neighbour coefficients of y1.
Substitute the above parameters into (20) and obtain w1 of each noisy contourlet coefficient.
Obtain the denoised image by applying sequentially the inverse contourlet transform and the exponential transform.
4 Experiments and analysis
In this section, systemic comparisons with several denoising approaches are made through three metrics, namely SNR, contrast-to-noise ratio (CNR) and equivalent number of look (ENL).
In order to make a further analysis about the advantage of the proposed algorithm over the existed classic algorithms, the synthetic images with noise and OCT heart tube images serve as experiment images and are grouped into two parts, one is made up by the images only containing horizontal structure, another consists of the images with multi-direction structures. The analysis of the experiment results will be made according to value of metrics, denoising effect and the predominance degree over classic denoising methods. The denoising experiment of OCT retinal images is also made to show the expanding application of the proposed method.
4.1 Evaluation metrics
The three metrics are defined as
| (22) |
| (23) |
| (24) |
where um and σm are the mean and standard deviation of the mth ROI, and ub and σb are the mean and standard deviation of the background (region without object but just noise), respectively. CNR measures the contrast between an image feature points and the background noise. ENL is a measure of the smoothness of a homogeneous ROI [11].
4.2 Comparison and analysis of denoising algorithm
The proposed and existing classic denoising algorithms are used to denoise the experiment images. The metrics and denoising results are calculated and analysed, respectively.
4.2.1 Denoising experiments
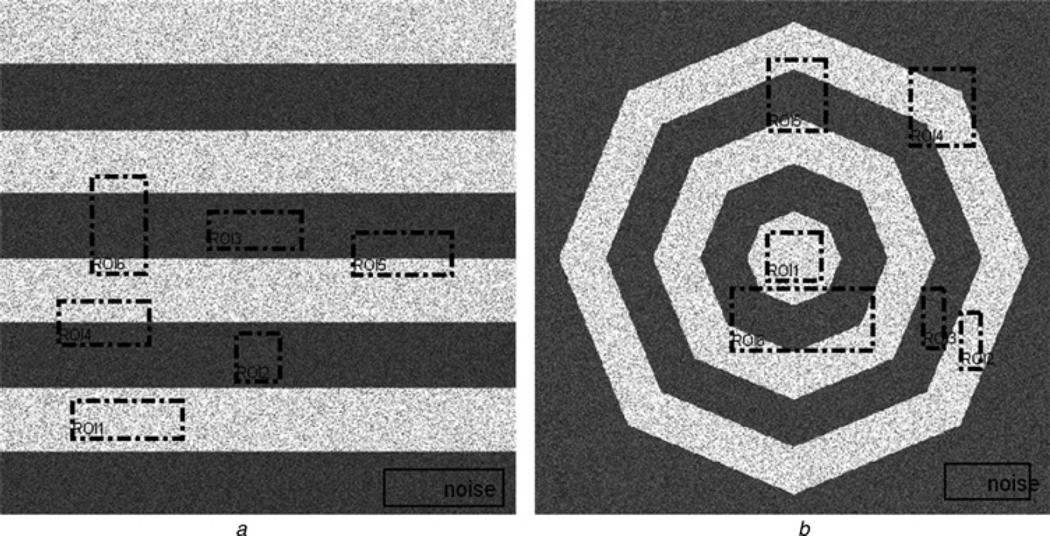
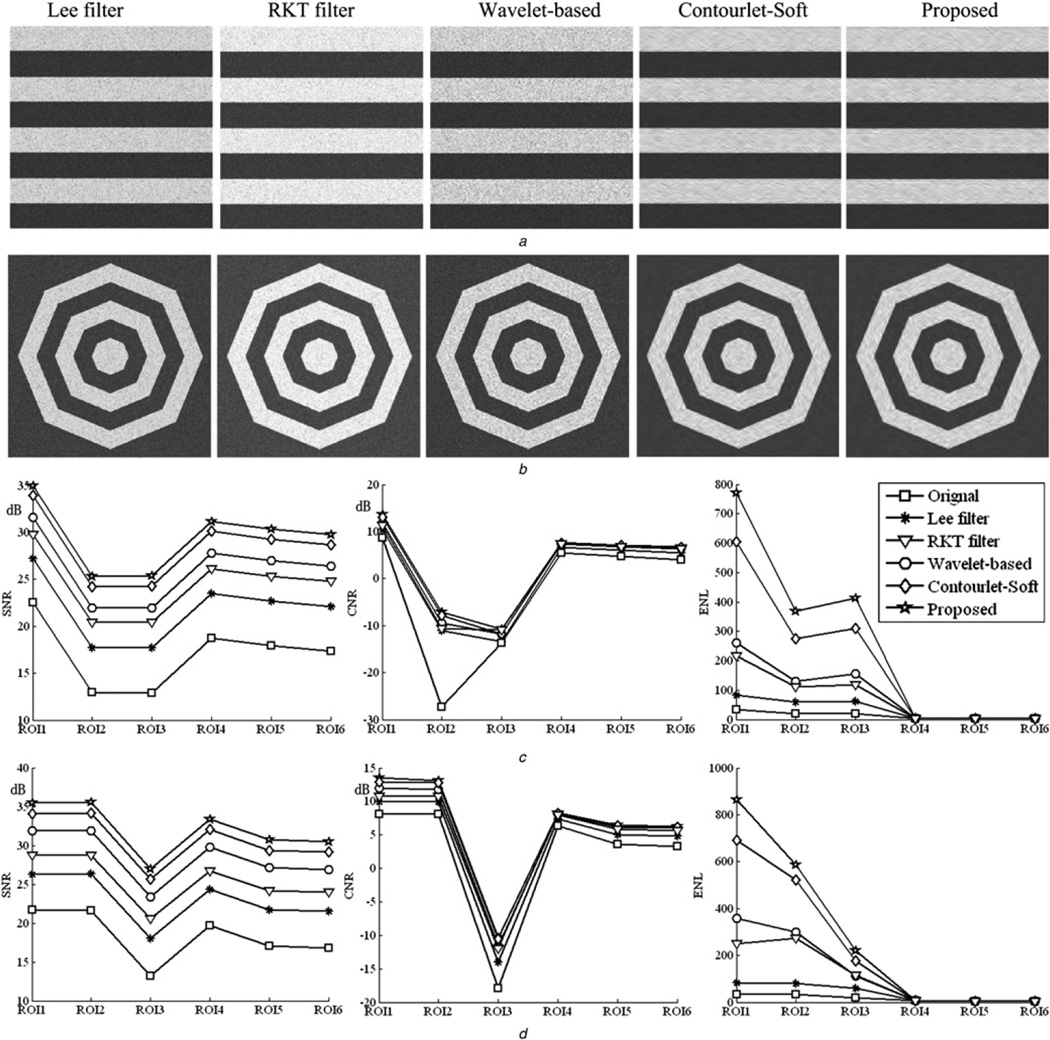
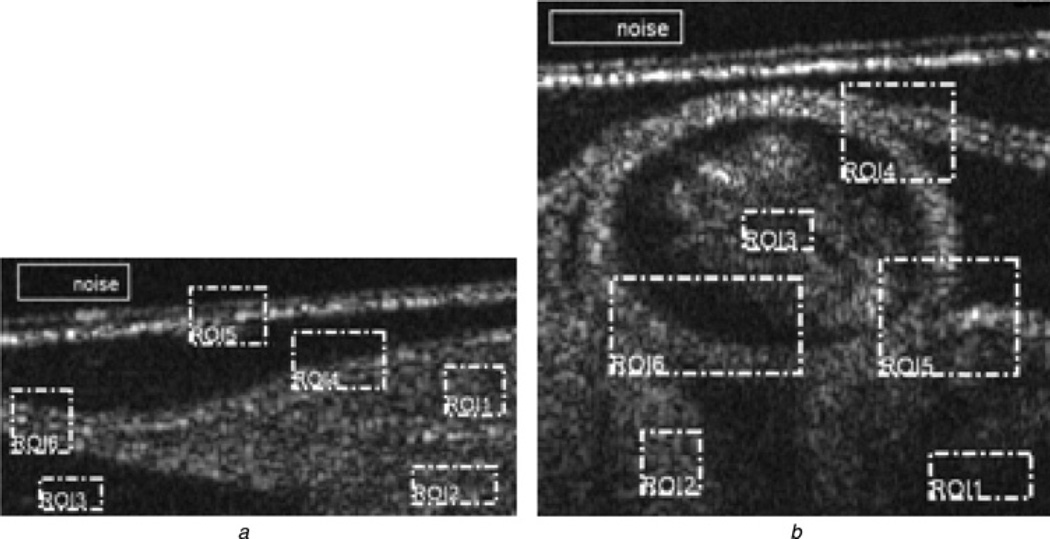
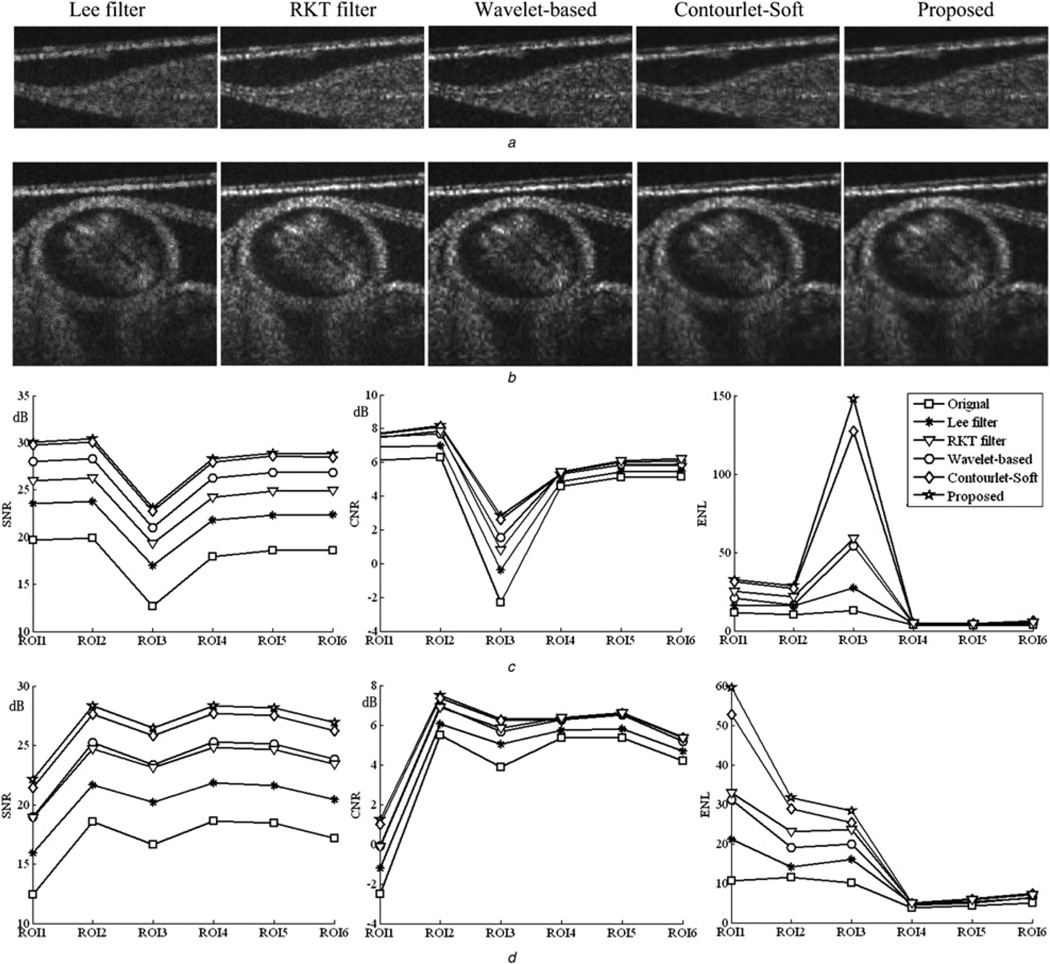
(A) Synthetic image denoising: RKT filter [6], Lee filter [5], wavelet denosing algorithm based on bivariate function [11], contourlet soft-thresholding algorithm [17] and the proposed method are used to denoise the synthetic images added multiplicative Gaussian noise of mean 1 and variance 0.5, shown in Figs. 3a and b. The window size used in space domain methods is 3 × 3. Fig. 3a mainly contains horizontal structure, Fig. 3b contains multi-direction edges. In the figures, the dotted box labelled by ‘ROIi’ are the regions of interest (ROI) which are used to calculate the metrics, where ROI1–3 are the flat regions and ROI4–6 are the edge regions, the region labelled by ‘noise’ is the background region. Figs. 4a and b display the denoising results of Figs. 3a and b via the mentioned algorithms which are shown on the top of Fig. 4. Figs. 4c and d show the metrics of denoised images, corresponding to the metrics of five denoised images of (a) and (b), respectively.
Fig. 3.
The noisy synthetic images
a and b Two synthetic images added multiplicative noise with the Gaussian distribution of (1, 0.05)
The dotted boxes marked by ‘ROIi’ are the regions of interest, the solid box marked by ‘noise’ are the region of noise
Fig. 4.
Denoising results and metric values of each algorithms for synthetic images
a and b Denoised images of Figs. 3a and b using different algorithms
c and d are the SNR, CNR and ENL values of images shown in Figs. 4a and b
(B) OCT heart tube image denoising: According to the experiment method used in (A), we perform the same process to the OCT heart tube images shown in Figs. 5a and b. Fig. 5a is the tissue out of heart tube, mainly containing horizontal structure; Fig. 5b is heart tube image, containing multi-direction edges. Fig. 6 shows the denoising results and their corresponding metrics.
Fig. 5.
Two OCT heart tube images
a Is the tissue out of heart tube
b Is the hear tube image, the centre of the image is the heart tube containing various information of different directions
Fig. 6.
Denoising results and metric values of all algorithms for OCT heart tube images
a and b are the denoised images of Figs. 5a and b using different algorithms
c and d are the SNR, CNR and ENL values of images shown in Figs. 6a and b
4.2.2 Analysis of denoising results
(A) Overview analysis: According to the denoising results shown in Figs. 4a,b and 6a,b, comparing with the space domain methods, the frequency domain methods do better in denoising, especially the contourlet-based algorithms. The metrics shown in Figs. 4c,d and 6c,d further demonstrate the advantage of the proposed algorithm: the proposed method effectively improves the SNR of original image and achieves better value than wavelet-based method in all experiment images; in respect of CNR, the advantage of proposed method is not prominent; In respect of ENL, the proposed method has greater advantages in the flat regions, that is ROI1–3, which indicates that the proposed method can preserve the smoothness of homogeneous regions. In general, since the contourlet transform can represent the image in a sparser way than wavelet transform, the contourlet-based denoising methods can achieve better results.
(B) Difference of advantages: This part discusses the predominance degree of the proposed method and contourlet soft-thresholding method relative to the wavelet-based method in images containing different direction structure, that is, Figs. 3a,b and 5a,b. Because the SNR reflects the noise level of image effectively, the difference of SNR improved by different algorithms is used to represent the predominance degree. The analysis results are shown in Fig. 7, the legend is known as ‘name of denoising image_name of algorithm used’. For example ‘FIG3a_Proposed’ means the SNR gain of the proposed method with respect to the wavelet-based method in processing the synthetic image shown in Fig. 3a. The contourlet soft-thresholding algorithm is labelled as ‘CTSoft’.
Fig. 7.
Predominance degree of two contourlet-based algorithms relative to the wavlet-based algorithm about SNR
a SNR difference of the denoised images of Figs. 3a and b using the contourlet-based algorithms and the wavelet-based algorithm
b SNR difference of the denoised images of Figs. 5a and b using the contourlet-based algorithms and the wavelet-based algorithm
As it shown in Fig. 7a, the ‘FIG3b_Proposed’ is nearly 3 dB larger than ‘FIG3a_Proposed’; ‘FIG3b_CTSoft’ and ‘FIG3a_CTSoft’ have the same result. Fig. 7b indicates that ‘FIG5b_Proposed’ is nearly 1 dB larger than ‘FIG5a_ Proposed’, as do ‘FIG5b_CTSoft’ and ‘FIG5a_CTSoft’. So we can come to conclusion as follows:
In all experiment images, the contourlet-based methods achieve better denoising results than wavelet-based method. However, the advantages are greater in the images containing multi-direction structures, that is, Figs. 3b and 5b.
In all ROIs of an image, the advantages over wavelet-based method are almost the same, which indicates that the advantages are stable.
In general, because of the multi-direction of contourlet transform, the proposed algorithm will have better denoising effect when handling the images containing multi-direction. However, the wavelet transform can decompose image into three directions, that is horizontal, vertical and diagonal direction. As a result, the advantage of proposed method mainly due to the sparsity of contourlet transform when handling the images only containing horizontal (or vertical, diagonal) direction.
(C) Further analysis: The paper proposes a bivariate function based on inter-direction dependency to achieve threshold denoising in contourlet domain. In order to demonstrate the validity of this method, we introduce the contourlet soft thresholding denoising algorithm to perform a comparison.
The denoising results shown in Figs. 4a,b and 6a,b indicate that both methods improve the quality of experiment images efficiently. However, the metrics shown in Figs. 4c,d and 6c,d and the difference of advantages shown in Fig. 7 illustrate that the proposed method do better in improving SNR and smoothness of the original noisy images, which dues to taking the inter-direction dependency into account.
4.3 Other OCT images denoising experiment
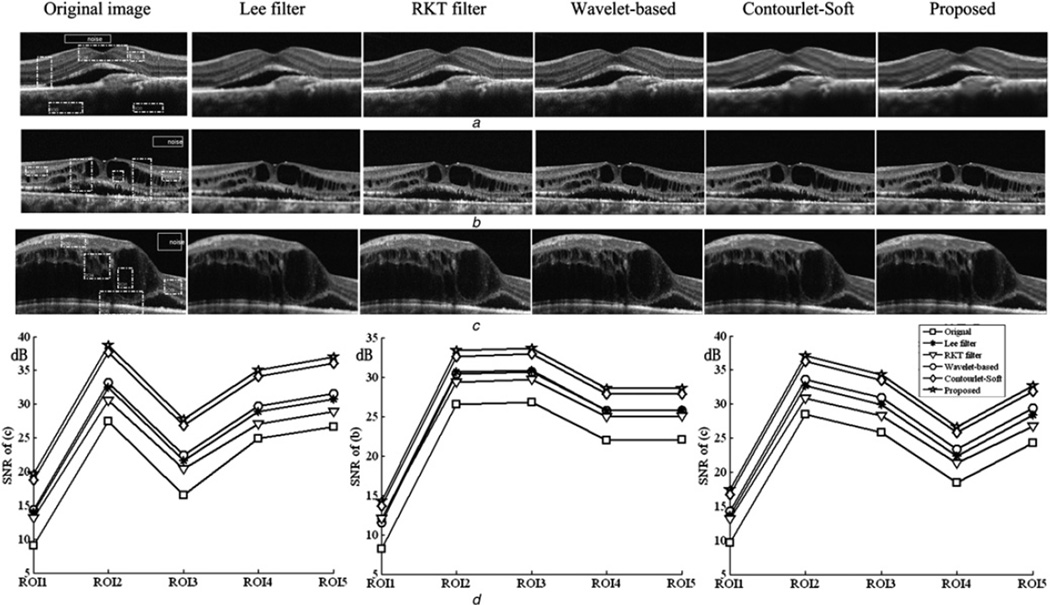
Using algorithms mentioned above to denoise the OCT retinal images which are downloaded from http://www.optos.com/, the results are shown in Fig. 8. The results illustrate the advantages of proposed method again.
Fig. 8.
Denoising results of the OCT retinal images
a and c are the denoised images of three OCT retinal images using different algorithms
d Graphs from left to right are the SNR values of denoised images shown in Figs. 8a–c, respectively
5 Summary and future work
In this paper, the noise of OCT heart tube image is analysed and the variance of the noise in log-domain is derived. The contourlet transform of OCT heart tube image is investigated and a non-Gaussian PDF model is constructed based on the inter-direction dependency. A bivariate shrinkage function is obtained by using MAP and is further used to reduce the noise of OCT heart tube image in contourlet domain. The experiment results demonstrate the superior performance of the new method compared with previous approaches.
A basic assumption of the proposed algorithm is that the noise of OCT heart tube image is modelled by a single Gaussian. However, the speckle is not only noise source but also signal vehicle [28]. Therefore one of the future works is to study the noise in more detail for a more accurate noise model.
Acknowledgments
This project is supported by the National Natural Science Foundation of China (nos. 61102155, 61272237, 61272236), Outstanding Young and Middle-aged Innovative Research Team Plan of Hubei Province of China (T201002), the Graduate students scientific research innovation fund of the China Three Gorges University (no. 2012CX044).
References
- 1.Wang R, Yun JX, Yuan XC, Goodwin R, Markwald R, Gao B. Proc. SPIE7889. San Francisco, USA: 2011. Jan, An approach for megahertz OCT: streak mode Fourier domain optical coherence tomography; pp. 788920–788925. [DOI] [PMC free article] [PubMed] [Google Scholar]
- 2.Huang D, Swanson EA, Lin CP, et al. Optical coherence tomography. Science. 1991;254(5035):1178–1181. doi: 10.1126/science.1957169. [DOI] [PMC free article] [PubMed] [Google Scholar]
- 3.Lin L, Gao YJ, Zhang M. Proc. SPIE7845, Optics in Health Care and Biomedical Optics IV. Beijing, China: 2010. Nov, Signal and noise analysis of optical coherence tomography in highly scattering material at 1550 nm. [Google Scholar]
- 4.Aleksandra P, Ljubomir J, Bruno H, et al. Multiresolution denoising for optical coherence tomography : a review and evaluation. Curr. Med. Imaging Rev. 2010;4(4):270–284. [Google Scholar]
- 5.Lee JS. Speckle analysis and smoothing of synthetic aperture radar images. Comput. Graph. Image Process. 1981;17(1):24–32. [Google Scholar]
- 6.Rogowska J, Brezinski M. Evaluation of the adaptive speckle suppression filter for coronary optical coherence tomography imaging. IEEE Trans. Med. Imag. 2000;19(12):1261–1266. doi: 10.1109/42.897820. [DOI] [PubMed] [Google Scholar]
- 7.Hojjatoleslami A, Avanaki MRN. OCT skin image enhancement through attenuation compensation. Appl. Opt. 2012;51(21):4927–4935. doi: 10.1364/AO.51.004927. [DOI] [PubMed] [Google Scholar]
- 8.Ozcan A, Bilenca A, Desjardins AE, Bouma BE, Tearney GJ. Speckle reduction in optical coherence tomography images using digital filtering. J. Opt. Soc. Am. A. 2007;24(7):1901–1910. doi: 10.1364/josaa.24.001901. [DOI] [PMC free article] [PubMed] [Google Scholar]
- 9.Adler DC, Ko TH, Fujimoto JG. Speckle reduction in optical coherence tomography images by use of a spatially adaptive wavelet filter. Opt. Lett. 2004;29(24):2878–2880. doi: 10.1364/ol.29.002878. [DOI] [PubMed] [Google Scholar]
- 10.Deng JX, Liang YM. Noise reduction with wavelet transform in optical coherence tomographic images. Acta Photonica Sin. 2009;29(8):2138–2141. [Google Scholar]
- 11.Sendur L, Selesnick IW. Bivariate shrinkage functions for wavelet-based denoising exploiting inter-scale dependency. IEEE Trans. Signal Process. 2002;50(11):2744–2756. [Google Scholar]
- 12.Chang SG, Bin Y, Vetterli M. Adaptive wavelet thresholding for image denoising and compression. IEEE Trans. Image Process. 2000;9(9):1532–1546. doi: 10.1109/83.862633. [DOI] [PubMed] [Google Scholar]
- 13.Zhao HW, Lian BW, Feng J. Adaptive wavelet transformation for speckle reduction in optical coherence tomography images. Proc. IEEE Int. Conf. on Signal Processing, Communications and Computing (ICSPCC), Xi’an; September 2011; China. pp. 1–5. [Google Scholar]
- 14.Cande`s EJ, Donoho DL. Curvelets-a surprisingly effective nonadaptive representation for objects with edges. In: Rabut C, Cohen A, Schumake LL, editors. Curve and surface. Nashville, TN: Vanderbilt University Press; 2000. pp. 105–120. [Google Scholar]
- 15.Starck JL, Cande`s EJ, Donoho DL. The curvelet transformfor image de-noising. IEEE Trans. Image Process. 2002;6(11):670–684. doi: 10.1109/TIP.2002.1014998. [DOI] [PubMed] [Google Scholar]
- 16.Jian ZP, Yu ZX, Yu LF, Rao B, Chen ZP, Bruce JT. Speckle attenuation in optical coherence tomography by curvelet shrinkage. Opt. Lett. 2009;34(10):1516–1518. doi: 10.1364/ol.34.001516. [DOI] [PMC free article] [PubMed] [Google Scholar]
- 17.Do MN, Vetterli M. The contourlet transform: a efficient directional multiresolution image representation. IEEE Trans. Image process. 2005;14(12):2091–2106. doi: 10.1109/tip.2005.859376. [DOI] [PubMed] [Google Scholar]
- 18.Tsakanikas P, Manolakos I. Effective denoising of 2D gel proteomics images using contourlets. Proc. IEEE Int. Conf. on Image Processing (ICIP); September 2007; San Antonio, TX. pp. 269–272. [Google Scholar]
- 19.Zhou Y, Wang J. Image denoising based on the symmetric normal inverse Gaussian model and non-subampled contourlet transform. IET Image Process. 2012;6(8):1136–1147. [Google Scholar]
- 20.Po DDY, Do MN. Directional multiscale modeling of images using the contourlet transform. IEEE Trans. Image Process. 2006;6(15):1610–1620. doi: 10.1109/tip.2006.873450. [DOI] [PubMed] [Google Scholar]
- 21.Liu G, Zeng X, Liu Y. Image denoising by random walk with restart kernel and non-subsampled contourlet transform. IET Signal Process. 2012;6(2):148–158. [Google Scholar]
- 22.Tzeng J, Freund Y, Truong N. Using daboost on contourlet based image deblurring for fluid lens camera systems. Proc. IEEE Int. Conf. on Image Processing (ICIP); September 2010; Hong Kong, China. pp. 1173–1176. [Google Scholar]
- 23.Guo Q, Sun S, Dong F, Gao Z, Wang R. Optical coherence tomography heart tube image denoising based on contourlet transform. Proc. of 2012 Int. Conf. on Machine Learning and Cybernetics (ICMLC), Xi’an; July 2012; China. pp. 1139–1144. [DOI] [PMC free article] [PubMed] [Google Scholar]
- 24.Donoho DL, Johnstone IM. Ideal spatial adaptation by wavelet shrinkage. Biometrika. 1994;81:425–455. [Google Scholar]
- 25.Ghazal M, Amer A. Homogeneity localization using particle filters with application to noise estimation. IEEE Trans. Image Process. 2011;20(7):1788–1796. doi: 10.1109/TIP.2010.2097272. [DOI] [PubMed] [Google Scholar]
- 26.Liu S. Adaptive scalar and vector median filtering of noisy colour images based on noise estimation. IET Image Process. 2011;6(5):541–553. [Google Scholar]
- 27.Fang L, Li S, Joseph A. Sparsity based denoising of spectral domain optical coherence tomography images. Biomed. Opt. Express. 2012;3(5):927–942. doi: 10.1364/BOE.3.000927. [DOI] [PMC free article] [PubMed] [Google Scholar]
- 28.Schmitt JM, Xiang SH, Yung KM. Speckle in optical coherence tomography: an overview. J. Biomed. Opt. 1999;5(4):95–105. doi: 10.1117/1.429925. [DOI] [PubMed] [Google Scholar]


