

Abstract
Aims
The primary aim of this research was to predict the allopurinol maintenance doses required to achieve the target plasma urate of ≤0.36 mmol l−1.
Methods
A population analysis was conducted in nonmem using oxypurinol and urate plasma concentrations from 133 gout patients. Maintenance dose predictions to achieve the recommended plasma urate target were generated.
Results
The urate response was best described by a direct effects model. Renal function, diuretic use and body size were found to be significant covariates. Dose requirements increased approximately 2‐fold over a 3‐fold range of total body weight and were 1.25–2 fold higher in those taking diuretics. Renal function had only a modest impact on dose requirements.
Conclusions
Contrary to current guidelines, the model predicted that allopurinol dose requirements were determined primarily by differences in body size and diuretic use. A revised guide to the likely allopurinol doses to achieve the target plasma urate concentration is proposed.
Keywords: allopurinol, gout, nonmem, pharmacokinetic–pharmacodynamics
What is Already Known About this Subject
Allopurinol is used to manage gout and works by reducing plasma urate concentrations.
Response to allopurinol is frequently suboptimal and many patients will not achieve the recommended plasma urate.
There is currently a poor understanding of the factors that determine allopurinol dose requirements and little agreement about optimal dosing.
What this Study Adds
Contrary to current guidelines, we found that allopurinol dose requirements were determined primarily by differences in body size and diuretic use while renal function had only a modest impact on dose–response.
A revised guide to the allopurinol doses likely to achieve the target plasma urate concentration is proposed.
Introduction
Gout is an acute inflammatory arthritis caused by the deposition of monosodium urate crystals in joints. Long term pharmacological management involves the use of urate lowering drugs. The goal of therapy is to reduce plasma urate concentrations sufficiently to prevent monosodium urate crystal formation and to allow existing crystals to dissipate. The recommended target for plasma urate, according to most published guidelines, is a plasma concentration of ≤0.36 mmol l−1 1, 2, although a lower target may be required in patients with severe disease.
Urate is the ultimate breakdown product of purine nucleotide degradation in humans. Monovalent urate is poorly soluble in extracellular fluids and at concentrations >0.42 mmol l−1, it can become supersaturated 3, 4. This predisposes to urate crystal formation and makes hyperuricaemia a major risk factor for gout. Urate excretion is primarily renal with about 30% via the gut 5, 6. The under‐excretion of urate, largely due to reduced renal clearance, is believed to be the most important cause of hyperuricaemia 7.
Allopurinol (4‐hydroxy‐ [3,4d] pyrazolopyrimidine) is the current mainstay of urate lowering therapy. It is rapidly and extensively metabolized to an active metabolite, oxypurinol. Oxypurinol is almost entirely eliminated by the kidneys and has an elimination half‐life of 18–30 h with normal renal function 8. Its primary action is to reduce the production of urate by competitively inhibiting xanthine oxidase and xanthine dehydrogenase, the enzymes responsible for the conversion of xanthine to urate.
Despite several decades of clinical use, the optimal dosing strategy for allopurinol remains controversial. Published dosing guidelines for allopurinol show little agreement, particularly with regards to dosing in renal impairment (Table 1) 9, 10, 11, 12, 13. Some guidelines are driven by disease severity, i.e. the presence or absence of tophi. Use of ‘standard’ doses, such as 300 mg daily, result in suboptimal urate reductions in many patients 14, 15. Equally, the practice of reducing the allopurinol dose in the setting of impaired kidney function has been associated with treatment failure in >60% of patients 16, 17, 18, 19. More recently, an individualized dosing strategy where doses are cautiously escalated until the target urate concentration is achieved was found to increase the likelihood of treatment success substantially in a small pilot study 20. The allopurinol maintenance doses required to achieve the target urate have been found to be highly variable between patients and difficult to predict at the initiation of therapy 19.
Table 1.
A selection of published dosing guidelines for allopurinol
| FDA drug label 9 | Hande et al. 13 | BSR 10 | EULAR 11 | New Zealand drug label 12 | |||||
|---|---|---|---|---|---|---|---|---|---|
| Target uric acid | < 0.36 mmol l−1 (6 mg dl−1) | – | <0.30 mmol l−1 | <0.36 mmol l−1 | < 0.36 mmol l−1 (6 mg dl−1) | ||||
| Starting dose | 100 mg | – | 50–100 mg | 100 mg | 100 mg (or lower) | ||||
| Upward titration | Weekly by 100 mg | – | 50–100 mg every few weeks | 100 mg every 2–4 weeks | 50–100 mg weekly | ||||
| Maintenance dose (mg day−1) | 200–300 mg (mild) | – | – | – | 100–200 mg (mild) | ||||
| 700–900 mg (severe) | |||||||||
| 400–600 mg (tophi) | |||||||||
| Renal dosing | CLcr (ml min−1) | Maximum dose (mg day−1) | CLcr (ml min−1) | Maximum dose (mg day−1) | CLcr (ml min−1) | Maximum dose (mg day−1) | – | CLcr (ml min−1) | Maximum dose (mg day−1) |
| 10–20 | 200 | 140 | 400 | >80 | 200–300 | 10–20 | 100–200 | ||
| 3–10 | 100 | 120 | 350 | 60–80 | 100–200 | <10 | 100 | ||
| <3 | Extend | 100 | 300 | 30–60 | 50–100 | ||||
| interval | 80 | 250 | 15–30 | 50–100 every 2 days | |||||
| 60 | 200 | dialysis | 50–100 weekly | ||||||
| 40 | 150 | ||||||||
| 20 | 100 | ||||||||
| 10 | 100 every 2 days | ||||||||
| 0 | 100 every 3 days | ||||||||
| Other | Divide doses >300 mg | Divide dose >300 mg daily | |||||||
CLcr, creatinine clearance; FDA, Food and Drug Administration; Max, maximum. BSR, British Society for Rheumatology; EULAR, European League Against Rheumatism.
There is currently a poor understanding of the factors that determine allopurinol maintenance dose requirements. Previous population pharmacokinetic analyses by our group 21 and others 22 have explored the relationship between allopurinol dose and oxypurinol exposure. It was found that oxypurinol pharmacokinetics were predicted by renal function, body size and diuretic use 21. To date, there has been little research designed to gain a better understanding of the factors which predict allopurinol pharmacodynamics, i.e. urate response. This is critical for optimizing the dose of allopurinol for gout patients.
The aims of this study were (1) to develop a population pharmacokinetic–pharmacodynamics (PKPD) model to describe the relationship between allopurinol dose, oxypurinol exposure and plasma urate, (2) to determine the factors that predict allopurinol response and (3) to predict the maintenance doses required to achieve the recommended plasma urate target of ≤0.36 mmol l−1 (6 mg dl−1).
Methods
Data
Data from three published gout studies 19, 23, 24 and two yet to be published studies conducted in Christchurch, New Zealand were available for analysis. The studies included data from patients who were initiating allopurinol (n = 29) and those who were already taking the drug at a stable dose for at least 1 month prior to study enrolment (n = 104). In addition, the baseline (pre‐treatment) urate plasma concentration was available for nine patients already taking allopurinol. About 20% of the cohort were of Maori or Pacific Island decent consistent with the high rates of severe gout in these populations. The studies were approved by the New Zealand Health and Disabilities Ethics Committee and the University of Otago Ethics Committee. All participants gave written, informed consent. All studies were registered with the Australian New Zealand Clinical Trials Registry (ANZCTR). A brief summary of the study designs is presented in Supplementary Table S1.
Oxypurinol and urate assays
Details of the h.p.l.c. assay used to measure oxypurinol plasma concentrations have been published elsewhere 19. The intra‐ and inter‐day coefficient of variation was reported as <10.4% and the lower limit of quantification (LLOQ) was 0.7 μmol l−1 19.
Plasma urate was measured by Canterbury Health Laboratories, Christchurch, New Zealand using a modified Trinder method. The with‐in run coefficient of variation was reported to be 0.4–0.5% and the between‐run coefficient of variation was 0.2–0.4% 25. The assay was reported to be linear between 0.1 and 1.8 mmol l−1. The limit of detection was 0.0035 mmol l−1 and the limit of quantitation was 0.013 mmol l−1 25.
No oxypurinol or urate plasma concentrations were reported to be below the LLOQ in this study.
Genotyping
DNA extraction and genotyping by TaqMan® assays (Applied Biosystems, Foster City) of SNPs rs11942223 (SLC2A9), rs2231142 (ABCG2), rs1183201 (NPT1/SLC17A1) and rs3825018 (URAT1) has been described elsewhere 26, 27, 28, 29. Details of the genotypic data available for analysis are presented in Supplementary Table S2.
Model development
The population analysis was conducted in nonmem (v7.2) using the first order conditional estimation method with interaction. An AMD‐CPU Opteron processor and a GNU Fortran 95 compiler (GCC 4.6.0) were employed for the analysis. The convergence criterion was set to three significant digits.
PK models
One and two compartment structural models with first or zero order elimination were considered for the disposition of oxypurinol. A parent–metabolite model for both allopurinol and oxypurinol was not considered because the allopurinol (parent) model was found to be unstable 21. Allopurinol has a short half‐life and is only detectable in the plasma for a short time after dosing. This means that most samples will be below the limit of quantitation and requires that a likelihood‐based method (or similar) be used to analyze the data. In addition, allopurinol (parent) is not known to contribute to the urate lowering response to any great degree compared with oxypurinol.
Several input models were explored including first and zero order absorption with and without a time lag, as well as combined sequential and parallel first and zero order input models. Covariance between the clearance (CL) and volume (V) parameters was considered. Models to describe residual unexplained error included additive, proportional and combined (i.e. both additive and proportional).
The parameter variability between individuals was assumed to follow a log‐normal distribution, taking the generic form;
where θip is the estimate of the pth parameter θ for the ith individual, is the population mean value of the pth parameter, and ηip is the deviation from the mode of the pth parameter for the ith individual. η was assumed to be normally distributed with a mean of zero and a variance of ω2.
PKPD models
Graphical analysis of urate plasma concentrations after the first dose of allopurinol in the low dose study (Study 4, see Supplementary Table S1) showed a time delay between urate response and peak oxypurinol plasma concentrations in some patients, although this was not consistently observed. Therefore, delayed effects (turnover) models, as well immediate effects models were considered. The PKPD data were analyzed using both simultaneously and sequential approaches including population PK parameters and data (PPPD) and individual PK parameters (IPP) 30, 31. Oxypurinol plasma concentrations were introduced into the PD models using linear, Emax and sigmoid Emax models.
Covariate models
Covariates tested in the model were based on biological plausibility and on prior analyses 21, 22, 23, 32, 33. Covariates considered included measures of body size, renal function, renal transporter genotype, gender, ethnicity and drug interactions (see details below).
Measures of body size included total body weight (TBW), fat‐free mass (FFM), and normal fat mass (NFM). FFM was calculated using the formula developed by Janmahasatian et al. 34. NFM was determined using the method developed by Duffull 35 and Anderson & Holford 36. Clearance was allometrically scaled to an exponent of 0.75 and volume with an exponent of 1 37.
Renal function was calculated using the Cockroft–Gault formula 38 and expressed as creatinine clearance (CLcr) standardized to 70 kg 39. Renal function (RF) was then normalized to a standard creatinine clearance ( ) of 6 l h−1/70 kg (100 ml min−1/70 kg);
Covariate models for renal function tested included a linear model, with renal and non‐renal clearance components, and a power model.
Concomitant drugs known from previous work to influence the PK of oxypurinol (e.g. probenecid and frusemide 21, 22, 23, 32) were tested in the PK model. In addition, drugs associated with an increased or decreased risk of hyperuricaemia were tested in the PKPD model including thiazide or loop diuretics, uricosurics, angiotensin converting enzyme inhibitors, angiotensin receptor blockers, β‐adrenoceptor blockers, statins and calcium–channel blockers 8, 40, 41, 42.
Genetic variants of four apical and basolateral urate transporters expressed in the proximal tubule were investigated as covariates in the model including the solute carrier proteins SLC22A12 (URAT1), SLC2A9 (GLUT9), SLC17A1 (NPT1) and the ATP‐binding cassette transporter ABCG2 (BRCP). The single nucleotide polymorphisms (SNPs) investigated in this study have been associated with hyperuricaemia 26, 27, 28, 43, 44, 45. For the purposes of this analysis, all individuals with at least one urate‐raising allele were considered as a single group. This was due to the low numbers of homozygotes with the minor allele for some transporters. Individuals with missing genotype information were assigned to the non‐risk (null) group. All genotype distributions conformed to the expectations of Hardy–Weinberg equilibrium. The genotypic data are summarized in Supplementary Table S2.
The influence of discrete covariates, including gender, ethnicity and genotype, were entered into the model as a fractional effect on the parameter of interest. Individuals with missing covariate information were assumed to have the standard value of the covariate.
Model selection
Model selection was guided by (1) a decrease in the objective function value (OFV) of 3.84 units (χ2, P < 0.05) with one degree of freedom for nested models, (2) graphical goodness of fit plots, (3) visual predictive checks (VPCs), (4) parameter precision and (5) the biological plausibility of parameter estimates and covariate relationships.
Model building
Initial model building involved the development of a base model, including structural components and statistical models for random residual variability and between subject variability. Each candidate covariate was then added to the base model and fitted to the data. A likelihood ratio test was performed and the covariate that produced the largest statistically significant objective function change was retained. Other significant covariates were then sequentially added to the model in descending order of objective function change and each successive model fitted to the data. The full covariate model was subjected to a backward elimination procedure where each covariate was sequentially removed from the model. Only those covariates that increased the objective function value by >6.6 units (χ2, P < 0.01) with one degree of freedom were retained. This provided the final model.
Model evaluation
The final model was evaluated using:
Visual predictive checks (VPCs). One hundred data sets were simulated under the final model and the 5th, 50th and 95th percentiles were plotted against the same percentiles from the original dataset. All VPC plots were created using R (v.3.1.1). Bins were chosen to provide an even distribution of time points in each bin.
A non‐parametric bootstrap. The median parameter values and 95% confidence intervals (CI) were determined from 1000 non‐parametric bootstrap runs.
Comparisons of the model predictions with external data derived from the published literature 46, 47, 48, 49. One thousand individuals were simulated stochastically using an allopurinol dose of 100 mg, 200 mg, 300 mg, 400 mg, and 600 mg daily for 3 months. For the purposes of the simulations, renal function was set to the median value in our cohort of 4 l h−1.
Allopurinol maintenance dose predictions
The final PKPD model was implemented in MATLAB (v. 2014a). A series of stochastic simulations were conducted to predict the allopurinol dose required to achieve the recommended plasma urate target under different values of covariates. All combinations of the following variables were tested:
Maintenance doses of 50–1000 mg daily, rounded to the nearest 50 mg increment to reflect the dosage forms available in clinical practice.
CLcr values from 15 to 120 ml min−1 in 1 ml min−1 increments.
Total body weights of 50, 70, 90, 110, 130 and 150 kg.
With and without diuretics.
For each combination of covariate values tested, 1000 simulates were created and the percentage of steady‐state plasma urate concentrations ≤0.36 mmol l−1 was determined. Treatment success was defined as the dosage that achieved the target urate in >75% of simulates. For the purpose of creating a dosing table, the CLcr values were stratified into ranges post‐analysis (see Table 44). The percentage of simulates that achieved the target urate was determined for each CLcr value in the range, and the average of these values determined. The dosage that achieved the average target urate in >75% of simulates across the CLcr range was selected.
Table 4.
Allopurinol daily maintenance dose predictions to achieve plasma urate concentrations of <0.36 mmol l−1 (with >75% probability)
| Body weight | ||||||
|---|---|---|---|---|---|---|
| CLcr (ml min−1) | 50 kg | 70 kg | 90 kg | 110 kg | 130 kg | 150 kg |
| No diuretics | ||||||
| >15–30 | 250 mg | 350 mg | 400 mg | 450 mg | 500 mg | 550 mg |
| >30–50 | 250 mg | 350 mg | 400 mg | 450 mg | 500 mg | 550 mg |
| >50–70 | 300 mg | 350 mg | 400 mg | 450 mg | 500 mg | 550 mg |
| >70–90 | 300 mg | 350 mg | 400 mg | 500 mg | 550 mg | 600 mg |
| >90 | 300 mg | 400 mg | 450 mg | 500 mg | 600 mg | 600 mg |
| Taking diuretics | ||||||
| >15–30 | 700 mg | 800 mg | 900 mg | 950 mg | 1000 mg | 1000 mg |
| >30–50 | 450 mg | 550 mg | 600 mg | 700 mg | 800 mg | 850 mg |
| >50–70 | 400 mg | 500 mg | 550 mg | 650 mg | 750 mg | 800 mg |
| >70–90 | 400 mg | 500 mg | 550 mg | 650 mg | 750 mg | 800 mg |
| >90 | 400 mg | 500 mg | 550 mg | 650 mg | 750 mg | 800 mg |
CLcr, creatinine clearance expressed as ml min−1 (100 ml min−1 = 6 l h−1); Diuretics include thiazides and loop diuretics.
Results
The data included 1319 oxypurinol and 1349 urate plasma concentrations from 150 gout patients. A large number of samples from study 1 (see Supplementary Table S1) were missing the dose or sample timing and therefore could not be included in the analysis. The final dataset included 1105 oxypurinol and 1162 urate plasma concentrations from 133 gout patients (Table 2).
Table 2.
Demographic and clinical details of the study cohort
| Study 1 19 (n = 74) | Study 2 23 (n = 10*) | Study 3 24 (n = 30) | Study 4 (n = 19) | Study 5 (n = 8) | Total (n = 133) | |
|---|---|---|---|---|---|---|
| M/F | 66/8 | 9/1* | 28/2 | 15/4 | 6/2 | 117/17 |
| Age (years) | 61 [27–83] | 52 [37–69] | 56 [27–82] | 63 [34–82] | 62 [47–68] | 60 [27–83] |
| Weight (kg) | 95 [51–171] | 92 [51–126] | 93 [63–162] | 88 [53–134] | 102 [73–156] | 94 [51–171] |
| European ancestry | 60 | 8* | 20 | 17 | 5 | 104 |
| Maori/PI | 14 | 2* | 8 | 2 | 3 | 27 |
| East Asian ancestry ‡ | 0 | 0 | 1 | 0 | 0 | 1 |
| South Asian ancestry ‡ | 0 | 0 | 1 | 0 | 0 | 1 |
| CLcr (ml min−1) | 68 [12–123] | 80 [63–105] | 67 [53–125] | 60 [33–102] | 52 [23–78] | 68 [12–125] |
| Diuretics (n [%]) | 25 [34%] | 0* | 9 [30%] | 4 [21%] | 6 [75%] | 44 [33%] |
| β‐adrenoceptor blockers (n [%]) | 35 [47%] | 1* [10%] | 8 [27%] | 8 [42%] | 3 [38%] | 54 [41%] |
| ACEI (n [%]) | 28 [38%] | 3* [30 5] | 14 [47%] | 6 [32%] | 3 [38%] | 52 [39%] |
| ARBs (n [%]) | 9 [12%] | 2* [20%] | 2 [7%] | 0 | 2 [25%] | 13 [10%] |
| CCBs (n [%]) | 17 [23%] | 3* [30%] | 4 [14%] | 2 [11%] | 3 [38%] | 26 [20%] |
| Statins (n [%]) | 34 [46%] | 5* [50%] | 10 [33%] | 6 [20%] | 4 [50%] | 54 [41%] |
| NSAIDs (n [%]) | 12 [16%] | 3* [30%] | 5 [17%] | – | – | 17 [13%] |
| Uricosuric (n [%]) | 1 [1.4%] | – | 3 [10%] | – | – | 4 [3%] |
| Daily dose (mg) | 300 [50–600] | 350 [150–500] | 200 [50–500] | 100 [50–300] | 250 [50–700] | 300 [50–700] |
| Oxypurinol (μmol l−1) | 114 [15–427] | 83 [26–138] | 57 [0–198] | 11 [0–50] | 208 [77–401] | 72 [26–427] |
| Urate (mmol l−1) | 0.32 [0.18–0.68] | 0.31 [0.20–0.44] | 0.41 [0.27–0.63] | 0.49 [0.28–0.69] | 0.42 [0.30–0.89] | 0.38 [0.18–0.89] |
All data are expressed as median [range] unless otherwise stated. ACEI, angiotensin converting enzyme inhibitors; ARBs, angiotensin II receptor blockers; CCBs, calcium channel blockers; CLcr, creatinine clearance; M/F, male/female; NSAID, regular use of a non‐steroidal anti‐inflammatory drug; PI, Pacific Islander; statin, HMG‐CoA reductase inhibitors.
8 of the 10 patients also participated in the dose‐escalation study (individuals were included once in the total counts);
the subject of Eastern Asian ancestry was Korean, the subject of Southern Asian ancestry was Indian.
The parameter estimates for the base and final PKPD models, as well as the bootstrap results, are presented in Table 33. Note that model building was conducted using the IPP model framework. The base and final models were re‐estimated under PPPD and simultaneous PKPD models. The resulting PKPD parameter estimates were within about 10% of the PK and IPP models (see Supplementary Table S3). The PKPD model parameter estimates are reported here and were used for the model predictions outlined below.
Table 3.
Parameter estimates for the base and final PKPD models
| Parameter | Base model (RSE %) | Final model (RSE %) | Bootstraps [95% CI] | |
|---|---|---|---|---|
| θCL (l h−1) | 0.848 (4.5) | 1.32 (3.9)* | 1.31 [1.22, 1.44] | |
| θV (l) | 52.5 (3.9) | 41.6 (3.0)† | 41.5 [39.5, 43.5] | |
| Kα (h−1) | 1.09 fixed | 1.09 fixed | 1.09 fixed | |
| θdiuretic | – | 0.740 (6.4) | 0.748 [0.64, 0.86] | |
| θRFexp | – | 0.587 (11.7) | 0.588 [0.476, 0.742] | |
| Emax | 0.345 (11.0) | 0.409 (12) | 0.414 [0.323, 0.595] | |
| Uo (Baseline urate (mmol l−1) | 0.558 (2.3) | 0.511 (2.3) | 0.508 [0.487, 0.530] | |
| C50 (μmol l−1) | 65.1 (14.0) | 83.9 (17.4) | 87.9 [61.3, 173] | |
| λ (Hill coefficient) | 1.45 (10.8) | 1.30 (11) | 1.26 [1.05, 1.59] | |
|
|
– | −0.119 (21.6) | −0.121 [−0.18, −0.07] | |
|
|
– | 1.14 (1.8) | 1.14 [1.09, 1.19] |
| Between subject variability | |||
|---|---|---|---|
| (CV%) | 49.4 (11.5) | 24.2 (15.5) | 24.0 [19.3, 28.3] |
| F_ ωVoxy | 0.0355 | 0.0355 | fixed |
| (CV%) | 58.9 (fixed) | 58.9 (fixed) | 58.9 (fixed) |
| (CV%) | 32.4 (36.5) | 35.9 (28.8) | 36.2 [18.7, 51.6] |
| (CV%) | 17.1 (26.3) | 14.2 (26.1) | 14.2 [10.9, 18.4] |
| (CV%) | 71.8 (29.5) | 60.7 (22.4) | 59.0 [23.1, 78.2] |
| Covar , | 0.259 | 0.193 | 0.184 [0.023, 0.383] |
| Covar , | 0.036 | 0.025 | 0.027 [0.003, 0.05] |
| Covar , | 0.029 | 0.011 | 0.013 [0, 0.04] |
| Residual error | |||
|---|---|---|---|
| Oxypurinol σprop (CV%) | 20.0 (5.3) | 19.9 | 19.9 [17.7, 22.2] |
| Study 1 | |||
| Urate σadd (mmol l−1) | 0.038 (5.8) | 0.037 (6.2) | 0.038 [0.033, 0.044] |
| Study 2 | |||
| Urate σadd (mmol l−1) | 0.022 (12.2) | 0.022 (12.5) | 0.022 [0.016, 0.027] |
| Study 3 | |||
| Urate σadd (mmol l−1) | 0.037 (7.4) | 0.037 (7.2) | 0.036 [0.031, 0.042] |
| Study 4 | |||
| Urate σadd (mmol l−1) | 0.0211 (6.2) | 0.021 (5.8) | 0.020 [0.019, 0.023] |
| Study 5 | |||
| Urate σadd (mmol l−1) | 0.054 (21.2) | 0.054 (16.1) | 0.052 [0.029, 0.074] |
| η ‐ shrinkage (CLoxy) | 1.7% | 6.2% | |
| η ‐ shrinkage (Emax) | 25.3% | 30.1% | |
| η ‐ shrinkage (Uo) | 7.8% | 12.5% | |
| η ‐ shrinkage (C50) | 32.9% | 37.8% | |
| ε ‐ shrinkage oxy (σadd) | 7.5% | 6.9% | |
| ∈ ‐ shrinkage urate (σadd) | 8.4% | 8.2% |
clearance expressed per 70 kg FFM/CLcr 6 lh−1 .
volume expressed per 70 kg body weight.
θCL, oxypurinol clearance;θV, oxypurinol volume; Kα, elimination rate constant;θdiuretic, fractional effect of diuretics; θRFexp, renal function exponent for oxypurinol clearance; Emax, maximum drug effect; C50, drug concentration at ½ maximum effect; θE0_RFexp, renal function exponent for urate baseline; θE0_diuretic, fractional effect of diuretics on baseline urate; ω, between subject variability; η, the difference between the parameter predictions and the typical values for the population; η‐shrinkage, ETA shrinkage; ε‐shrinkage, epsilon shrinkage; CI, confidence interval; RSE, relative standard error; CV%, coefficient of variation; covar, covariance terms; θprop, proportional residual error; σadd, additive residual error; Oxypurinol σadd fixed at 0.001; Urate σprop fixed at 0.001. 5% (50) of the bootstrap runs did not converge successfully. The parameter estimates were retained.
A one compartment PK model with first order absorption and elimination and a combined additive and proportional residual variance model provided the best fit to the oxypurinol data. The between subject variance for V was not identifiable under the current data. Therefore only a single random effects parameter was estimated for both CL and V and the variance of V estimated using a fractional effect parameter 50. The estimation of inter‐occasion variability did not improve the PK model fit and was not investigated further.
The noteworthy covariate model building steps for the PK model are presented in Supplementary Table S4. The clearance of oxypurinol was found to be predicted by renal function, FFM and diuretic use. Total body weight as a covariate on oxypurinol clearance did not provide a better fit to the data. NFM as a covariate on oxypurinol clearance provided a similar fit to FFM but the simpler model (FFM) was retained. The between‐subject variance for oxypurinol clearance decreased by about 75% in the covariate model compared with the base model. Total body weight was a significant covariate on oxypurinol volume. Overall, these covariates were considered clinically important, with the predicted oxypurinol clearance ranging from 0.23 l h−1 to 2.3 l h−1 under the extremes of the observed renal function, weight and with or without diuretics in the study population. There was no identifiable influence of any individual genotype on oxypurinol PK.
A simple direct effects sigmoid Emax model with baseline (E0) urate concentrations provided an adequate description of the plasma urate data. The base model included covariance between Emax, (E0), and C 50 and a combined additive and proportional residual variance model. A turnover model for urate did not provide a better description of the data and was unstable.
The noteworthy covariate model building steps for the PD model are presented in Supplementary Table S5. The final covariate model included renal function and diuretic use as covariates on baseline (E0) urate concentrations. This finding is biologically reasonable as urate is renally cleared and diuretics have been found to increase urate concentrations 51. Individuals who were homozygotes for the urate‐raising T allele of ABCG2 SNP rs2231142 were found to have a C 50 value that was 40% higher than homozygotes for the G allele. The T allele has been associated with reduced response to allopurinol therapy 52 and with the risk of gout 28. This gene effect was not retained in the final model because it did not meet the statistical criterion for inclusion during the backward deletion process. There was no identifiable influence of ethnicity on the PD model.
The final models oxypurinol clearance, oxypurinol volume and urate concentrations are given by;
where is apparent oral clearance of oxypurinol, CLcr is creatinine clearance, FFM is fat‐free mass, θdiuretic is the fractional effect of diuretic use taking a value between 0 and 1, is the apparent volume for oxypurinol, TBW is total body weight, Eurate is the urate plasma concentration, E0 is baseline urate, is the fractional effect of diuretic taking a value between 0 and 1, Cpoxy is the plasma concentration of oxypurinol, C 50 is the oxypurinol plasma concentration at half maximal effect and λ is the empirical Hill coefficient.
Model evaluation
The median parameter values with the 95% CI derived from 1000 non‐parametric bootstrap results (mean, 95% CI) for the final PKPD model are presented in Table 3. The bootstrap estimates were similar to the final model, suggesting that the PKPD model is stable. Diagnostic plots for the PKPD model are presented in Figure 1. The conditional‐weighted residual plots show no apparent bias for the model predictions (Figure 1A, B). A trend towards over‐prediction (population predictions) at higher oxypurinol and urate concentrations was noted in Figure 1C, E. The majority of the over‐predicted oxypurinol concentrations (>200 μmol l−1) came from three individuals, and since subsequent observations from these subjects were well‐predicted by the model, over‐prediction may be attributed to non‐compliance. The over‐predicted urate concentrations were from two individuals with observations measured in the first 3 days of therapy. Note that the over‐predicted urate and oxypurinol concentration occurred in different individuals. Overall, no other model misspecification was evident from the goodness of fit plots.
Figure 1.
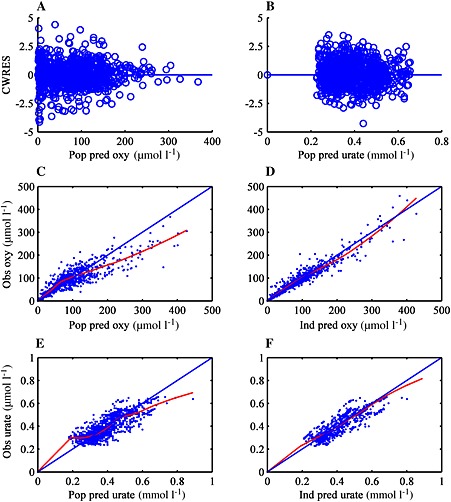
Goodness of fit plots for the final PKPD model. A and B: CWRES (conditional weighted residuals) against the population predictions for oxypurinol (A) and urate (B). C and D show observed oxypurinol plasma concentrations (obs oxy) against the population predictions (pop pred) and individual prediction (Ind pred) for oxypurinol concentrations. The trend (loess) of the data is shown. E and F show observed urate plasma concentrations (obs urate) against the population predictions (pop pred) and individual prediction (Ind pred) for urate concentrations. The trend (loess) of the data is denoted by a solid red line
VPCs for the final oxypurinol and urate models are presented in Figure 2. Median and 5th and 95th percentiles of the model predicted plasma concentrations followed the percentiles of the observed data well, suggesting an acceptable model fit for both oxypurinol and urate plasma concentrations. VPCs showing the final PKPD covariate model predictions over the range of observed covariates (those found to be significant and which were included in the model) are presented in Supplementary Figures S1 and S2.
Figure 2.
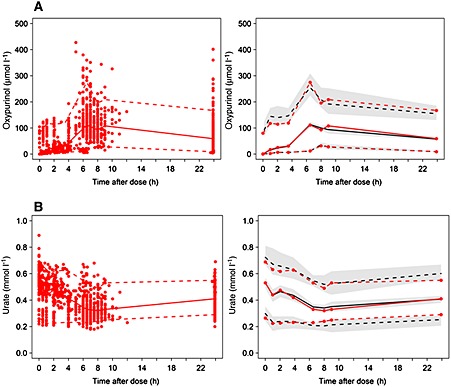
Visual predictive checks (VPCs) for the final PKPD model. A) VPC showing the observed oxypurinol data (red dots), the 5th, and 95th percentiles of the observed oxypurinol data (red dashed lines) and the same percentiles for the model predicted oxypurinol plasma concentrations (dark dashed line) with 95% CI around the percentiles (shaded area). The 50th percentile of the observed oxypurinol data (red solid line) and the same percentiles for the model predicted oxypurinol plasma concentrations (dark solid line) are also depicted. Note that the simulations included both steady‐state and non‐steady‐state data. B) VPC showing the observed urate data (red dots), 5th, and 95th percentiles of the observed urate data (dashed red lines) and the same percentiles for the model predicted urate plasma concentrations (dark dashed line) with 95% CI around the percentiles (shaded area). The 50th percentile of the observed urate data (red solid line) and the same percentiles for the model predicted urate plasma concentrations (dark solid line) are also depicted.
There was close agreement between the model‐predicted percent reduction in steady‐state urate and steady‐state data derived from published studies in gout patients (Figure 3). The model predictions appeared to capture the median percent reduction of urate as well as the distribution of different urate values for each dosage.
Figure 3.
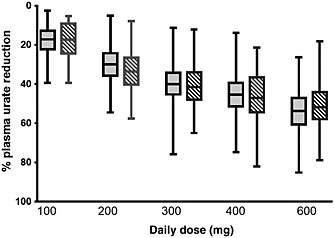
A comparison of the percent reduction in plasma urate from baseline under different allopurinol daily doses using PKPD model predictions (dark shaded, left) and external data extracted from the published literature 46, 47, 48, 49 (hatched, right). Boxes represent the quartiles (centre line is the median) of the data while the whiskers extend to include all data
Allopurinol maintenance dose predictions
Allopurinol maintenance dose predictions to achieve plasma urate concentrations of ≤0.36 mmol l−1 are presented in Table 4. Predictions of maintenance dose ranged from 250 to 1000 mg daily and were highly dependent on total body weight and diuretic use. Interestingly, renal function had a modest impact on dosing within each weight category. Of note, reduced renal function was found to increase the maintenance dose requirements in those taking diuretics, contrary to current recommendations. This will be discussed further below.
Discussion
In this study, a population PKPD model for allopurinol was developed. To our knowledge, this is the first fully integrated population PKPD model for allopurinol, and the first to use model predictions to propose maintenance doses. Allopurinol dose requirements were found to increase approximately 2‐fold over a 3‐fold range of weights (50–150 kg) and were 1.25–2 times higher in those taking diuretics. Renal function had a relatively modest impact on dosing, although this was more pronounced in those taking diuretics.
Although it was proposed in early studies that the dose of allopurinol may need to be adjusted in patients with renal impairment it was not until 1984 that a published dosing guideline became widely available 13. Hande et al. reviewed 78 cases of allopurinol hypersensitivity syndrome (AHS) and noted that most were in patients with renal impairment. AHS is a rare (< 0.1%) but life‐threatening systemic syndrome. Hande et al. postulated that AHS may be caused by the accumulation of excessive oxypurinol in patients with renal impairment. The authors proposed that the dose of allopurinol should be adjusted in proportion to the calculated CLcr 13.
The Hande dosing guideline has been widely adopted in clinical practice. This is not surprising given the prevalence of renal impairment in the gout population and the high mortality rate (~25%) for AHS 53, 54. However, the use of the Hande guideline has been found to result in poor treatment response in many patients 16, 17, 18, 19. In addition, the evidence to support an association between allopurinol and AHS is controversial. While patients with renal failure have been found to be at risk of AHS 13, 54, 55, 56, a clear relationship between oxypurinol exposure and AHS has not be found 16, 17, 57. In one large case–control study 57, a lower allopurinol dose was found to be associated with AHS risk. It has also been proposed that AHS may be the result of an immune mediated reaction 53, rather than oxypurinol toxicity per se. This is supported by evidence showing an association between the HLA‐B*5801 gene and AHS 57, 58, 59.
Predictions from our model (see Supplemental Table 6) found that the probability of achieving the target plasma urate concentration under the Hande guideline declined with reduced renal function. For example, the Hande guideline recommends a dose of 300 mg daily for a patient with a CLcr of 100 ml min−1, 150 mg if CLcr is 40 ml min−1 and 100 mg daily if CLcr is 20 ml min−1 13. Our model predicted that the probability of achieving the target urate under these doses would be 64%, 29% and 12%, respectively.
There are few published models describing the allopurinol dose–response relationship. Graham et al. 60 fitted an inhibitory sigmoidal Emax model to oxypurinol and urate data collected from healthy volunteers. Our analysis was conducted in gout patients, most of whom had hyperuricaemia at baseline, as well as a greater prevalence of comorbidities. Consequently, the baseline urate estimate and Emax values from our work were higher than those found by Graham et al. (0.51 vs. 0.35 mmol l−1 and 0.41 vs. 0.29 mmol l−1, respectively) 60. The C 50 estimated in our analysis was more than double the value reported by Graham et al. (83.9 μmol l−1 vs. 37 μmol l−1, respectively). This suggests that gout patients require a greater exposure to oxypurinol to achieve a urate response than young healthy volunteers.
A recent analysis by Graham et al. 61 used a dose‐driven Emax model to describe the dose–response of allopurinol. Dose predictions from the model were found to be dependent largely on baseline urate. This aligns with our results, where diuretic use and renal function were found to impact baseline urate concentrations and dose predictions. The reported ID 50 value (the dose that produced half maximum response) of 226 mg daily suggests that a typical gout patient would be expected to have an average steady‐state oxypurinol plasma concentration at about the C 50 value when taking this dose. Simulations from our PK model (not shown) found that a typical patient in our cohort would have an average oxypurinol plasma concentration of 70 μmol l−1 using a dose of 226 mg daily. This is close to the C 50 values found in our analysis of 83.9 μmol l−1. Also in agreement with Graham et al. 61 we found that renal function did not have a large impact on dosing requirements.
The finding that renal function was not a major determinant of allopurinol dosing is counter‐intuitive for a drug that is eliminated almost entirely by the kidneys. A plausible explanation is that there exists a trade‐off between greater oxypurinol plasma concentrations in those with renal impairment, on the one hand, and the retention of urate, on the other. Our model predicts that as renal function declines, both oxypurinol and urate clearance will decrease and consequently exposure to both will be increased. This assumes that the non‐renal clearance of urate remains relatively unchanged in those with renal impairment. Simplistically, it is conceivable that the increased inhibition of urate production by oxypurinol will be balanced by a reduced renal clearance of urate. This could explain why renal dosing protocols, where doses are reduced based on CLcr, (e.g. Hande et al. 13), produce inadequate allopurinol response in many patients. The suggestion that gout patients with renal impairment require higher oxypurinol plasma concentrations to achieve treatment success than those with normal renal function has been noted elsewhere 19.
Our model is limited to predictions of allopurinol maintenance doses rather than those used at the start of therapy. Current guidelines for initiating allopurinol therapy recommend low doses, usually in the order of 50 mg to 100 mg daily that are then gradually increased. In addition, our model may not capture the time course of urate plasma concentration reduction at the start of therapy. This is predicted to be driven directly by the time course of drug concentrations in a direct effects Emax model, such as the one described here. If there is a delay between peak oxypurinol plasma concentrations and urate response, as we saw with some patients, the time course of urate reduction will be determined by urate clearance, not oxypurinol. It is important to note, however, that this does not limit the clinical utility of our model with regards to maintenance dose predictions.
We have a developed a population PKPD model for allopurinol in patients with gout. The factors found to significantly influence plasma urate concentrations are in line with previous literature. This model provided an acceptable prediction of data arising from other studies. Dose requirements were found to increase approximately 2‐fold over a 3‐fold range of total body weight and were 1.25–2 times higher in those taking diuretics. Renal function had a relatively modest impact on dosing, although this was more pronounced in those taking diuretics. The model predictions provide a useful guide to the likely allopurinol maintenance dose requirements for patients with gout. These predictions will be further evaluated in future research.
Competing Interests
All authors have competed the Unified Competing Interest form at http://www.icmje.org/coi_disclosure.pdf (available on request from the corresponding author) and declare no support from any organization for the submitted work, no financial relationships with any organizations that might have an interest in the submitted work in the previous 3 years and no other relationships or activities that could appear to have influenced the submitted work.
We wish to thank Amanda Phipps‐Green, Department of Biochemistry, University of Otago, Dunedin for her assistance with the genotype data. Jill Drake and Janine Francis, Department of Rheumatology, Immunology and Allergy, Christchurch Hospital provided valuable help with the allopurinol data. We thank Dr Mei Zhang, Canterbury Health Laboratories for her work with the oxypurinol assay. The data analyzed were originally collected as part of research supported by Arthritis New Zealand, the Canterbury Medical Research Foundation, and the Health Research Council of New Zealand.
Contributors
DFBW, SBD and LKS wrote the manuscript, LKS and MLB designed studies 1, 2 and 3, DFBW, SBD and LKS designed study 4, ND and LKS designed study 5 (see Supplemental Table 1), LKS and ND collected the data, TRM collected and analyzed the genotype data, DFBW and SBD conducted the population analysis.
Supporting information
Table S1
A brief outline of study designs and sampling schedules
Table S2
Details of the renal transporter genotypes
Table S3
Parameter estimates from the final PK, PKPD, PPPD and IPP models
Table S4
Noteworthy steps in the model development for the oxypurinol PK model
Table S5
Noteworthy steps in the covariate model development for the oxypurinol PD model
Table S6
The probability of treatment success (plasma urate <0.036 mmol l−1) in >75% of simulates for the doses recommended by the Hande dosing guideline
Figure S1
VPCs showing the observed oxypurinol data (red dots), the 5 th and 95 th percentiles of the observed oxypurinol data (red dashed lines) and the same percentiles for the model predicted oxypurinol plasma concentrations (dark dashed line) with 95% confidence interval around the percentiles (shaded area) against each significant covariate. The 50 th percentile of the observed oxypurinol data (red solid line) and the same percentiles for the model predicted oxypurinol plasma concentrations (dark solid line). a) not taking diuretics, b) taking diuretics, c) over the range of CLcr (note that CLcr is expressed in l h−1. 6 l h−1 is equivalent to 100 ml min−1), d) over the range of fat‐free mass
Figure S2
VPCs showing the observed urate data (red dots), 5 th and 95 th percentiles of the observed urate data (dashed red lines) and the same percentiles for the model predicted urate plasma concentrations (dark dashed line) with 95% confidence interval around the percentiles (shaded area) against significant covariates. The 50 th percentile of the observed urate data (red solid line) and the same percentiles for the model predicted urate plasma concentrations (dark solid line). a) not taking diuretics, b) taking diuretics, c) over the range of CLcr (note that CLcr is expressed in l h−1. 6 l h−1 is equivalent to 100 ml min−1), d) over the range of fat‐free mass
Supporting info item
Supporting info item
Supporting info item
Supporting info item
Supporting info item
Supporting info item
Supporting info item
Wright, D. F. B. , Duffull, S. B. , Merriman, T. R. , Dalbeth, N. , Barclay, M. L. , and Stamp, L. K. (2016) Predicting allopurinol response in patients with gout. Br J Clin Pharmacol, 81: 277–289. doi: 10.1111/bcp.12799.
References
- 1. Perez‐Ruiz F, Calabozo M, Pijoan JI, Herrero‐Beites AM, Ruibal A. Effect of urate‐lowering therapy on the velocity of size reduction of tophi in chronic gout. Arthritis Rheum 2002; 47: 356–60. [DOI] [PubMed] [Google Scholar]
- 2. Shoji A, Yamanaka H, Kamatani N. A retrospective study of the relationship between serum urate level and recurrent attacks of gouty arthritis: evidence for reduction of recurrent gouty arthritis with antihyperuricemic therapy. Arthritis Rheum 2004; 51: 321–5. [DOI] [PubMed] [Google Scholar]
- 3. Bobulescu IA, Moe OW. Renal transport of uric acid: evolving concepts and uncertainties. Adv Chronic Kidney Dis 2012; 19: 358–71. [DOI] [PMC free article] [PubMed] [Google Scholar]
- 4. Fiddis RW, Vlachos N, Calvert PD. Studies of urate crystallisation in relation to gout. Ann Rheum Dis 1983; 42: 12–5. [DOI] [PMC free article] [PubMed] [Google Scholar]
- 5. Sorensen LF. Gout secondary to chronic renal disease: studies on urate metabolism. Ann Rheum Dis 1980; 39: 424–30. [DOI] [PMC free article] [PubMed] [Google Scholar]
- 6. Sorensen LB. Role of the intestinal tract in the elimination of uric acid. Arthritis Rheum 1965; 8: 694–706. [DOI] [PubMed] [Google Scholar]
- 7. Anzai N, Kanai Y, Endou H. New insights into renal transport of urate. Curr Opin Rheumatol 2007; 19: 151–7. [DOI] [PubMed] [Google Scholar]
- 8. Day RO, Graham GG, Hicks M, McLachlan AJ, Stocker SL, Williams KM. Clinical pharmacokinetics and pharmacodynamics of allopurinol and oxypurinol. Clin Pharmacokinet 2007; 46: 623–44. [DOI] [PubMed] [Google Scholar]
- 9. FDA . US National Library of Medicine DailyMed: FDA information: allopurinol tablet (Zyloprim). Available at http://dailymed.nlm.nih.gov/dailymed/drugInfo.cfm?id=13564 (last accessed 17 June 2015).
- 10. Jordan KM, Cameron JS, Snaith M, Zhang W, Doherty M, Seckl J, Hingorani A, Jaques R, Nuki G on behalf of the British Society Rheumatology and British Health Professional in Rheumatology Standards , Guidelines and Audit Working Group . British Society for Rheumatology and British Health Professionals in Rheumatology guideline for the management of gout. Rheumatology 2007; 46: 1372–4. [DOI] [PubMed] [Google Scholar]
- 11. Zhang W, Doherty M, Bardin T, Pascual E, Barskova V, Conaghan P, Gerster J, Jacobs J, Leeb B, Liote F, McCarthy G, Netter P, Nuki G, Perez‐Ruiz F, Pignone A, Pimentao J, Punzi L, Roddy E, Uhlig T, Zimmermann‐Gorska I. EULAR evidence based recommendations for gout. Part II: Management. Report of a task force of the EULAR Standing Committee for International Clinical Studies Including Therapeutics (ESCISIT). Ann Rheum Dis 2006; 65: 1312–24. [DOI] [PMC free article] [PubMed] [Google Scholar]
- 12. Anon . New Zealand Data Sheet: Apo‐allopurinol tablets. Available at http://www.medsafe.govt.nz/profs/Datasheet/a/apoallopurinoltab.pdf (last accessed 18 June 2015.
- 13. Hande KR, Noone RM, Stone WJ. Severe allopurinol toxicity. Description and guidelines for prevention in patients with renal insufficiency. Am J Med 1984; 76: 47–56. [DOI] [PubMed] [Google Scholar]
- 14. Becker MA, Schumacher HR Jr, Wortmann RL, MacDonald PA, Eustace D, Palo WA, Streit J, Joseph‐Ridge N. Febuxostat compared with allopurinol in patients with hyperuricemia and gout. N Engl J Med 2005; 353: 2450–61. [DOI] [PubMed] [Google Scholar]
- 15. Becker MA, Schumacher HR, Espinoza LR, Wells AF, MacDonald P, Lloyd E, Lademacher C. The urate‐lowering efficacy and safety of febuxostat in the treatment of the hyperuricemia of gout: the CONFIRMS trial. Arthrit Res Ther 2010; 12: R63. [DOI] [PMC free article] [PubMed] [Google Scholar]
- 16. Dalbeth N, Kumar S, Stamp L, Gow P. Dose adjustment of allopurinol according to creatinine clearance does not provide adequate control of hyperuricemia in patients with gout. J Rheumatol 2006; 33: 1646–50. [PubMed] [Google Scholar]
- 17. Vazquez‐Mellado J, Morales EM, Pacheco‐Tena C, Burgos‐Vargas R. Relation between adverse events associated with allopurinol and renal function in patients with gout. Ann Rheum Dis 2001; 60: 981–3. [DOI] [PMC free article] [PubMed] [Google Scholar]
- 18. Stamp L, Gow P, Sharples K, Raill B. The optinal use of allopurinol: an audit of allopurinol use in South Auckland . Aust N Z J Med 2000; 30: 567–72. [DOI] [PubMed] [Google Scholar]
- 19. Stamp LK, Barclay ML, O'Donnell JL, Zhang M, Drake J, Frampton C, Chapman PT. Relationship between serum urate and plasma oxypurinol in the management of gout: determination of minimum plasma oxypurinol concentration to achieve a target serum urate level. Clin Pharmacol Ther 2011; 90: 392–8. [DOI] [PubMed] [Google Scholar]
- 20. Stamp LK, O'Donnell JL, Zhang M, James J, Frampton C, Barclay ML, Chapman PT. Using allopurinol above the dose based on creatinine clearance is effective and safe in patients with chronic gout, including those with renal impairment. Arthritis Rheum 2011; 63: 412–21. [DOI] [PubMed] [Google Scholar]
- 21. Wright DFB, Stamp LK, Merriman TR, Barclay ML, Duffull SB, Holford NH. The population pharmacokinetics of allopurinol and oxypurinol in patients with gout. Eur J Clin Pharmacol 2013; 69: 1411–21. [DOI] [PubMed] [Google Scholar]
- 22. Stocker SL, McLachlan AJ, Savic RM, Kirkpatrick CM, Graham GG, Williams KM, Day RO. The pharmacokinetics of oxypurinol in people with gout. Br J Clin Pharmacol 2012; 74: 477–89. [DOI] [PMC free article] [PubMed] [Google Scholar]
- 23. Stamp LK, Barclay M, O'Donnell JL, Zhang M, Drake J, Frampton C, Chapman PT. Furosemide increases plasma oxypurinol without lowering serum urate—a complex drug interaction: implications for clinical practice. Rheumatology 2012; 51: 1670–6. [DOI] [PubMed] [Google Scholar]
- 24. Stamp LK, O'Donnell JL, Frampton C, Drake JM, Zhang M, Chapman PT. Clinically insignificant effect of supplemental vitamin C on serum urate in patients with gout: a pilot randomized controlled trial. Arthritis Rheum 2013; 65: 1636–42. [DOI] [PubMed] [Google Scholar]
- 25. Anon . Uric acid assay package insert for the ARCHITECT system. Abbott Laboratories, Abbott Park, Il, USA , 2012.
- 26. Hollis‐Moffatt JE, Xu X, Dalbeth N, Merriman ME, Topless R, Waddell C, Gow PJ, Harrison AA, Highton J, Jones PBB, Stamp LK, Merriman TR. Role of the urate transporter SLC2A9 gene in susceptibility to gout in New Zealand Maori, Pacific Island, and Caucasian case–control sample sets. Arthritis Rheum 2009; 60: 3485–92. [DOI] [PubMed] [Google Scholar]
- 27. Hollis‐Moffatt JE, Phipps‐Green AJ, Chapman B, Jones GT, van Rij A, Gow PJ, Harrison AA, HIghton J, Jones PB, Montgomery GW, Stamp LK, Dalbeth N, Merriamn TR. The renal urate transporter SLC17A1 locus: confirmation of association with gout. Arthritis Res Ther 2012; 14: R92. [DOI] [PMC free article] [PubMed] [Google Scholar]
- 28. Phipps‐Green AJ, Hollis‐Moffatt JE, Dalbeth N, Merriman ME, Topless R, Gow PJ, Harrison AA, Highton J, Jones PBB, Stamp LK, Merriman TR. A strong role for the ABCG2 gene in susceptibility to gout in New Zealand Pacific Island and Caucasian, but not Maori, case and control sample sets. Hum Mol Genet 2010; 19: 4813–9. [DOI] [PubMed] [Google Scholar]
- 29. Flynn TJ, Phipps‐Green A, Hollis‐Moffatt JE, Merriman ME, Topless R, Montgomery G, Cgapman B, Stamp LK, Dalbeth N, Merriman TR. Association analysis of the SLC22A11 (organic anion transporter 4) and SLC22A12 (urate transporter 1) urate transporter locus with gout in New Zealand case–control sample sets reveals multiple ancestral‐specific effects. Arthritis Res Ther 2013; 15: R220. [DOI] [PMC free article] [PubMed] [Google Scholar]
- 30. Zhang L, Beal SL, Sheiner LB. Simultaneous vs. sequential analysis for population PK/PD data I: best‐case performance. J Pharmacokinet Pharmacodyn 2003; 30: 387–404. [DOI] [PubMed] [Google Scholar]
- 31. Zhang L, Beal SL, Sheinerz LB. Simultaneous vs. sequential analysis for population PK/PD data II: robustness of methods. J Pharmacokinet Pharmacodyn 2003; 30: 405–16. [DOI] [PubMed] [Google Scholar]
- 32. Stocker SL, Graham GG, McLachlan AJ, Williams KM, Day RO. Pharmacokinetic and pharmacodynamic interaction between allopurinol and probenecid in patients with gout. J Rheumatol 2011; 38: 904–10. [DOI] [PubMed] [Google Scholar]
- 33. Stocker SL, Williams KM, McLachlan AJ, Graham GG, Day RO. Pharmacokinetic and pharmacodynamic interaction between allopurinol and probenecid in healthy subjects. Clin Pharmacokinet 2008; 47: 111–8. [DOI] [PubMed] [Google Scholar]
- 34. Janmahasatian S, Duffull SB, Ash S, Ward LC, Byrne NM, Green B. Quantification of lean bodyweight. Clin Pharmacokinet 2005; 44: 1051–65. [DOI] [PubMed] [Google Scholar]
- 35. Duffull SB, Dooley MJ, Green B, Poole SG, Kirkpatrick CMJ. A standard weight descriptor for dose adjustment in the obese patient. Clin Pharmacokinet 2004; 43: 1167–78. [DOI] [PubMed] [Google Scholar]
- 36. Anderson BJ, Holford NHG. Mechanistic basis of using body size and maturation to predict clearance in humans. Drug Metab Pharmacokinet 2009; 24: 25–36. [DOI] [PubMed] [Google Scholar]
- 37. Anderson BJ, Holford NHG. Mechanism‐based concepts of size and maturity in pharmacokinetics. Ann Rev Pharmacol Toxicol 2008; 48: 303–32. [DOI] [PubMed] [Google Scholar]
- 38. Cockcroft DW, Gault MH. Prediction of creatinine clearance from serum creatinine. Nephron 1976; 16: 31–41. [DOI] [PubMed] [Google Scholar]
- 39. Matthews I, Kirkpatrick C, Holford N. Quantitative justification for target concentration intervention – parameter variability and predictive performance using population pharmacokinetic models for aminoglycosides. Br J Clin Pharmacol 2004; 58: 8–19. [DOI] [PMC free article] [PubMed] [Google Scholar]
- 40. Reyes AJ. Cardiovascular drugs and serum uric acid. Cardiovasc Drugs Ther 2003; 17: 397–414. [DOI] [PubMed] [Google Scholar]
- 41. Daskalopoulou SS, Tzovaras V, Mikhailidis DP, Elisaf M. Effect on serum uric acid levels of drugs prescribed for indications other than treating hyperuricaemia. Curr Pharm Des 2005; 11: 4161–75. [DOI] [PubMed] [Google Scholar]
- 42. Choi HK, Soriano LC, Zhang Y, Rodriguez LAG. Antihypertensive drugs and risk of incident gout among patients with hypertension: population based case–control study. BMJ 2012; 344: d8190. [DOI] [PMC free article] [PubMed] [Google Scholar]
- 43. Stark K, Reinhard W, Grassl M, Erdmann J, Schunkert H, Illig T, Hengstenberg C. Common polymorphisms influencing serum uric acid levels contribute to susceptibility to gout, but not to coronary artery disease. PLoS One 2009; 4: e7729. [DOI] [PMC free article] [PubMed] [Google Scholar]
- 44. van der Harst P, Bakker SJL, de Boer RA, Wolffenbuttel BHR, Johnson T, Caulfield MJ, Navis G. Replication of the five novel loci for uric acid concentrations and potential mediating mechanisms. Hum Mol Genet 2010; 19: 387–95. [DOI] [PubMed] [Google Scholar]
- 45. Kolz M, Johnson T, Sanna S, Teumer A, Vitart V, Perola M, Mangino M, Albrecht E, Wallace C, Farrall M, Johansson A, Nyholt DR, Aulchenko Y, Beckmann JS, Bergmann S, Bochud M, Brown M, Campbell H, Connell J, Dominiczak A, Homuth G, Lamina C, McCarthy MI, Meitinger T, Mooser V, Munroe P, Nauck M, Peden J, Prokisch H, Salo P, Salomaa V, Samani NJ, Schlessinger D, Uda M, Volker U, Waeber G, Water worth D, Wang‐Sattler R, Wright AF, Adamski J, Whitfield JB, Gyllensten U, Wilson JF, Rudan I, Pramstaller P, Watkins H, Doering A, Wichmann HE, Spector TD, Peltonen L, Volzke H, Nagaraja R, Vollenweider P, Caulfield Mlllig T, Gieger C. Meta‐analysis of 28,141 individuals identifies common variants within five new loci that influence uric acid concentrations. PLoS Genet 2009; 5: e1000504. [DOI] [PMC free article] [PubMed] [Google Scholar]
- 46. Delbarre F, Amor B, Auscher C, de Gery A. Treatment of gout with allopurinol. A study of 106 cases. Ann Rheum Dis 1966; 25: 627–33. [DOI] [PMC free article] [PubMed] [Google Scholar]
- 47. Yü T‐F, Gutman AB. Effect of allopurinol (4‐Hydroxypyrazolo‐(3,4‐d)pyrimidine) on serum and urinary uric acid in primary and secondary gout. Am J Med 1964; 37: 885–98. [DOI] [PubMed] [Google Scholar]
- 48. Klinenberg JR, Goldfinger SE, Seegmiller JE. The Effectiveness of the Xanthine oxidase inhibitor allopurinol in the treatment of gout. Ann Intern Med 1965; 62: 639. [DOI] [PubMed] [Google Scholar]
- 49. Rundles RW, Metz EN, Silberman HR. Allopurinol in the treatment of gout. Ann Intern Med 1966; 64: 229. [DOI] [PubMed] [Google Scholar]
- 50. Bonate PL. Pharmacokinetic‐Pharmacodynamic Modeling and Simulation. 1st edn New York: Springer, 2006. [Google Scholar]
- 51. Pascual E, Perdiguero M. Gout, diuretics and the kidney. Ann Rheum Dis 2006; 65: 981–2. [DOI] [PMC free article] [PubMed] [Google Scholar]
- 52. Wen CC, Yee SW, Liang X, Hoffmann TJ, Kvale MN, Banda Y, Jorgenson E, Schaefer C, Risch N, Giacomini KM. Genome‐wide association study identifies ABCG2 (BCRP) as an allopurinol transporter and a determinant of drug response. Clin Pharmacol Ther 2015; 97: 518–25. [DOI] [PMC free article] [PubMed] [Google Scholar]
- 53. Emmerson BT, Hazelton RA, Frazer IH. Some adverse reactions to allopurinol may be mediated by lymphocyte reactivity to oxypurinol. Arthritis Rheum 1988; 31: 436–40. [DOI] [PubMed] [Google Scholar]
- 54. Arellano F, Sacristan JA. Allopurinol hypersensitivity syndrome: a review. Ann Pharmacother 1993; 27: 337–43. [DOI] [PubMed] [Google Scholar]
- 55. Lupton GP, Odom RB. The allopurinol hypersensitivity syndrome. J Am Acad Dermatol 1979; 1: 365–74. [DOI] [PubMed] [Google Scholar]
- 56. Young JL Jr, Boswell RB, Nies AS. Severe allopurinol hypersensitivity. Association with thiazides and prior renal compromise. Arch Intern Med 1974; 134: 553–8. [DOI] [PubMed] [Google Scholar]
- 57. Hung S‐I, Chung W‐H, Liou L‐B, Chu C‐C, Lin M, Huang H‐P, Lin YL, Lan JL, Yang LC, Hong HS, Chen MJ, Lai PC, Wu MS, Chu CY, Wang KH, Chen CH, Fann CS, Wu JY, Chen YT. HLA‐B*5801 allele as a genetic marker for severe cutaneous adverse reactions caused by allopurinol. Proc Natl Acad Sci 2005; 102: 4134–9. [DOI] [PMC free article] [PubMed] [Google Scholar]
- 58. Tassaneeyakul W, Jantararoungtong T, Chen P, Lin P‐Y, Tiamkao S, Khunarkornsiri U, Chucherd P, Konyoung P, Vannaprasaht S, Choonhakarm C, Pisuttimarn P, Sangviroon A, Tassaneeyakul W. Strong association between HLA‐B*5801 and allopurinol‐induced Stevens‐Johnson syndrome and toxic epidermal necrolysis in a Thai population. Pharmacogenet Genomics 2009; 19: 704–9. [DOI] [PubMed] [Google Scholar]
- 59. Lonjou C, Borot N, Sekula P, Ledger N, Thomas L, Halevy S, Naldi L, Bouwes‐Bavinck JN, Sidoroff A, de Toma C, Schumacher M, Roujeau JC, Hvonaian A, Mockenhaupt M. A European study of HLA‐B in Stevens‐Johnson syndrome and toxic epidermal necrolysis related to five high‐risk drugs. Pharmacogenet Genomics 2008; 18: 99–107. [DOI] [PubMed] [Google Scholar]
- 60. Graham S, Day RO, Wong H, McLachlan AJ, Bergendal L, Miners JO, Birkett DJ. Pharmacodynamics of oxypurinol after administration of allopurinol to healthy subjects. Br J Clin Pharmacol 1996; 41: 299–304. [DOI] [PMC free article] [PubMed] [Google Scholar]
- 61. Graham GG, Kannangara DR, Stocker SL, Portek I, Pile KD, Indraratna PL, Datta I, Williams KM, Day RO. Understanding the dose–response relationship of allopurinol: predicting the optimal dosage. Br J Clin Pharmacol 2013; 76: 932–8. [DOI] [PMC free article] [PubMed] [Google Scholar]
Associated Data
This section collects any data citations, data availability statements, or supplementary materials included in this article.
Supplementary Materials
Table S1
A brief outline of study designs and sampling schedules
Table S2
Details of the renal transporter genotypes
Table S3
Parameter estimates from the final PK, PKPD, PPPD and IPP models
Table S4
Noteworthy steps in the model development for the oxypurinol PK model
Table S5
Noteworthy steps in the covariate model development for the oxypurinol PD model
Table S6
The probability of treatment success (plasma urate <0.036 mmol l−1) in >75% of simulates for the doses recommended by the Hande dosing guideline
Figure S1
VPCs showing the observed oxypurinol data (red dots), the 5 th and 95 th percentiles of the observed oxypurinol data (red dashed lines) and the same percentiles for the model predicted oxypurinol plasma concentrations (dark dashed line) with 95% confidence interval around the percentiles (shaded area) against each significant covariate. The 50 th percentile of the observed oxypurinol data (red solid line) and the same percentiles for the model predicted oxypurinol plasma concentrations (dark solid line). a) not taking diuretics, b) taking diuretics, c) over the range of CLcr (note that CLcr is expressed in l h−1. 6 l h−1 is equivalent to 100 ml min−1), d) over the range of fat‐free mass
Figure S2
VPCs showing the observed urate data (red dots), 5 th and 95 th percentiles of the observed urate data (dashed red lines) and the same percentiles for the model predicted urate plasma concentrations (dark dashed line) with 95% confidence interval around the percentiles (shaded area) against significant covariates. The 50 th percentile of the observed urate data (red solid line) and the same percentiles for the model predicted urate plasma concentrations (dark solid line). a) not taking diuretics, b) taking diuretics, c) over the range of CLcr (note that CLcr is expressed in l h−1. 6 l h−1 is equivalent to 100 ml min−1), d) over the range of fat‐free mass
Supporting info item
Supporting info item
Supporting info item
Supporting info item
Supporting info item
Supporting info item
Supporting info item