
Figure 2.
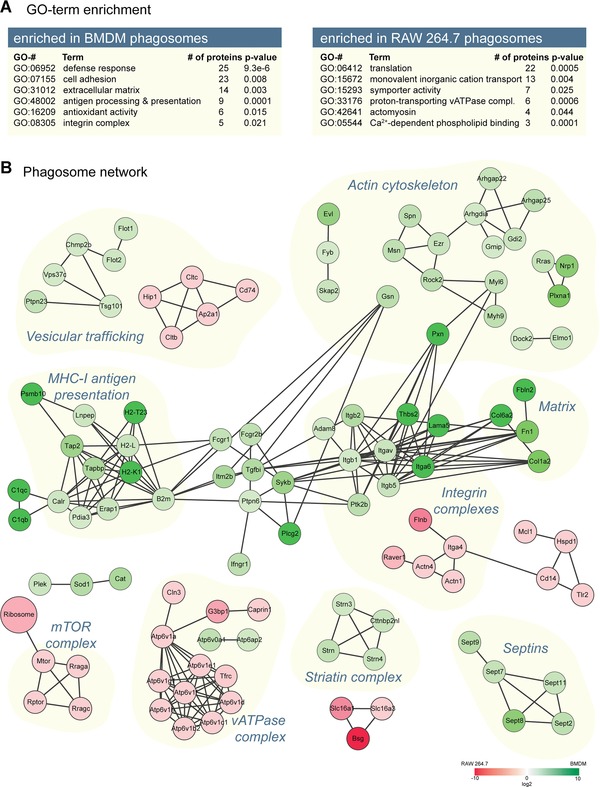
GO‐term enrichment and phagosome network analyses. (A) Selected GO terms of proteins enriched in the phagosome proteomes isolated from either BMDM or RAW 264.7 cells. (B) The phagosome network analysis shows cellular processes that were significantly enriched in the phagosomal proteome of BMDM (green) or decreased (red) compared to RAW 264.7 cells. The connection (gray edges) between nodes represents experimentally proven physical interaction between proteins.