Abstract
To employ in vivo imaging and histological techniques to identify and quantify vascular changes early in the course of treatment with trastuzumab in a murine model of HER2+ breast cancer. Dynamic contrast-enhanced magnetic resonance imaging (DCE-MRI) was used to quantitatively characterize vessel perfusion/permeability (via the parameter Ktrans) and the extravascular extracellular volume fraction (ve) in the BT474 mouse model of HER2+ breast cancer (N = 20) at baseline, day one, and day four following trastuzumab treatment (10 mg/kg). Additional cohorts of mice were used to quantify proliferation (Ki67), microvessel density (CD31), pericyte coverage (α-SMA) by immunohistochemistry (N = 44), and to quantify human VEGF-A expression (N = 29) throughout the course of therapy. Longitudinal assessment of combination doxorubicin ± trastuzumab (N = 42) tested the hypothesis that prior treatment with trastuzumab will increase the efficacy of subsequent doxorubicin therapy. Compared to control tumors, trastuzumab-treated tumors exhibited a significant increase in Ktrans (P = 0.035) on day four, indicating increased perfusion and/or vessel permeability and a simultaneous significant increase in ve (P = 0.01), indicating increased cell death. Immunohistochemical and ELISA analyses revealed that by day four the trastuzumab-treated tumors had a significant increase in vessel maturation index (i.e., the ratio of α-SMA to CD31 staining) compared to controls (P < 0.001) and a significant decrease in VEGF-A (P = 0.03). Additionally, trastuzumab dosing prior to doxorubicin improved the overall effectiveness of the therapies (P < 0.001). This study identifies and validates improved perfusion characteristics following trastuzumab therapy, resulting in an improvement in trastuzumab-doxorubicin combination therapy in a murine model of HER2+ breast cancer. This data suggests properties of vessel maturation. In particular, the use of DCE-MRI, a clinically available imaging method, following treatment with trastuzumab may provide an opportunity to optimize the scheduling and improve delivery of subsequent cytotoxic therapy.
Keywords: MRI, Immunohistochemistry, Normalization, Angiogenesis, Herceptin, Adriamycin, BT474
Introduction
Of the 200,000 breast cancer cases diagnosed annually in the United States, an estimated 25–30 % are human epidermal growth factor receptor 2 positive (HER2+), which indicates an amplification of the HER2 protein [1–3]. Overexpression of HER2 is indicative of a poorer prognosis and greater chance of metastasis in comparison to the majority of breast cancer subtypes [3]. Trastuzumab, a targeted monoclonal antibody that interferes and blocks the HER2/neu receptor was the first available targeted treatment for HER2+ breast cancers [4]. Trastuzumab binds to domain IV of the extracellular segment of the HER2/neu receptor, causing arrest in the G1 phase of the cell cycle, and reducing proliferation [5]. Furthermore, this inhibits the intracellular signaling of several pathways including the mitogen-activated protein kinase (MAPK) and phosphoinositide 3-kinase/protein kinase B (PI3K/ AKT) pathways leading to cell cycle arrest and suppression of cell proliferation [6]. Trastuzumab also causes HER2 internalization and degradation through promotion of tyr-osine kinase-ubiquitin ligase c-casitas B-lineage lymphoma (c-Cbl) [7, 8]. A secondary mechanism of action is through inhibition of angiogenic factors, creating an indirect anti-angiogenic treatment. This is thought to be due to down-regulation of vascular endothelial growth factor (VEGF) expression induced by trastuzumab, although the exact pathway has yet to be established [9–11]. Trastuzumab has been established as an effective therapy in the treatment of HER2+ breast cancers [12, 13], and is currently included in the standard-of-care treatment for patients with this disease.
Without the recruitment of new vasculature, a tumor cannot grow beyond 1–2 mm in diameter [14]. Angio-genesis is induced by activating biological signals for endothelial cell receptors which are present in the pre-existing vessels. As malignant tumors develop, the blood vessels become irregular, tortuous, chaotic in organization, leaky with perivascular detachment, and dilated in comparison to normal vasculature. Anti-angiogenic agents have been shown to transiently stabilize abnormal tumor vas-culature through restoring the balance of the pro- and anti-angiogenic factors [15, 16]. This process of vascular normalization is when the irregular tumor vasculature is “normalized” through improved architecture that reduces vascular resistance and improves perfusion (including reduction of vessel diameter and permeability), oxygen delivery, and overall vascular reactivity. This in turn induces a more functional tumor vasculature, providing improved hemodynamic characteristics through a more homogenous and efficient delivery of nutrients and oxygen. It has been hypothesized [17, 18] that vascular normalization leads to a transient window wherein vessels temporarily become more mature with improved basement membrane structure, endothelial cell quiescence, increased blood flow and decreased interstitial fluid pressure, thereby resulting in an opportunity for improved drug delivery. Vascular normalization was formally introduced in 2001, and since then investigators have utilized direct anti-vascular agents to induce normalization in cancer [15, 19]. While trastuzumab-induced vascular normalization has been previously proposed [10], there have not been any subsequent studies in breast cancer. Additionally, a non-invasive method that could quantitatively characterize vascular alterations after trastuzumab therapy would greatly assist in the clinical translation of this opportunity to enhance the efficacy of cytotoxic therapy.
One method that has been used to quantitatively assess vascular status before and during therapy is dynamic contrast-enhanced magnetic resonance imaging, DCE-MRI [20]. DCE-MRI utilizes the rapid acquisition of a series of T1-weighted images prior to and after the injection of an exogenous contrast agent. By analyzing the way in which the contrast agent enters, distributes, and leaves the tumor, it is possible to obtain quantitative information on vascular permeability, perfusion/blood flow, and tissue volume fractions. Pharmacokinetic parameters can quantitatively assess the vascular changes within a tumor, and evidence is mounting that these measures can predict tumor response to therapy [21–25]. Furthermore, DCE-MRI has been demonstrated to be a reliable method for longitudinally tracking vascular changes in mouse models of breast cancer [26–28].
This study has three primary goals. The first was to use DCE-MRI to identify vascular alterations resulting from trastuzumab therapy in a murine model of HER2+ breast cancer, and the second was to validate these findings via quantitative histology and the enzyme-linked immunosorbent assay (ELISA). The third goal was to test the hypothesis that trastuzumab-induced vascular alterations have the potential to significantly improve intratumoral delivery of doxorubicin. This was completed through investigating overall treatment efficacy as a function of order and timing of trastuzumab ± doxorubicin.
Methods
Cell culture
BT474 breast cancer cells were originally purchased from ATCC. BT474 breast cancer cells are HER2+ with an estimated 25-fold increase in HER2 expression relative to normal mammary epithelial cells and have an established positive response to trastuzumab treatment both in vitro and in vivo [29–31]. Additionally, BT474 cells are ER+ and PR+ [32]. Cells were cultured in improved minimal essential medium (IMEM, Invitrogen, Carlsbad, CA) supplemented with 10 % FBS and 1 % insulin at 37 °C with 5 % CO2. Trastuzumab was purchased from the Vanderbilt University Hospital Pharmacy (Nashville, TN). Cells were cultured to 80–90 % confluency and cell counts were determined with a hemocytometer and trypan blue dye exclusion.
Animal procedures and care
All animal procedures were approved by the Vanderbilt University Institutional Animal Care and Use Committee. (We note that animals (N = 20) utilized in the imaging study (experiment one, described below) are a subset of animals included in a previous study [33]). Nude athymic female mice (N = 135) were subcutaneously implanted with a 0.72 mg, 60-day release, 17β-estradiol pellet (Innovative Research of America, Sarasota, FL). Approximately 24 h later, 107 BT474 breast cancer cells in serum-free media with 20 % growth factor-reduced Matrigel were injected subcutaneously into the flank of the mouse. Tumors grew to an average volume ± standard error of 228.79 ± 20.31 mm3 before experiments began (4–6 weeks after implantation).
Experiment 1: dynamic contrast-enhanced magnetic resonance imaging
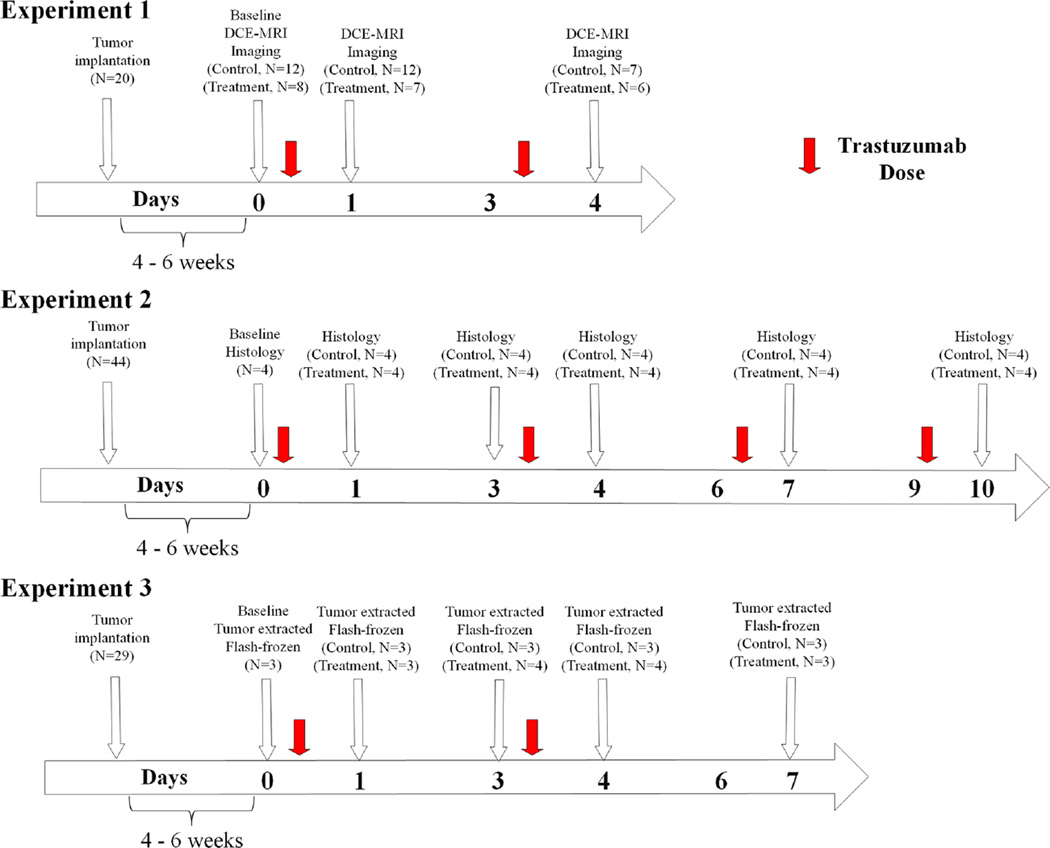
Mice (N = 20) were randomly sorted into two groups: BT474 treated or control, and were imaged with DCE-MRI on days zero (baseline), one (24 h after baseline), and four. Two days prior to baseline imaging, an indwelling 26-gauge jugular catheter was surgically implanted for delivery of an exogenous MRI contrast agent. Treated animals received an intraperitoneal injection of trastuzumab (10 mg/kg) on day zero (immediately following imaging) and again on day three; controls received comparable saline injections. The dose of trastuzumab was selected to closely match that used in the clinical setting for HER2+ breast cancer patients (a typical clinical dose is between 4 and 8 mg/kg) [12, 34, 35]. Tumor size was tracked through MRI measurements. See Fig. 1 and Supplemental Table 1 for details on animals and dosing schedule.
Fig. 1.
The temporal relationship between treatments, imaging, and histological evaluation for trastuzumab are shown for experiments one and two. Experiment one, a DCE-MRI study evaluated longitudinal changes in vascularity between trastuzumab-treated and control BT474 HER2+ breast cancer tumor-bearing mice until day four after initiating treatment (day zero). Experiment two utilized this same mouse model for an extended time through 10 days and evaluated cellular and vascular changes with histological analysis to confirm alterations observed in experiment one
DCE-MRI data were collected with a 7.0 T MRI scanner (Agilent Technologies (formally Varian), Palo Alto, CA) equipped with a 38 mm quadrature RF coil (Doty Scientific, Columbia, SC). Animals were anesthetized and the tumor was localized in the center of the coil. Respiratory and body temperature were monitored and maintained in the normal physiological range. The tumor region was localized with 3D gradient echo scout images. Anatomical T2-weighted images were acquired using a fast spin-echo pulse sequence with the following parameters: repetition time (TR)/echo time (TE) = 5500/35.6 ms, one mm slice thickness, 15 total slices, and a field of view (FOV) = 28 × 28 mm2. Acquisition of a pre-contrast T1 map was obtained via an inversion recovery fast low angle shot gradient echo sequence with an adiabatic inversion pulse with seven inversion times ranging from 250 to 10,000 ms. Dynamic T1 -weighted images were acquired using a spoiled gradient echo sequence at a temporal resolution of 12.8 s for 20 min with the following parameters: TR/TE = 100 ms/2.1 ms, one mm slice thickness, 15 total slices, a flip angle of 25°, two excitations, and a FOV = 28 × 28 mm2. Pre-contrast images were acquired, and then a bolus of Gadolinium-diethylenetriaminepen-taacetic acid (Gd-DTPA) was administered using an automated syringe pump. Data were imported into MATLAB and custom software was developed to return parametric maps of Ktrans, ve, and kep (=Ktrans/ve, the efflux constant) [36–38] from the voxel-based DCE-MRI analysis. (See Supplemental Information for more details on the DCE-MRI experimental methods).
Experiment 2: immunohistochemistry analysis of vascular and cellular alterations
Mice (N = 44) were separated into two groups: BT474 treated and control. Mice were longitudinally assessed for 10 days following initiation of treatment. Treatment occurred on days zero (this is the baseline measurement immediately prior to the first treatment), three, six, and nine (see Fig. 1; Supplemental Table 2) as described in experiment one. Tumor size was tracked over time with caliper measurements. Mice were sacrificed and tumors resected on days zero, one, three, four, seven, and 10 for immunohistochemistry analysis; there were four treated and control animals for each time point, except for day zero, in which there were four animals total. Tumor sections were fixed in formalin and then embedded in paraffin. A hematoxylin and eosin (H&E) stained section was obtained from the tissue block. Following antigen retrieval on the remaining sections, the tissue sections were stained according to modified manufacturer’s protocols with anti-CD31 (Abcam, Cambridge, MA), anti-Ki67 (Dako Carpinteria, CA), or anti-α-smooth muscle actin (SMA) (Abcam, Cambridge, MA). Immunostained slides were digitally scanned and analyzed at high resolution (20×) with a Leica (Leica Microsystems Inc, Ariol, Buffalo Grove, IL) SCN400 Slide Scanner. (See Supplemental Information for more detailed immunohistochemistry experimental methods).
H&E sections were utilized to identify viable regions-of-interest within the tissue. The software program associated with Leica SCN400 was trained (based on thresholds of stain color, intensity, and shape) to automate quantification of microvessel density, proliferation, endothelial cell coverage, and nuclei density. Microvessel density (MVD) was examined through analysis of CD31 staining and quantified as the total microvessels per area in each ROI. Utilizing the same ROI, coverage of α-SMA stained endothelial cells was calculated. A “vessel maturation index” (VMI) was calculated as the fraction of α-SMA stained vessels compared to total CD31 stained vessels [39]. Quantification of cell proliferation (Ki67 staining) was calculated as the percentage of positive stained nuclei per total nuclei detected within the viable tissue regions of the tumor.
Experiment 3: VEGF ELISA
Mice (N = 29) were randomly assigned into trastuzumab treated or control groups (N = 3–4 per group, described in Fig. 1; Supplemental Table 3) and sacrificed on days zero, one, three, four, and seven (treatment was given on days one and four with 10 mg/kg as described above). Mice were euthanized, and tissue was harvested immediately thereafter and flash frozen in liquid nitrogen. Tumors were lysed in 2× TNE lysis buffer with Tissue Lyser (Tissue Lyser II, Qiagen, United States, Boston, MA, USA). Bicinchoninic (BCA) protein assay was completed to quantify protein prior to assay. Human VEGF-A Enzyme-linked immunosorbent assay (ELISA) for lysates was performed to quantify protein expression following the vendor’s established protocol (RayBiotech, Norcross, GA, USA). Two samples were used for analysis.
Experiment 4: treatment with trastuzumab and doxorubicin
Longitudinal response to trastuzumab and doxorubicin was compared to evaluate the effects of order on treatment response (N = 42; please refer to Table 1; Supplemental Fig. 1 for details on groups, animal numbers, and dosing schedules). Doxorubicin was purchased from Sigma-Aldrich (CAS number 25316-40-9). Animals in the treated groups received an intraperitoneal injection of trastuzumab (10 mg/kg, diluted to a total volume of 100 µL) on the days noted in Table 1, and/or doxorubicin (1.5 mg/kg diluted to 100 µl) via a tail vein injection, while controls received comparable saline (100 µl) injections. Combination therapy groups received doxorubicin 24 h prior to trastuzumab, trastuzumab 24 h prior to doxorubicin, or doxorubicin given simultaneously with two doses of trastuzumab (day zero and day three). The chosen dose of trastuzumab was designed to test the synergistic relationship between combination therapy dosing and timing of administration [29].
Table 1.
Treatment schedule for doxorubicin and trastuzumab to evaluate the order of combination dosing: Experiment 4
| Groups |
Treatments with dosing schedule (days) |
|||
|---|---|---|---|---|
| Group number (N) | Dosing | Doxorubicin | Trastuzumab | Saline |
| 1 (N = 7) | Control | – | – | 0, 3, 4 |
| 2 (N = 7) | Doxorubicin | 4 | – | 0, 3 |
| 3 (N = 7) | Trastuzumab | – | 0, 3 | 4 |
| 4 (N = 7) | Doxorubicin 24 h prior to Trastuzumab | 0 | 1, 4 | – |
| 5 (N = 7) | Trastuzumab 24 h prior to Doxorubicin | 4 | 0, 3 | – |
| 6 (N = 7) | Trastuzumab + Doxorubicin | 0, 3 | 0, 3 | – |
Tumor volumes were measured with calipers once per week until initiation of therapy and then measured three times per week. Comparisons were made on day 26 relative to the start of therapy.
Statistical analysis
Using previously collected tumor volume measurements of HER2+ tumors in response to trastuzumab [31], sample sizes were selected to provide 80 % power to see a difference of 20 % at the P ≤ 0.05 level. Statistical analysis was completed with GraphPad Prism 6 (GraphPad Software Inc, La Jolla, CA). Longitudinal DCE-MRI parameters were compared within and between cohorts at each time point using the nonparametric Wilcoxon rank sum test. Receiver operating characteristic (ROC) analysis was performed for absolute parameter values on baseline, day one, and day four data to determine their sensitivity to determine trastuzumab-treated (responsive) and untreated (unresponsive) tumors. Histological and ELISA data were compared between cohorts using a nonparametric Wilcoxon rank sum test. Longitudinal tumor volume measurements parameters were compared between cohorts at times points using analysis of variance (ANOVA). All data are presented as mean ± standard error (SE) with P ≤ 0.05 was considered significant.
Results
Experiment 1: dynamic contrast-enhanced magnetic resonance imaging
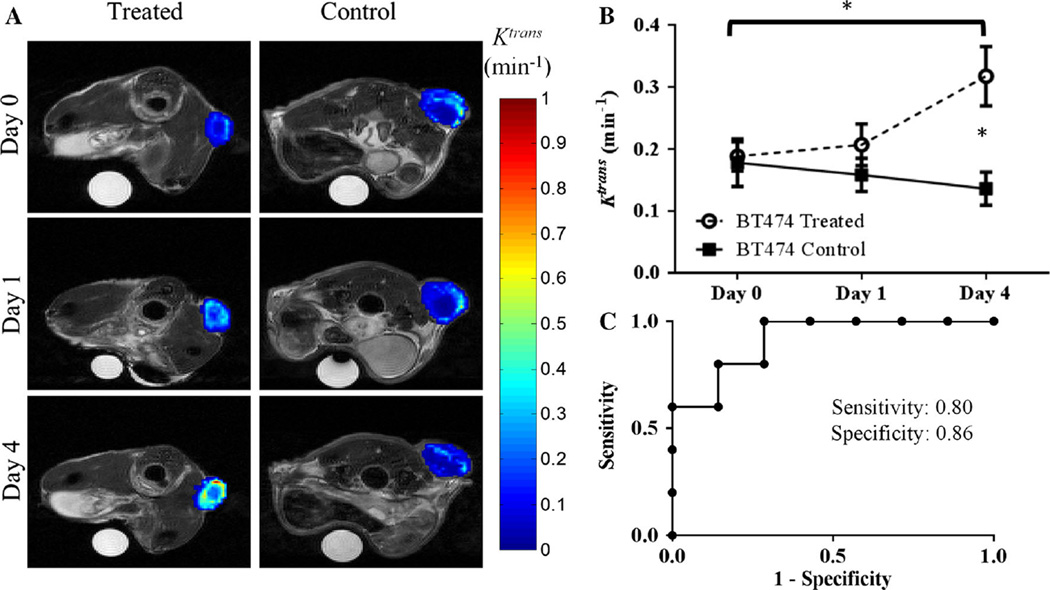
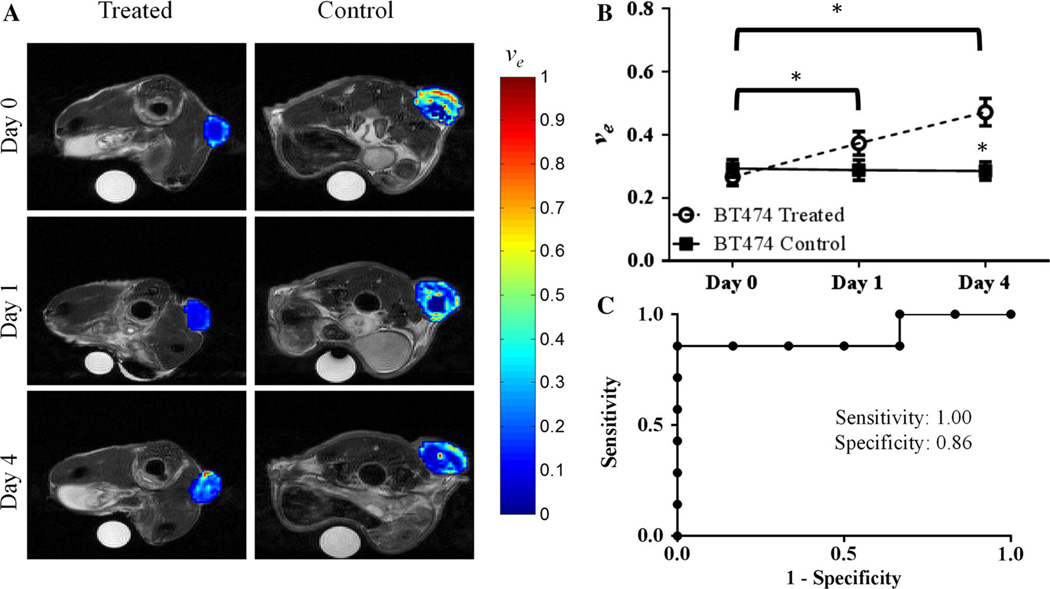
Trastuzumab-treated HER2+ tumors exhibited group increases from baseline to day one in ve (P = 0.04) and baseline to day four for both ve (P = 0.002) and Ktrans (P = 0.03), as seen in Figs. 2 and 3. In particular, compared to control tumors on day four, the treated tumors exhibited a twofold higher Ktrans value (P = 0.03) (Fig. 2). Additionally at day four, trastuzumab-treated tumors exhibited a significantly higher ve (P = 0.01) when compared to control tumors (Fig. 3). Analysis of kep revealed no significant changes on baseline and day one compared to control groups (P = 0.52, P = 0.67, respectively), and a 73.6 % (though not significant) increase compared to control tumors on day four (P = 0.20). There were also no changes in longitudinal group increases in kep from baseline to day four (P = 0.36). Importantly, there were no significant differences in tumor size (see Fig. 4) between the groups on day one (P = 0.84) or on day four (P = 0.11); thus, the significant changes in the functional characteristics listed above preceded the temporally downstream changes in tumor size.
Fig. 2.
a Displays representative longitudinal parametric maps of Ktrans (overlaid on T2-weighted anatomical images at the imaging time points) in the treated (first column) or control (second column) animals from experiment one. b Treated tumors exhibited group increases in Ktrans from day zero to day four (P = 0.028). Compared to control tumors, the trastuzumab-treated tumors had a significantly larger Ktrans value on day four (P = 0.035). c ROC analysis on day four between treatment and control mice was 0.86 (P = 0.03)
Fig. 3.
a Displays representative longitudinal, parametric maps of ve (overlaid on T2-weighted anatomical images at each imaging time point) in treated (first column) or control (second column) animals from experiment one. b Treated tumors exhibited group increases in ve from day zero to day one (P = 0.04) and to day four (P = 0.002). (C) ROC analysis on day four between treatment and control mice was 0.91 (P = 0.01)
Fig. 4.
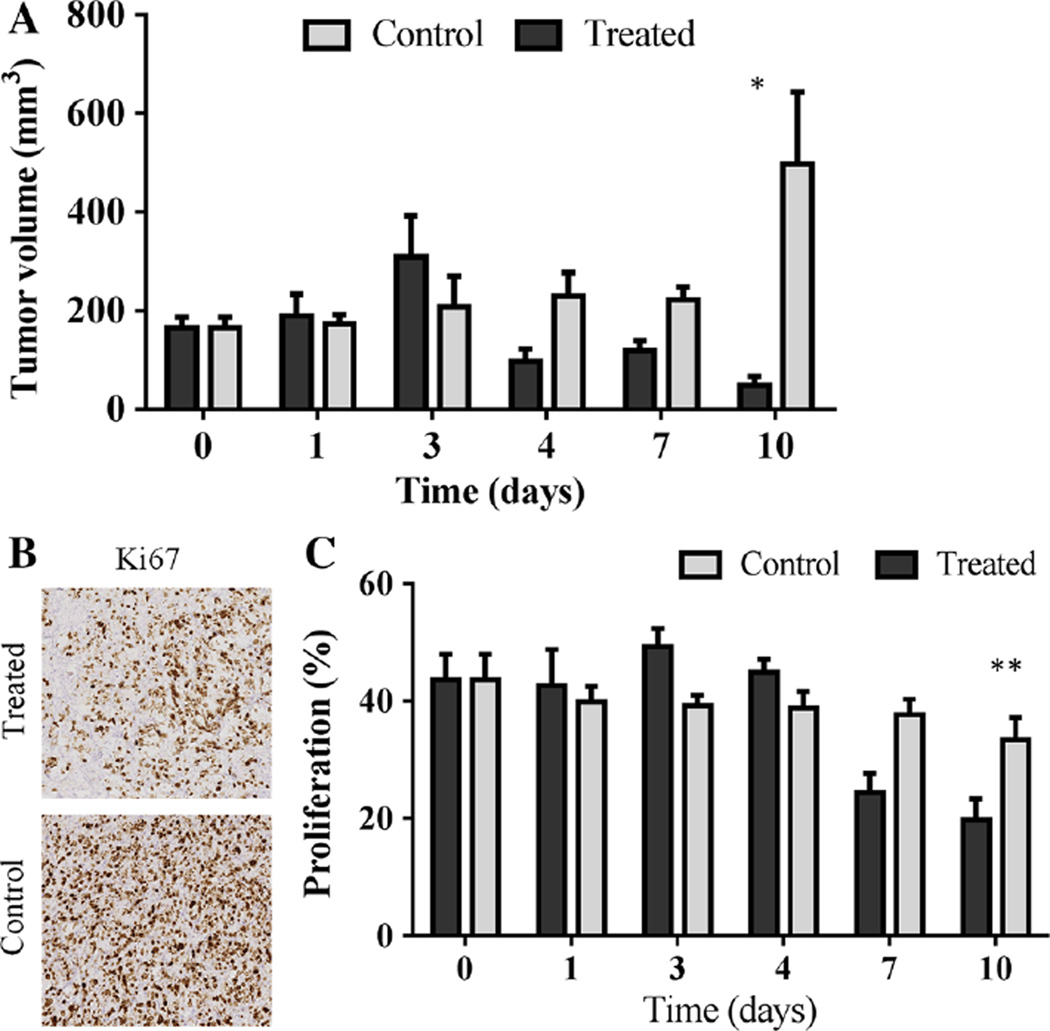
Trastuzumab-treated tumors present significantly decreased tumor size compared to control tumors in experiment two (N = 4 per group) (a). On day 10, there is a significant difference in tumor volume (mm3) between the groups (P = 0.03), confirming response to trastuzumab. Representative images of Ki67 histological staining reveals qualitative differences in percentage of viable cells undergoing proliferation on day seven (b). In addition, tumors from treated animals exhibited a significantly lower percent of proliferation, as stained by Ki67, compared to control (vehicle-treated) mice, on day ten (P < 0.001) (c). Important to note, on day zero, the control and treated groups (a, c) are the same cohort of mice
ROC analysis was performed between treated and control tumors for days one and four for all the MRI parameters investigated. On day one, ROC analysis revealed area under the curve values of 0.61 (P = 0.45), 0.70 (P = 0.15), 0.60 (P = 0.50), and 0.53 (P = 0.80) for Ktrans, ve, kep, and tumor volume, respectively. On day four, ROC analysis presented an overall accuracy for separating groups with area under the curve values of 0.91 (P = 0.02), 0.91 (P = 0.02), 0.71 (P = 0.22) and 0.74 (P = 0.15) for Ktrans, ve, kep and tumor volume, respectively. At the cutoff value with the highest likelihood ratio to determine the area under the curve analysis, the sensitivity and specificity for the values are as listed: Ktrans (sensitivity = 0.80, specificity = 0.86, cutoff = 0.15), ve (sensitivity = 1.0, specificity = 0.86, cutoff = 0.37), kep (sensitivity = 0.80, specificity = 0.71, cutoff = 0.49), and tumor volume (sensitivity = 0.83, specificity = 0.57, cutoff = 140.9). Figure 2 (Ktrans) and 3 (ve) show the parameters for which quantitative DCE-MRI analysis showed significant differences between groups.
Experiment 2: immunohistochemistry analysis of vascular and cellular alterations
When evaluating tumor volume at each day of the mice used for histology, the trastuzumab-treated tumors revealed a significant difference in tumor volume (mm3) compared to control tumors 10 days after the initiation of treatment (N = 4 per group, P = 0.03, as seen in Fig. 4). Evaluation of percent positive Ki67 staining showed a similar level of proliferation in the control tumors during the course of the study; however, treated tumors demonstrated significantly decreased proliferation on days seven and 10 compared to baseline (P < 0.0001), as seen in Fig. 4. Ki67 positive staining on day 10 (19.78 ± 3.58 %) was significantly less than control tumors staining (33.41 ± 3.32 %), revealing a significantly decreased proliferation in treated tumors (P < 0.001).
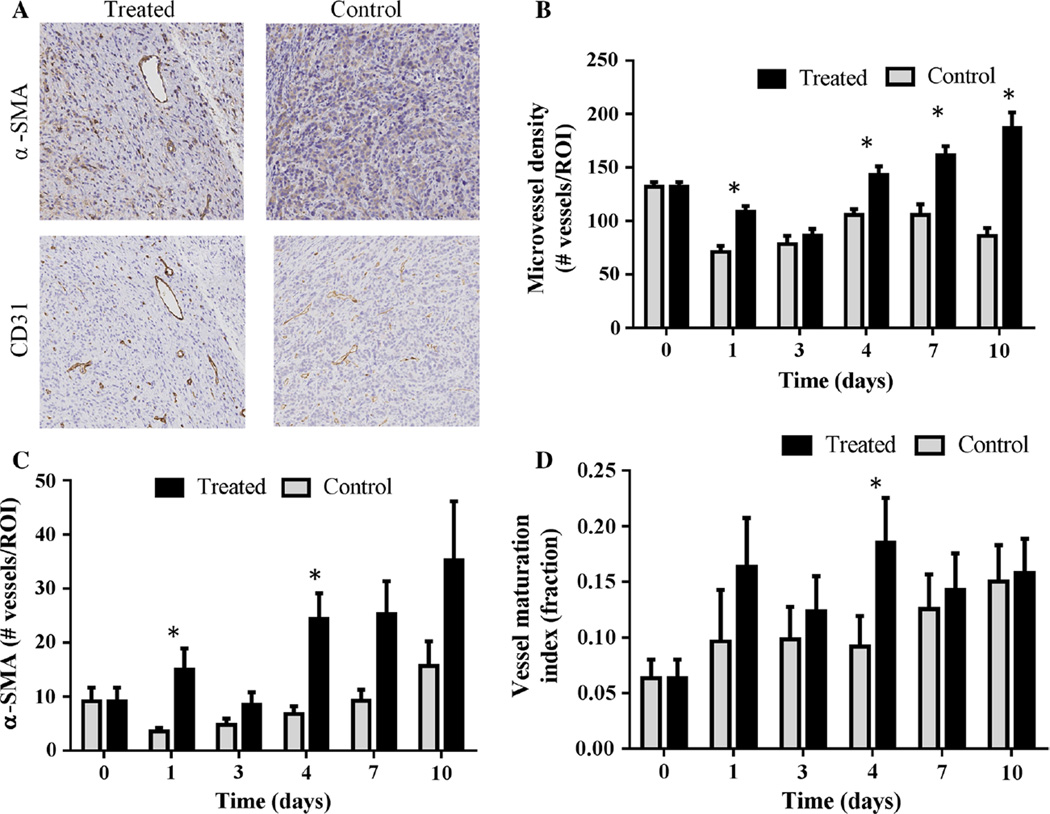
Immunohistochemical staining for CD31 showed a significant increase in microvessel density in trastuzu-mab-treated tumors by on day one (P = 0.002) and again on day four (P < 0.01). This trend continued on days seven (P < 0.001) and day 10 (P < 0.0001). Additionally, there was a simultaneous significant increase in α-SMA staining (pericyte density) on day four (P < 0.0001). Note that the α-SMA staining of the control tumors is generally 15 % or lower (Fig. 5d) resulting in rather variable VMI values day-to-day for these tumors (Fig. 5a), but that both α-SMA staining and VMI are higher in the trastuzumab-treated tumors. Taken together, these data indicate an overall increase in the VMI in treated tumors compared to controls (P = 0.0009 at day four), as seen in Fig. 5.
Fig. 5.
Representative images of α-SMA and CD31 staining are shown for treated and control tumors on day four (a). Corresponding quantitative histological analysis revealed that trastuzumab-treated tumors simultaneously show a significant increase in microvessel density (CD31 staining, P < 0.01) (b) and an increase in α-SMA (pericyte coverage, P < 0.0001) (c) on day four. d Presents the overall increase in the “vessel maturation index” (ratio of α-SMA to CD31 staining) that was seen in treated tumors compared to controls (P = 0.0009). Important to note, on day zero, the control and treated groups are the same cohort of mice (b, c, d)
Experiment 3: VEGF ELISA
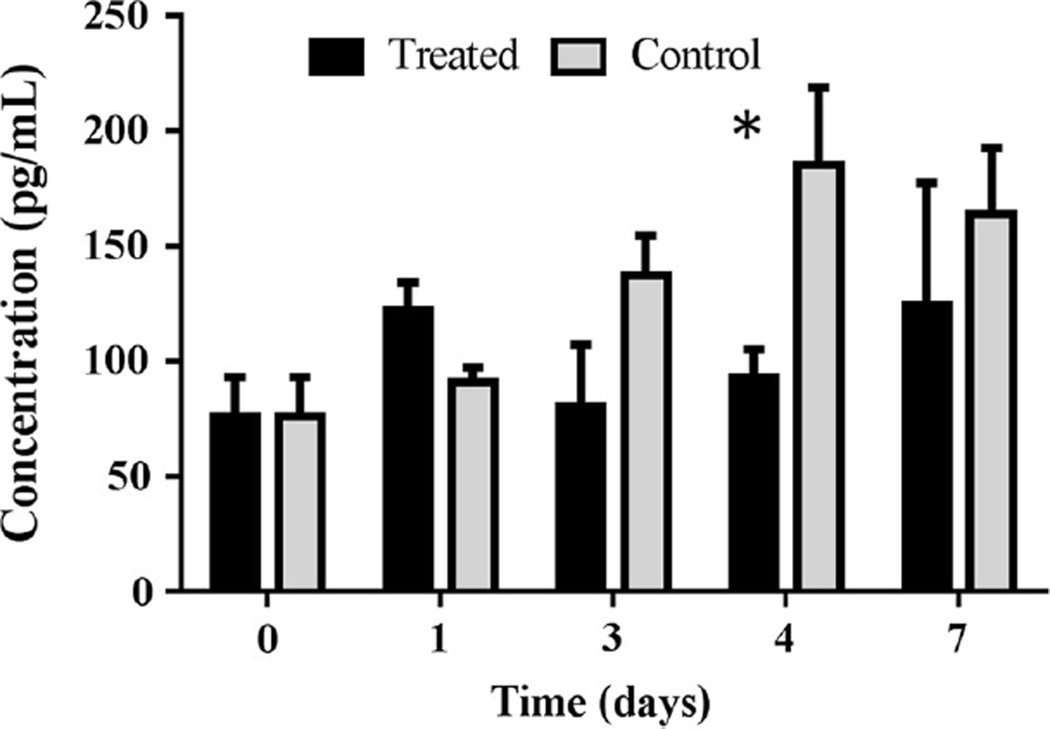
As a follow-up study to investigate possible mechanisms of action, an ELISA assay was completed to test how human VEGF levels are altered following trastuzumab treatment. Trastuzumab-treated tumors revealed a significant difference in human VEGF-A protein on day four compared to control tumors (P = 0.03), as seen in Fig. 6.
Fig. 6.
Quantification of VEGF-A concentration (pg/mL) by ELISA is shown for treated and control tumors over a seven-day period following treatment. On day four, the ELISA assay reveals a significant decrease in VEGF in treated tumors compared to controls (P = 0.03)
Experiment 4: treatment with trastuzumab and doxorubicin
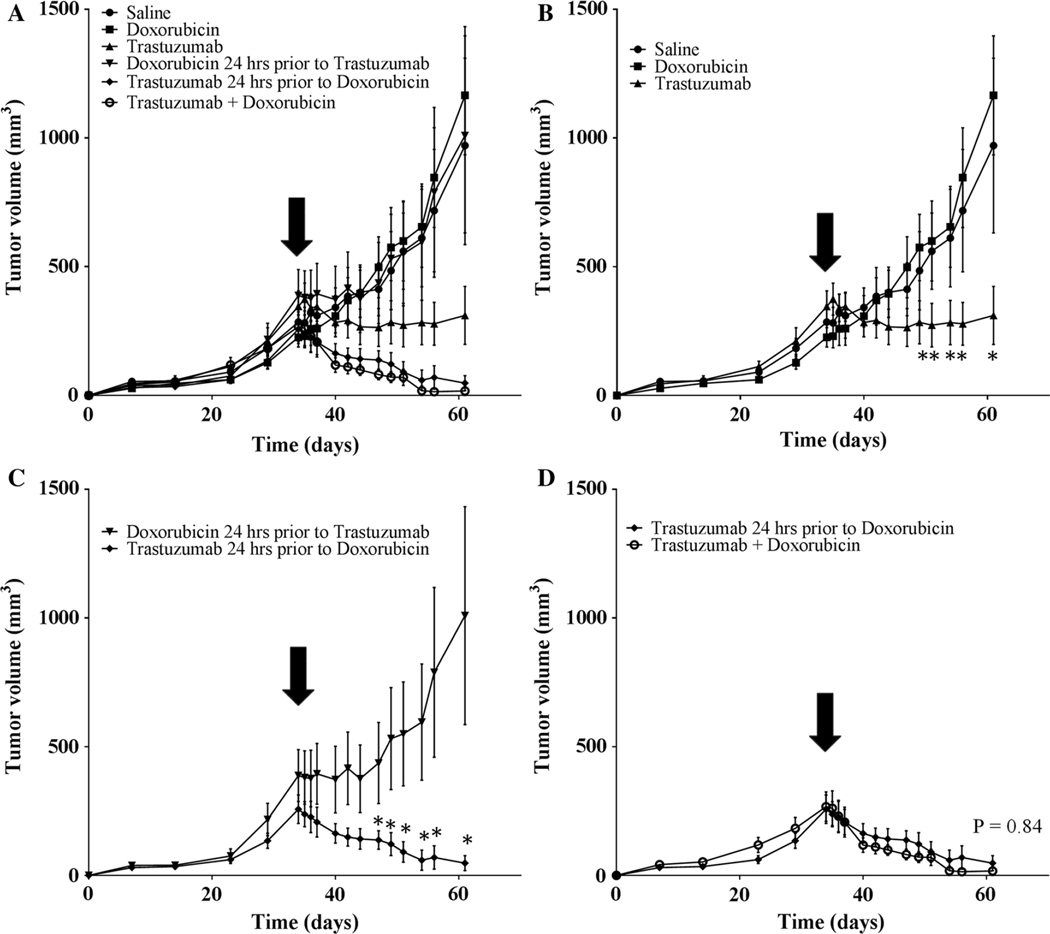
Figure 7 reveals the long-term effects of trastuzumab plus doxorubicin. A single, low dose of doxorubicin alone showed no significant differences compared to control (P = 0.30). Trastuzumab dosing prior to chemotherapy (doxorubicin) improves the overall effectiveness of the combination therapy compared to the case when doxorubicin is given prior to trastuzumab (P < 0.001). Therefore, dosing doxorubicin decreases the therapeutic efficacy even though the total dose was identical in these two cases. This data indicates that administering trastuzumab prior to one dose of doxorubicin provides statistically identical treatment efficacy (as measured by tumor volume changes) as two doses of trastuzumab and doxorubicin given simultaneously (P = 0.84).
Fig. 7.
Tumor growth curves and response to treatment over 61 days. Treatment was initiated on day 35 and mice were treated with either saline, doxorubicin alone, trastuzumab alone, doxorubicin 24 h prior to trastuzumab or trastuzumab 24 h prior to doxorubicin, or doxorubicin given simultaneously with both doses of trastuzumab (doxorubicin + trastuzumab). a Displays all groups, while (b–d) highlight important comparisons within those groups. b Displays the control group and single agent drug groups; trastuzumab significantly decreases tumor volume compared to both saline and doxorubicin alone (P < 0.0001). c Reveals that the order of dosing (while keeping the same total amount of drug given constant) plays a significant role in tumor response to treatment (P < 0.0001). d Shows that trastuzumab given prior to one dose of doxorubicin is not significantly different than two doses of doxorubicin administered simultaneously with trastuzumab (P = 0.84)
Discussion
In HER2+ breast cancer patients, trastuzumab is commonly included in standard-of-care treatment in combination with chemotherapies, other targeted agents, and radiation treatment [40]. The concept of optimizing FDA approved treatments allows for simplified modifications to drug regimens currently employed in the clinical setting. Importantly, the combination of doxorubicin and trastuzumab is clinically relevant because these treatments are commonly administered in the standard-of-care setting (e.g., a common regimen is doxorubicin + cytoxan followed by taxane + trastuzumab). To the best of our knowledge, the orders of these therapies have never been preclinically or clinically investigated. Our study indicates that DCE-MRI reveals day four as having the most potential to exploit the improved vessel maturation to evaluate whether this would also lead to improved drug efficiency.
Drug-induced vascular maturation provides an opportunity to improve efficiency of therapies without increasing patient dose. The initial DCE-MRI study revealed an increase in Ktrans which suggests properties of improved vessel delivery (Fig. 2); this hypothesis is further supported by an increase in the VMI during the same period (Fig. 5). The ability to identify such a phenomenon with noninvasive imaging would lead to the tantalizing possibility of improving delivery and, subsequently, efficacy of a cyto-toxic therapy on an individual patient basis. This hypothesis is supported by the results of experiment four which indicates trastuzumab improves vascular delivery of dox-orubicin leading to a significant improvement in overall effectiveness of the combination therapy (Fig. 7).
Our study is further supported by investigators who have shown components of improved vascular characteristics in response to trastuzumab in HER2+ cancer. Izumi et al. evaluated HER2+ MDA-MB-361 murine model of brain cancer with optical imaging and presented the evidence that trastuzumab increased overall survival rate, while initiating a more normal phenotype in tumor blood vessels [10] through a significant reduction in vessel diameter and vascular permeability. Additionally, Heyerdahl et al. revealed that xenograft tumors treated with trastuzumab labeled 227Th were well perfused and exhibited vascular stability [41] when radiotherapy was expected to damage vascular perfusion.
The imaging and histological data presented in our study identified vascular changes amplified on day four; a phenomenon that is supported by previous studies. For example, McCormack et al. demonstrated that trastuzumab significantly lowers VEGF compared to control BT474 tumors on day five post treatment, confirming vascular alterations with hyperspectral imaging [42]. Le et al. also revealed a decrease in VEGF in response to trastuzumab [43]. These outcomes agree with our results of decreased in human VEGF (Fig. 6), therefore it is hypothesized that the inhibition of VEGF promotes vascular maturation, thereby increasing the overall vascular function and systemic delivery of nutrients and drugs within the tumors [39].
Limitations of our study include the short imaging time frame; this is directly affected by the functional lifespan of the indwelling jugular catheter which is limited to approximately one week. The xenograft model, despite its fundamental limitations, is still the natural system for a response study such as the one presented here. As this xenograft tumor responds to trastuzumab within 4–7 days, the time frame of the tumor growth changes are in concordance with the relative time frame of response to treatment. Thus, we believe the time frame selected for the studies is appropriate to regarding the administration of the secondary treatment. Although there are limitations, the BT474 tumors do show substantial and homogenous vessel growth across the tumor (as seen by our relatively high CD31 counts and low deviation at baseline measurements). Additionally, both the tumor cells and vessels show alterations (i.e., cell death, increased vessel maturation) in response to trastuzumab treatment, indicating sufficient drug delivery through a functioning vascular system. Furthermore, to the best of our knowledge these data are the first of its kind: that is, these studies show that noninvasive imaging can identify temporal windows where vascular delivery to a tumor is improved which can lead to improved therapeutic control of the tumor. This provides the preliminary data and motivation for further studies in more complicated (i.e., biologically realistic) mouse models of HER2+ breast cancer.
Conclusions
Our results provide multiple lines of evidence that trastu-zumab increases vascular delivery to BT474 tumors. Additionally, trastuzumab dosing prior to chemotherapy (doxorubicin) synergistically improved the overall effectiveness of the therapies. Thus, this data indicates administration of trastuzumab prior to other chemotherapeutics (the opposite of current standard-of-care practice) could potentially improve effectiveness of anti-cancer treatments in HER2+ breast cancer. Furthermore, exploiting the increased vascular delivery within the tumor’s vasculature by treatment with trastuzumab has potential to enhance the effectiveness of combination therapies, without increasing drug dosing or systemic toxicity. The reduction of cytotoxic side effects and improvement of treatment efficiency has the capability to improve breast cancer patient’s overall health and quality of life. The ability to identify this temporal window via a clinically relevant imaging modality (i.e., DCE-MRI) would provide the opportunity to optimize therapy on a patient-specific basis.
Supplementary Material
Acknowledgments
We thank the National Cancer Institute for support through R01CA138599, P50CA098131, P30CA68485, R25CA092043, 5T32CA093240, and U01CA174706. We thank the Kleberg Foundation for the generous support of Vanderbilt’s biomedical imaging program. The authors thank Dr. Carlos Arteaga for his guidance on the combination therapy portions of this project. Additionally, we would also like to thank Dr. Jin Chen, Dr. Shan Wang, Dr. Melissa Skala, and Ms. Amy Shah for their helpful conversations.
Abbreviations
- α-SMA
Alpha- smooth muscle actin
- ANOVA
Analysis of variance
- BCA
Bicinchoninic
- DCE-MRI
Dynamic contrast-enhanced magnetic resonance imaging
- ELISA
Enzyme-linked immunosorbent assay
- Gd-DTPA
Gadolinium-diethylenetriaminepentaacetic acid
- HER2+
Human epidermal growth factor receptor 2 positive
- H&E
Hematoxylin and eosin stain
- MAPK
Mitogen-activated protein kinase
- MVD
Microvessel density
- NEX
Number of excitations
- PI3K/AKT
Phosphoinositide 3-kinase/protein kinase B
- ROC
Receiver operating characteristic
- ROI
Region-of-interest
- TE
Echo time
- TR
Repetition time
- VEGF
Vascular endothelial growth factor
- VMI
Vessel maturation index;
Footnotes
Authors’ contributions AS and JW carried out DCE-MRI studies, AS and VS carried out histology studies. AS and AH performed the ELISA study. AS carried out the combination therapeutic studies. AS completed the statistical analysis. OM, CQ, AS, AH, JW, and TY were involved in the conception and design of the study. All authors read and approved the final manuscript.
Compliance with ethical standards
Conflicts of interest The authors have no competing interest to declare in relation to this manuscript.
Electronic supplementary material The online version of this article (doi:10.1007/s10549-016-3680-8) contains supplementary material, which is available to authorized users.
Contributor Information
Anna G. Sorace, Email: anna.sorace@vanderbilt.edu.
C. Chad Quarles, Email: christopher.quarles@dignityhealth.org.
Jennifer G. Whisenant, Email: j.whisenant@vanderbilt.edu.
Ariella B. Hanker, Email: ariella.hanker@vanderbilt.edu.
J. Oliver McIntyre, Email: oliver.mcintyre@vanderbilt.edu.
Violeta M. Sanchez, Email: violeta.sanchez@vanderbilt.edu.
Thomas E. Yankeelov, Email: thomas.yankeelov@vanderbilt.edu.
References
- 1.Mitri Z, Constantine T, O’Regan R. The HER2 receptor in breast cancer: pathophysiology, clinical use, and new advances in therapy. Chemother Res Pract. 2012;2012:743193. doi: 10.1155/2012/743193. [DOI] [PMC free article] [PubMed] [Google Scholar]
- 2.Dean-Colomb W, Esteva FJ. Her2-positive breast cancer: herceptin and beyond. Eur J Cancer. 2008;44(18):2806–2812. doi: 10.1016/j.ejca.2008.09.013. [DOI] [PubMed] [Google Scholar]
- 3.Spector NL, Blackwell KL. Understanding the mechanisms behind trastuzumab therapy for human epidermal growth factor receptor 2-positive breast cancer. J Clin Oncol. 2009;27(34):5838–5847. doi: 10.1200/JCO.2009.22.1507. [DOI] [PubMed] [Google Scholar]
- 4.Nahta R, Esteva FJ. HER2 therapy: molecular mechanisms of trastuzumab resistance. Breast Cancer Res (BCR) 2006;8(6):215. doi: 10.1186/bcr1612. [DOI] [PMC free article] [PubMed] [Google Scholar]
- 5.Cho HS, Mason K, Ramyar KX, Stanley AM, Gabelli SB, Denney DW, Jr, Leahy DJ. Structure of the extracellular region of HER2 alone and in complex with the Herceptin Fab. Nature. 2003;421(6924):756–760. doi: 10.1038/nature01392. [DOI] [PubMed] [Google Scholar]
- 6.Menard S, Pupa SM, Campiglio M, Tagliabue E. Biologic and therapeutic role of HER2 in cancer. Oncogene. 2003;22(42):6570–6578. doi: 10.1038/sj.onc.1206779. [DOI] [PubMed] [Google Scholar]
- 7.Vu T, Claret FX. Trastuzumab: updated mechanisms of action and resistance in breast cancer. Front Oncol. 2012;2:62. doi: 10.3389/fonc.2012.00062. [DOI] [PMC free article] [PubMed] [Google Scholar]
- 8.Klapper LN, Kirschbaum MH, Sela M, Yarden Y. Biochemical and clinical implications of the ErbB/HER signaling network of growth factor receptors. Adv Cancer Res. 2000;77:25–79. [PubMed] [Google Scholar]
- 9.Zhang A, Shen G, Zhao T, Zhang G, Liu J, Song L, Wei W, Bing L, Wu Z, Wu Q. Augmented inhibition of angiogenesis by combination of HER2 antibody chA21 and trastuzumab in human ovarian carcinoma xenograft. J Ovarian Res. 2010;3:20. doi: 10.1186/1757-2215-3-20. [DOI] [PMC free article] [PubMed] [Google Scholar]
- 10.Izumi Y, Xu L, di Tomaso E, Fukumura D, Jain RK. Tumour biology: herceptin acts as an anti-angiogenic cocktail. Nature. 2002;416(6878):279–280. doi: 10.1038/416279b. [DOI] [PubMed] [Google Scholar]
- 11.Klos KS, Zhou X, Lee S, Zhang L, Yang W, Nagata Y, Yu D. Combined trastuzumab and paclitaxel treatment better inhibits ErbB-2-mediated angiogenesis in breast carcinoma through a more effective inhibition of Akt than either treatment alone. Cancer. 2003;98(7):1377–1385. doi: 10.1002/cncr.11656. [DOI] [PubMed] [Google Scholar]
- 12.Vogel CL, Cobleigh MA, Tripathy D, Gutheil JC, Harris LN, Fehrenbacher L, Slamon DJ, Murphy M, Novotny WF, Burchmore M, Shak S, Stewart SJ, Press M. Efficacy and safety of tras-tuzumab as a single agent in first-line treatment of HER2-overex-pressing metastatic breast cancer. J Clin Oncol. 2002;20(3):719–726. doi: 10.1200/JCO.2002.20.3.719. [DOI] [PubMed] [Google Scholar]
- 13.Hortobagyi GN. Trastuzumab in the treatment of breast cancer. N Engl J Med. 2005;353(16):1734–1736. doi: 10.1056/NEJMe058196. [DOI] [PubMed] [Google Scholar]
- 14.Jain RK, Carmeliet P. SnapShot: tumor angiogenesis. Cell. 2012;149(6):1408–1408. doi: 10.1016/j.cell.2012.05.025. e1. [DOI] [PubMed] [Google Scholar]
- 15.Jain RK. Normalizing tumor microenvironment to treat cancer: bench to bedside to biomarkers. J Clin Oncol. 2013;31(17):2205–2218. doi: 10.1200/JCO.2012.46.3653. [DOI] [PMC free article] [PubMed] [Google Scholar]
- 16.Goel S, Wong AH, Jain RK. Vascular normalization as a therapeutic strategy for malignant and nonmalignant disease. Cold Spring Harb Perspect Med. 2012;2(3):a006486. doi: 10.1101/cshperspect.a006486. [DOI] [PMC free article] [PubMed] [Google Scholar]
- 17.Goel S, Duda DG, Xu L, Munn LL, Boucher Y, Fukumura D, Jain RK. Normalization of the vasculature for treatment of cancer and other diseases. Physiol Rev. 2011;91(3):1071–1121. doi: 10.1152/physrev.00038.2010. [DOI] [PMC free article] [PubMed] [Google Scholar]
- 18.Jain RK. Normalization of tumor vasculature: an emerging concept in antiangiogenic therapy. Science. 2005;307(5706):58–62. doi: 10.1126/science.1104819. [DOI] [PubMed] [Google Scholar]
- 19.Jain RK. Normalizing tumor vasculature with anti-angio-genic therapy: a new paradigm for combination therapy. Nat Med. 2001;7(9):987–989. doi: 10.1038/nm0901-987. [DOI] [PubMed] [Google Scholar]
- 20.Yankeelov TE, Gore JC. Dynamic contrast enhanced magnetic resonance imaging in oncology: theory, data acquisition, analysis, and examples. Curr Med Imaging Rev. 2009;3(2):91–107. doi: 10.2174/157340507780619179. [DOI] [PMC free article] [PubMed] [Google Scholar]
- 21.Li X, Abramson RG, Arlinghaus LR, Kang H, Chakravarthy AB, Abramson VG, Farley J, Mayer IA, Kelley MC, Meszoely IM, Means-Powell J, Grau AM, Sanders M, Yankeelov TE. Multiparametric magnetic resonance imaging for predicting pathological response after the first cycle of neoadjuvant chemotherapy in breast cancer. Invest Radiol. 2015;50(4):195–204. doi: 10.1097/RLI.0000000000000100. [DOI] [PMC free article] [PubMed] [Google Scholar]
- 22.Andersen EK, Hole KH, Lund KV, Sundfor K, Kristensen GB, Lyng H, Malinen E. Pharmacokinetic parameters derived from dynamic contrast enhanced MRI of cervical cancers predict chemoradiotherapy outcome. Radiother Oncol. 2013;107(1):117–122. doi: 10.1016/j.radonc.2012.11.007. [DOI] [PubMed] [Google Scholar]
- 23.Hylton NM, Blume JD, Bernreuter WK, Pisano ED, Rosen MA, Morris EA, Weatherall PT, Lehman CD, Newstead GM, Polin S, Marques HS, Esserman LJ, Schnall MD, Team AT, Investigators IST. Locally advanced breast cancer: MR imaging for prediction of response to neoadjuvant chemotherapy-results from ACRIN 6657/I-SPY TRIAL. Radiology. 2012;263(3):663–672. doi: 10.1148/radiol.12110748. [DOI] [PMC free article] [PubMed] [Google Scholar]
- 24.Hirashima Y, Yamada Y, Tateishi U, Kato K, Miyake M, Horita Y, Akiyoshi K, Takashima A, Okita N, Takahari D, Nakajima T, Hamaguchi T, Shimada Y, Shirao K. Pharmacokinetic parameters from 3-Tesla DCE-MRI as surrogate biomarkers of antitumor effects of bevacizumab plus FOLFIRI in colorectal cancer with liver metastasis. Int J Cancer. 2012;130(10):2359–2365. doi: 10.1002/ijc.26282. [DOI] [PubMed] [Google Scholar]
- 25.O’Connor JP, Jackson A, Parker GJ, Jayson GC. DCE-MRI biomarkers in the clinical evaluation of antiangiogenic and vascular disrupting agents. Br J Cancer. 2007;96(2):189–195. doi: 10.1038/sj.bjc.6603515. [DOI] [PMC free article] [PubMed] [Google Scholar]
- 26.Barnes SL, Whisenant JG, Loveless ME, Ayers GD, Yankeelov TE. Assessing the reproducibility of dynamic contrast enhanced magnetic resonance imaging in a murine model of breast cancer. Magn Reson Med. 2013;69(6):1721–1734. doi: 10.1002/mrm.24422. [DOI] [PMC free article] [PubMed] [Google Scholar]
- 27.Barnes SL, Whisenant JG, Loveless ME, Yankeelov TE. Practical dynamic contrast enhanced MRI in small animal models of cancer: data acquisition, data analysis, and interpretation. Pharmaceutics. 2012;4(3):442–478. doi: 10.3390/pharmaceutics4030442. [DOI] [PMC free article] [PubMed] [Google Scholar]
- 28.Wu X, Jeong EK, Emerson L, Hoffman J, Parker DL, Lu ZR. Noninvasive evaluation of antiangiogenic effect in a mouse tumor model by DCE-MRI with Gd-DTPA cystamine copolymers. Mol Pharm. 2010;7(1):41–48. doi: 10.1021/mp900153f. [DOI] [PMC free article] [PubMed] [Google Scholar]
- 29.Baselga J, Norton L, Albanell J, Kim YM, Mendelsohn J. Recombinant humanized anti-HER2 antibody (Herceptin) enhances the antitumor activity of paclitaxel and doxorubicin against HER2/neu overexpressing human breast cancer xeno-grafts. Cancer Res. 1998;58(13):2825–2831. [PubMed] [Google Scholar]
- 30.Lewis GD, Figari I, Fendly B, Wong WL, Carter P, Gorman C, Shepard HM. Differential responses of human tumor cell lines to anti-p185HER2 monoclonal antibodies. Cancer Immunol Immunother (CII) 1993;37(4):255–263. doi: 10.1007/BF01518520. [DOI] [PMC free article] [PubMed] [Google Scholar]
- 31.Whisenant JG, McIntyre JO, Peterson TE, Kang H, Sanchez V, Manning HC, Arteaga CL, Yankeelov TE. Utility of [F]FLT-PET to assess treatment response in trastuzumab-resis-tant and trastuzumab-sensitive HER2-overexpressing human breast cancer xenografts. Mol Imaging Biol (MIB) 2014;17(1):119–128. doi: 10.1007/s11307-014-0770-z. [DOI] [PMC free article] [PubMed] [Google Scholar]
- 32.Neve RM, Chin K, Fridlyand J, Yeh J, Baehner FL, Fevr T, Clark L, Bayani N, Coppe JP, Tong F, Speed T, Spellman PT, DeVries S, Lapuk A, Wang NJ, Kuo WL, Stilwell JL, Pinkel D, Albertson DG, Waldman FM, McCormick F, Dickson RB, Johnson MD, Lippman M, Ethier S, Gazdar A, Gray JW. A collection of breast cancer cell lines for the study of functionally distinct cancer subtypes. Cancer Cell. 2006;10(6):515–527. doi: 10.1016/j.ccr.2006.10.008. [DOI] [PMC free article] [PubMed] [Google Scholar]
- 33.Whisenant JG, Sorace AG, McIntyre JO, Kang H, Sanchez V, Loveless ME, Yankeelov TE. Evaluating treatment response using DW-MRI and DCE-MRI in trastuzumab responsive and resistant HER2-overexpressing human breast cancer xenografts. Transl Oncol. 2014;7(6):768–779. doi: 10.1016/j.tranon.2014.09.011. [DOI] [PMC free article] [PubMed] [Google Scholar]
- 34.Hurley J, Doliny P, Reis I, Silva O, Gomez-Fernandez C, Velez P, Pauletti G, Powell JE, Pegram MD, Slamon DJ. Doc-etaxel, cisplatin, and trastuzumab as primary systemic therapy for human epidermal growth factor receptor 2-positive locally advanced breast cancer. J Clin Oncol. 2006;24(12):1831–1838. doi: 10.1200/JCO.2005.02.8886. [DOI] [PubMed] [Google Scholar]
- 35.Romond EH, Perez EA, Bryant J, Suman VJ, Geyer CE, Jr, Davidson NE, Tan-Chiu E, Martino S, Paik S, Kaufman PA, Swain SM, Pisansky TM, Fehrenbacher L, Kutteh LA, Vogel VG, Visscher DW, Yothers G, Jenkins RB, Brown AM, Dakhil SR, Mamounas EP, Lingle WL, Klein PM, Ingle JN, Wolmark N. Trastuzumab plus adjuvant chemotherapy for operable HER2-positive breast cancer. N Engl J Med. 2005;353(16):1673–1684. doi: 10.1056/NEJMoa052122. [DOI] [PubMed] [Google Scholar]
- 36.Tofts PS, Brix G, Buckley DL, Evelhoch JL, Henderson E, Knopp MV, Larsson HB, Lee TY, Mayr NA, Parker GJ, Port RE, Taylor J, Weisskoff RM. Estimating kinetic parameters from dynamic contrast-enhanced T(1)-weighted MRI of a diffusible tracer: standardized quantities and symbols. J Magn Reson Imaging (JMRI) 1999;10(3):223–232. doi: 10.1002/(sici)1522-2586(199909)10:3<223::aid-jmri2>3.0.co;2-s. [DOI] [PubMed] [Google Scholar]
- 37.Daldrup H, Shames DM, Wendland M, Okuhata Y, Link TM, Rosenau W, Lu Y, Brasch RC. Correlation of dynamic contrast-enhanced magnetic resonance imaging with histologic tumor grade: comparison of macromolecular and small-molecular contrast media. Pediatr Radiol. 1998;28(2):67–78. doi: 10.1007/s002470050296. [DOI] [PubMed] [Google Scholar]
- 38.de Lussanet QG, Beets-Tan RG, Backes WH, van der Schaft DW, van Engelshoven JM, Mayo KH, Griffioen AW. Dynamic contrast-enhanced magnetic resonance imaging at 1.5 Tesla with gadopentetate dimeglumine to assess the angiostatic effects of anginex in mice. Eur J Cancer. 2004;40(8):1262–1268. doi: 10.1016/j.ejca.2004.01.020. [DOI] [PubMed] [Google Scholar]
- 39.Vangestel C, Van de Wiele C, Van Damme N, Staelens S, Pau-wels P, Reutelingsperger CP, Peeters M. (99)mTc-(CO)(3) His-annexin A5 micro-SPECT demonstrates increased cell death by irinotecan during the vascular normalization window caused by bevacizumab. J Nucl Med. 2011;52(11):1786–1794. doi: 10.2967/jnumed.111.092650. [DOI] [PubMed] [Google Scholar]
- 40.Ahmed S, Sami A, Xiang J. HER2-directed therapy: current treatment options for HER2-positive breast cancer. Breast Cancer. 2015;22(2):101–116. doi: 10.1007/s12282-015-0587-x. [DOI] [PubMed] [Google Scholar]
- 41.Heyerdahl H, Roe K, Brevik EM, Dahle J. Modifications in dynamic contrast-enhanced magnetic resonance imaging parameters after alpha-particle-emitting (2)(2)(7)Th-trastuzumab therapy of HER2-expressing ovarian cancer xenografts. Int J Radiat Oncol Biol Phys. 2013;87(1):153–159. doi: 10.1016/j.ijrobp.2013.04.052. [DOI] [PubMed] [Google Scholar]
- 42.McCormack DR, Walsh AJ, Sit W, Arteaga CL, Chen J, Cook RS, Skala MC. In vivo hyperspectral imaging of microvessel response to trastuzumab treatment in breast cancer xenografts. Biomed Opt Express. 2014;5(7):2247–2261. doi: 10.1364/BOE.5.002247. [DOI] [PMC free article] [PubMed] [Google Scholar]
- 43.Le XF, Mao W, Lu C, Thornton A, Heymach JV, Sood AK, Bast RC., Jr Specific blockade of VEGF and HER2 pathways results in greater growth inhibition of breast cancer xenografts that overexpress HER2. Cell Cycle. 2008;7(23):3747–3758. doi: 10.4161/cc.7.23.7212. [DOI] [PMC free article] [PubMed] [Google Scholar]
Associated Data
This section collects any data citations, data availability statements, or supplementary materials included in this article.


