Significance
The self-assembly of normally soluble proteins into fibrillar amyloid structures is associated with a range of neurodegenerative disorders. Here, we monitor the fate of different forms of α-synuclein (AS), a protein implicated in Parkinson’s disease, via optical nanoscopy directly in neuronal cells. We show that exogenously added preformed AS fibrils elongate by the addition of endogenous AS, naturally present in neurons. In contrast, exogenously added monomeric AS induces aggregate formation within the cells and leads to apoptosis. The latter is significantly reduced by the addition of preformed fibrils, suggesting a neuroprotective role of fibrillar species. The visualization of these effects at the nanoscale shown here opens up new avenues for understanding the links between AS aggregation and neuronal toxicity.
Keywords: optical nanoscopy, seeding, neurodegenerative disease, prion-like behavior, α-synuclein
Abstract
New strategies for visualizing self-assembly processes at the nanoscale give deep insights into the molecular origins of disease. An example is the self-assembly of misfolded proteins into amyloid fibrils, which is related to a range of neurodegenerative disorders, such as Parkinson's and Alzheimer's diseases. Here, we probe the links between the mechanism of α-synuclein (AS) aggregation and its associated toxicity by using optical nanoscopy directly in a neuronal cell culture model of Parkinson’s disease. Using superresolution microscopy, we show that protein fibrils are taken up by neuronal cells and act as prion-like seeds for elongation reactions that both consume endogenous AS and suppress its de novo aggregation. When AS is internalized in its monomeric form, however, it nucleates and triggers the aggregation of endogenous AS, leading to apoptosis, although there are no detectable cross-reactions between externally added and endogenous protein species. Monomer-induced apoptosis can be reduced by pretreatment with seed fibrils, suggesting that partial consumption of the externally added or excess soluble AS can be significantly neuroprotective.
The proliferation of α-synuclein (AS) aggregates (1–6), including the existence of distinct “prion-like” strains (7, 8) as well as their spatial propagation throughout the brain (9), has been proposed to occur in the brains of patients suffering from Parkinson’s disease, but their links to pathology and to neuronal death have remained elusive (10–13). In this study, we use optical nanoscopy (14–18) to observe neurons directly and to assay AS internalization, as well as fibril-induced templating reactions involving endogenous AS at the molecular level. We further correlate this information with toxic phenotypes.
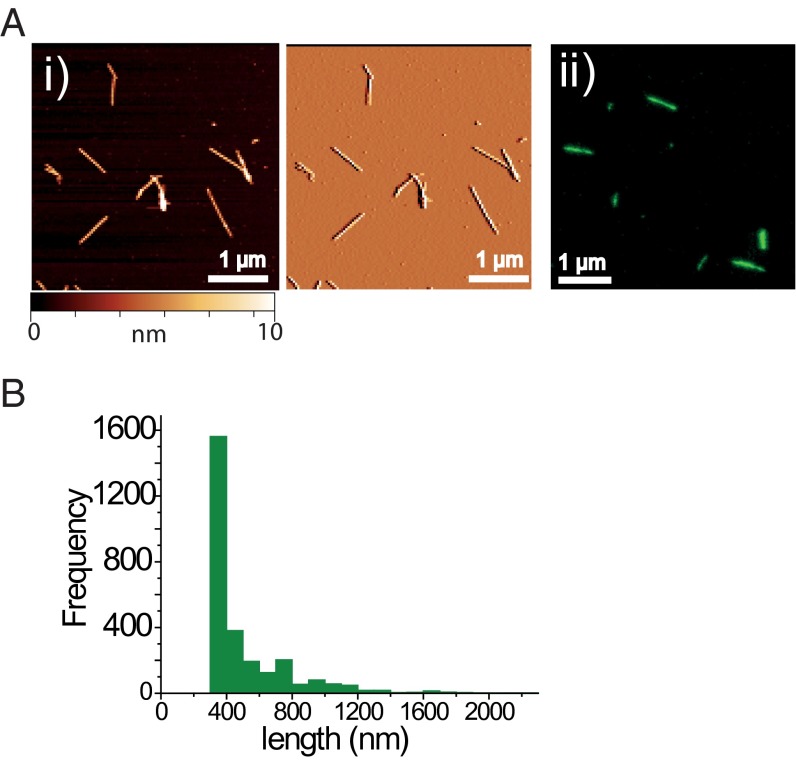
We have previously shown that the presence of AS short fibrils (seed fibrils or seeds) preformed in vitro (Materials and Methods and Fig. 1 and Fig. S1) favors elongation reactions over spontaneous nucleation (term used for seed-independent aggregation hereafter) in vitro (18). Furthermore, the seed fibrils were found to display highly inhomogeneous growth kinetics, with a significant fraction showing little or no growth at all (18). Here, we use two-color direct stochastic optical reconstruction microscopy (dSTORM), a superresolution imaging method (14), to investigate how such processes may be modified in the cellular environment. The results show the potential of this technique for studying the mechanisms of aggregation events in vivo and provide evidence for the neuroprotective role of reducing the concentration of free AS in the cellular environment.
Fig. 1.
(A, i) Atomic force microscopy (height and topographic profiles in Left and Middle panel, respectively) and (A, ii) dSTORM images of AS seed fibrils labeled with AF568, formed and imaged in vitro before addition to neuronal cell cultures. (B) Histogram depicting the length distribution of such seed fibrils, determined by dSTORM imaging.
Fig. S1.
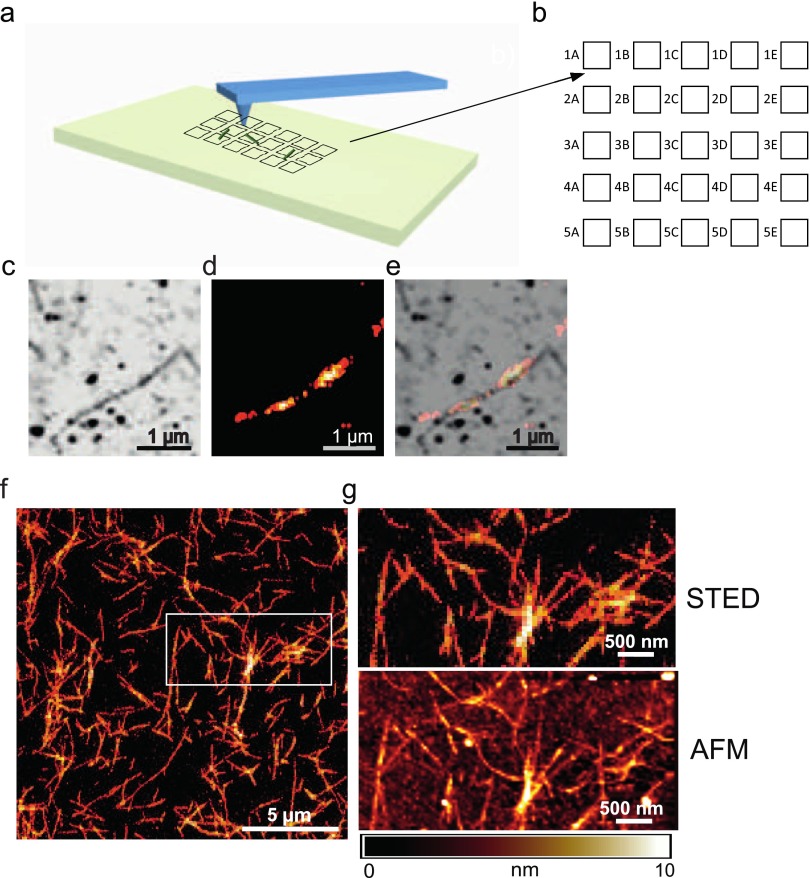
(A) Schematic representation of an AFM scanning tip and the nanopatterned quartz surface (depicted as black squares) with the deposited fibrils (shown as green cylinders). (B) Magnified image of the gold marker grid pattern produced via microfabrication on the quartz coverslip. (C) AFM image of an AS fibril. (D) Superresolved (dSTORM) image of the same AS fibril. (E) Overlay of both the dSTORM and AFM images. (F) Superresolution (STED) image of AS fibrils. A zoomed-in STED microscopy image of the region in F enclosed by the white square (G, Top) and the corresponding AFM image of the same area (G, Bottom) are shown.
Results and Discussion
Externally Added Seed Fibrils of AS Act as Templates for Exogenously Added Monomeric AS and Prevent Its Nucleation.
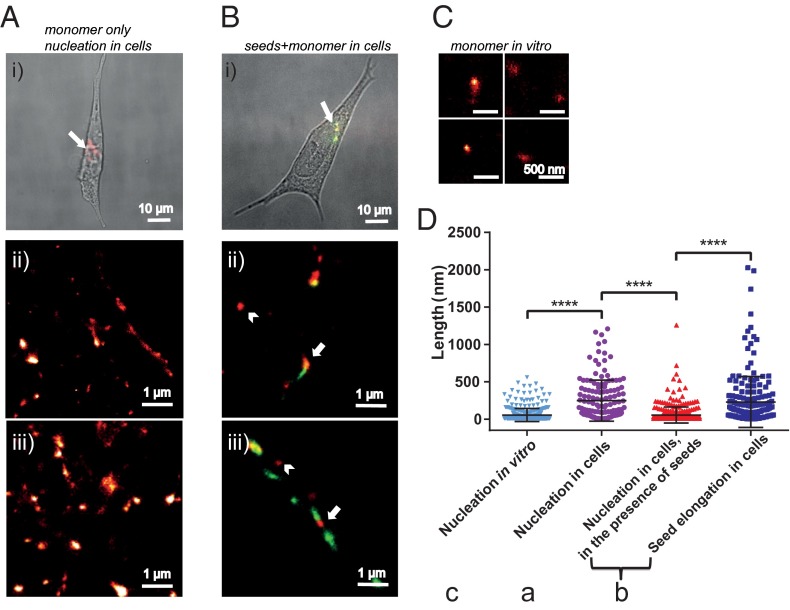
We first incubated neuronal cells with AS seed fibrils [50 nM, 5% covalently labeled with Alexa Fluor 568 (AF568), green] and AS monomers [500 nM, 10% covalently labeled with Alexa Fluor 647 (AF647), red], either each individually or both in sequence. Either seed fibrils and/or monomeric protein were taken up by cells within 1 h (Fig. S2). Two-color dSTORM imaging permitted us to distinguish between seed species and their subsequent elongation by monomer addition (details are provided in SI Materials and Methods). When cells were incubated with monomer only, we found that spontaneous aggregate formation by monomeric AS within cells occurs faster than in vitro (Fig. 2 A, C, and D), where aggregation proceeds slowly in the absence of mechanical agitation and/or surfaces that induce primary nucleation (19, 20). This observation suggests that within a cellular environment, catalytically active surfaces, such as lipid bilayers (20) or low pH in endosomes (21), enhance the nucleation rate of AS. In the presence of both monomers and seed fibrils, however (Fig. 2 B and D), elongation of the latter via monomer addition dominates over spontaneous formation of aggregates. Indeed, dSTORM experiments performed in SH-SY5Y cells show that the majority of added monomeric AS (red) is sequestered by the added AS seeds (green) (Fig. 2 B and D). In particular, Fig. 2D shows a comparison between the lengths of aggregates formed by nucleation of exogenously added monomeric protein when it is added together with seed fibrils (red triangles, indicated by arrowheads in Fig. 2 B, ii and iii) and the extent of seed elongation by exogenously added monomeric protein (dark blue squares, indicated by arrows in Fig. 2 B, ii and iii). To quantify seed fibril elongation by added monomeric AS, we analyzed the length distributions of the species observed in each of the two detection channels (red for monomer and green for seed fibrils) separately. We applied masks to imaged areas in which green and red signals colocalized and subsequently quantified the length of the red aggregates, which had elongated the seed fibrils. Similarly, to quantify the nucleation of added monomeric protein, we measured the length of the aggregates of the red channel, which did not colocalize with any green seed fibrils (details are provided in Materials and Methods). Due to the high spatial resolution of dSTORM imaging, we were able to distinguish between these two types of aggregation processes.
Fig. S2.
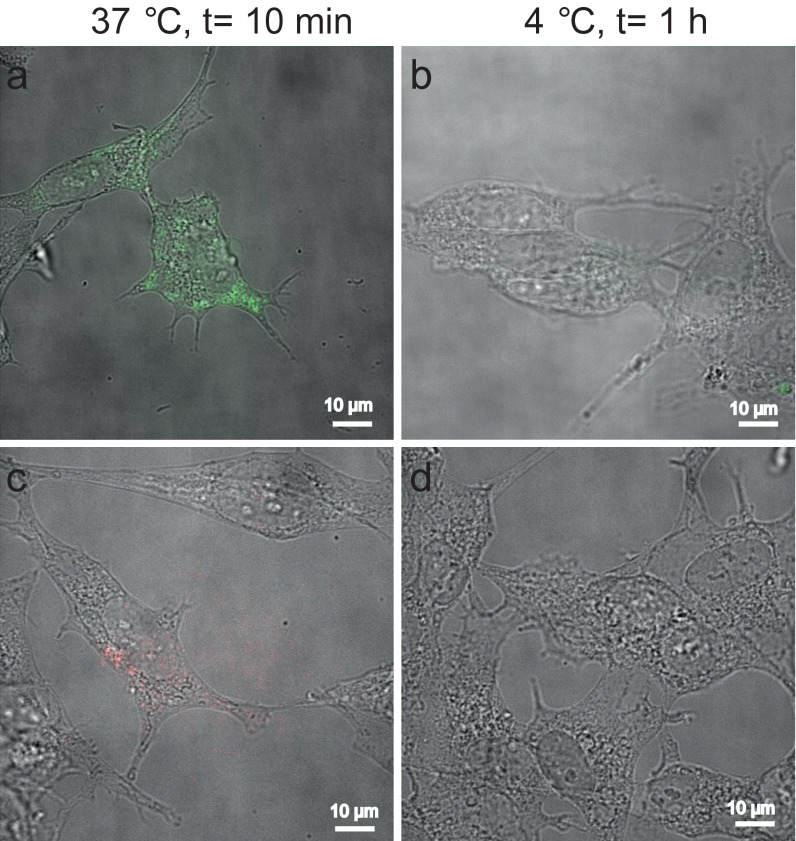
Overlaid differential interference contrast and conventional fluorescence images of SH-SY5Y cells treated with AF568-labeled AS seed fibrils (A and B) and AF647-labeled monomeric AS (C and D), after 10 min at 37 °C (A and C) and 1 h at 4 °C (B and D).
Fig. 2.
(A, i) Overlaid differential interference contrast and conventional fluorescence image of an SH-SY5Y cell treated for 1 h with AF647-labeled (red) AS monomer followed by 24 h of incubation in AS-free medium. (A, ii and iii) Zoomed-in dSTORM images showing the nucleation of monomeric AS inside neuronal cells, after incubation for 1 h followed by incubation for 24 h in AS-free medium. The image in A, ii corresponds to the aggregates in the area indicated by the white arrow in A, i. (B, i) Overlaid DIC and conventional fluorescence image of an SH-SY5Y cell treated for 1 h with AF568-labeled (green) AS seeds and then for 1 h with AF647-labeled (red) AS monomers followed by 24 h of incubation in AS-free medium. (B, ii and iii) Zoomed-in dSTORM images showing the seeds elongated by exogenously added monomeric AS, after 24 h of incubation in AS-free medium (red, indicated by arrows). The image in B, ii corresponds to fibrils in the area indicated by the white arrow in B, i. (C) dSTORM images of monomeric AS after 24 h of incubation in vitro: No aggregation is observed. (D) Quantification of the lengths of different AS species observed: monomeric AS after 24 h of incubation in vitro (light blue inverse triangles), aggregates formed of added monomeric AS after 24 h of incubation in cells that had been treated with monomeric AS only (purple circles), aggregates of added monomeric protein (AF647-labeled) in cells that do not colocalize with seeds after 24 h and indicated by an arrowhead in B, ii and iii (red triangles), and the extent of seed elongation by addition of monomeric protein (AF647-labeled) in cells treated consecutively with seeds and monomeric AS after 24 h and indicated by an arrow in B, ii and iii (dark blue squares). The statistical analysis was performed using one-way ANOVA: F(2,713) = 48.31 followed by a Tukey’s multiple comparison test (****P < 0.0001).
Seed Fibril Elongation Dominates over Nucleation of Endogenous AS.
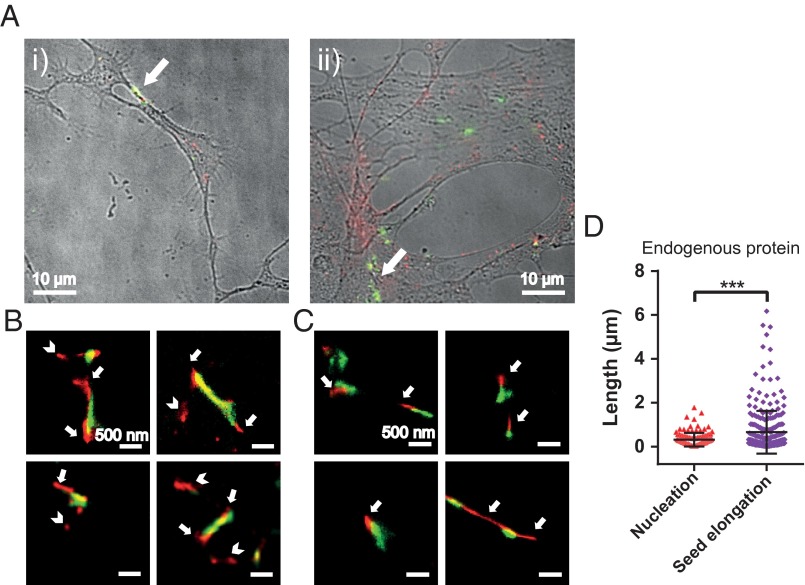
In a next step, we investigated whether or not exogenously added AS seed fibrils can be elongated by the endogenous AS present in dopaminergic neurons. We incubated both ventral-mesencephalic (VM) and SH-SY5Y cells with labeled AS seeds (50 nM, 5% covalently labeled with AF568, green) for 1 h before washing and incubating the cells in AS-free medium for 24 h. The neurons were then fixed and stained with primary antibodies (Abs) against endogenous AS for either VM or SH-SY5Y cells, followed by a secondary AF647-labeled Ab. The dSTORM images (Fig. 3) show that the exogenously added seed fibrils (green) are elongated through the addition of endogenous AS (red). We refer to the ensuing fibrillar species as heterofibrils (Fig. 3 B and C) in both VM and SH-SY5Y cells. Moreover, we have measured seed elongation by comparing the size of seed fibrils in vitro with fibrils that were present in cells after 24 h of incubation in AS-free medium (AFM) and transmission EM and have obtained similar results as described above using superresolution imaging (details are provided in SI Materials and Methods, Fig. S3).
Fig. 3.
(A, i and ii) Overlaid differential interference contrast and wide-field fluorescence images of VM cells treated for 1 h with AF568-labeled AS seed fibrils (green), incubated for 24 h in AS-free medium, and immunostained for endogenous AS with a secondary Ab tagged with AF647 (red). (B) Zoomed-in dSTORM images of heterofibrils formed of exogenous seeds (green) elongated by endogenous AS (red, indicated by arrows) in VM cells. The top two images correspond to fibrils located in the areas indicated by the white arrows in A. (Scale bars: 500 nm.) (C) Zoomed-in dSTORM images of heterofibrils formed of exogenous seeds (green) elongated by endogenous AS (red, indicated by arrows) in SH-SY5Y cells. (D) Quantification of the extent of seed elongation by endogenous AS, as indicated by arrows in B and C (Seed elongation), and of the size of aggregates consisting of endogenous AS only, as indicated by arrowheads in B (Nucleation). The statistical analysis was performed using an unpaired t test (***P < 0.001). The experiment was repeated eight times in SH-SY5Y cells and seven times in primary VM cell cultures, and for each experiment, at least eight randomly chosen areas on the glass coverslip were imaged.
Fig. S3.
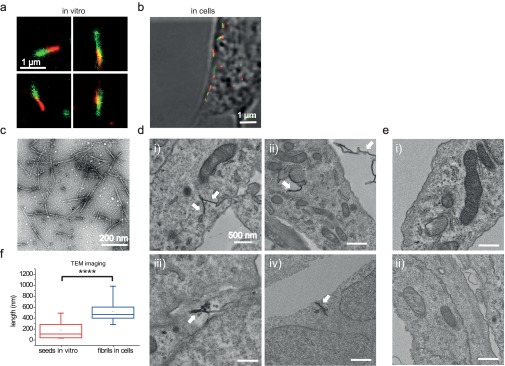
(A) Superresolution (dSTORM) images of seed fibrils elongated in vitro by the addition of monomeric protein. The concentrations used were 50 nM seeds (green) and 500 nM monomeric protein (red). (B) Overlay of the differential interference contrast and dSTORM images of seed fibrils (green) inside a neuroblastoma cell, which have elongated by the addition of monomeric protein (red), similar to the experiment shown in Fig. 2. The concentrations used were 50 nM seeds and 500 nM monomeric protein. (C) TEM image of the in vitro formed seed fibrils. (D) Representative TEM images of different cell sections showing fibrils (indicated by white arrows) inside the neuroblastoma cells after 24 h of incubation, obtained as described in Materials and Methods. (Scale bars: 500 nm.) (E) Representative TEM images of control sections of cells, to which no fibrils had been added. (Scale bars: 500 nm.) (F) Comparison of seed fibril lengths, measured from the TEM images, in vitro before addition to cells and of the fibrils imaged in cells after 24 h of incubation. The statistical analysis was performed using an unpaired t test (****P < 0.0001). The experiment was repeated twice, and, in total, 15 fibrils were analyzed in each case.
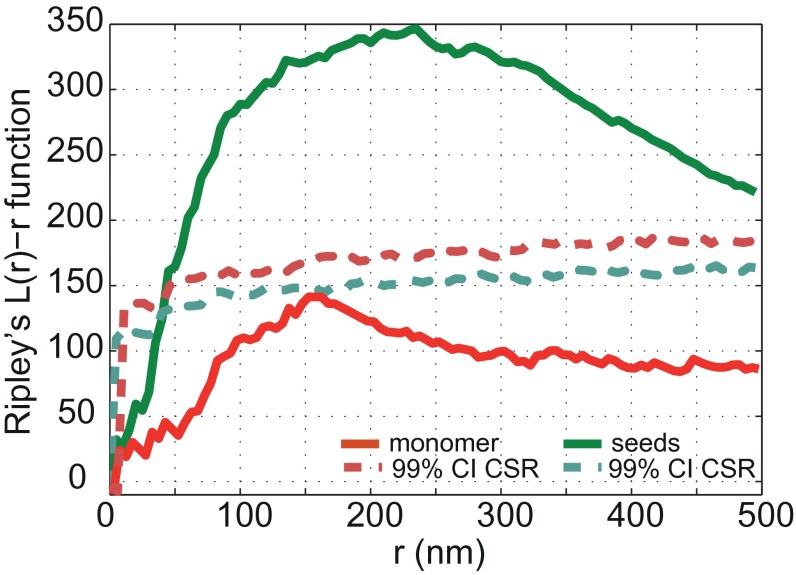
A comparison of the lengths of endogenous AS aggregates, which do not colocalize with seeds, and must therefore have formed by spontaneous nucleation (Nucleation in Fig. 3D), with those from AS aggregates that form the elongated segment of the added seed fibrils, giving rise to heterofibrils (Seed elongation in Fig. 3D), demonstrates that endogenous AS is preferentially recruited to elongate exogenous seeds rather than undergoing nucleation. The analysis of the length distributions for seed elongation and monomer nucleation was performed in a similar fashion as described earlier for seeded elongation by exogenously added monomer (SI Materials and Methods). In order to examine the likelihood of random colocalization between objects in the red and green channels, we performed a quantitative coclustering analysis using Ripley’s K function (SI Materials and Methods). The results in Fig. S4 show that there is no random colocalization between seed fibrils and monomeric protein. On the contrary, there is a clear positive correlation between seeds and addition of monomer, suggesting that seed fibrils grow by elongation reactions.
Fig. S4.
Plots of the L(r) − r function derived from the Ripley’s K function. The green solid line corresponds to exogenously added seed fibrils elongated by endogenous monomeric AS. The red solid line corresponds to exogenously added monomeric AS interacting with endogenous AS. The dashed lines represent the upper bounds of the 99% CI. In the case of the seed fibrils, the L(r) − r function exceeds the 99% CI bound in a large spatial range (50–500 nm), indicating a statistically significant coclustering (with a CI > 99%). Such is not the case for the added monomer (red curve). The 99% CIs were obtained from 10,000 simulations of CSR distribution.
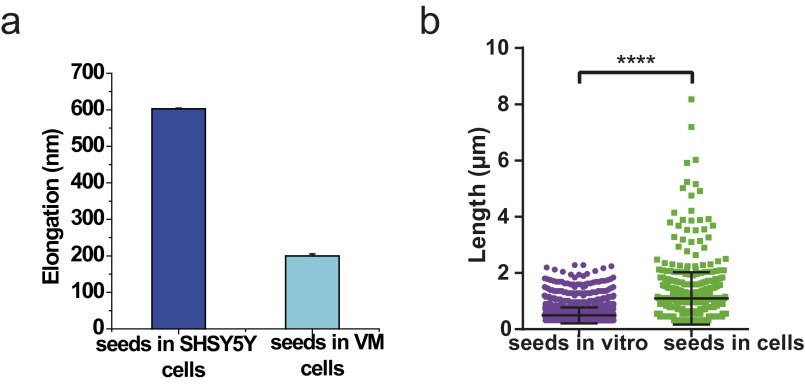
Furthermore, we found that neither of the primary Abs used displayed significant cross-reactivity with the labeled AS added exogenously. We compared the length of heterofibrils formed in cells with the length of the initial AF568-labeled seed fibrils measured in vitro by staining the latter with the same primary and secondary Abs as used in cells (Fig. S5). The average length of the heterofibrils in cells was significantly greater than the average length of the initial seed fibrils. Overall, these data suggest that, in neurons, the rate of monomer addition to a preformed seed fibril is significantly faster than the rate of spontaneous nucleation, for both exogenously added and endogenous monomeric protein.
Fig. S5.
(A) Comparison of seed fibril elongation by endogenous protein in SH-SY5Y and VM cells. As a control, seed fibrils in vitro were labeled with AF568 and immunostained with the Abs used for either SH-SY5Y or VM cells. The average length of the seeds immunostained in vitro was quantified and taken as a baseline. (B) Quantification of the length of seeds immunostained in vitro and in SH-SY5Y cells, obtained by dSTORM. The statistical analysis was performed using an unpaired t test (****P < 0.0001). The experiment was repeated twice.
Monomeric, but Not Fibrillar AS, Added Exogenously to Neurons Induces Apoptosis After 72 H.
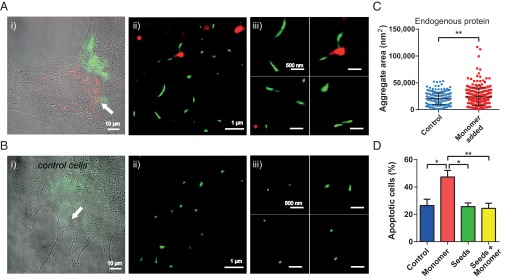
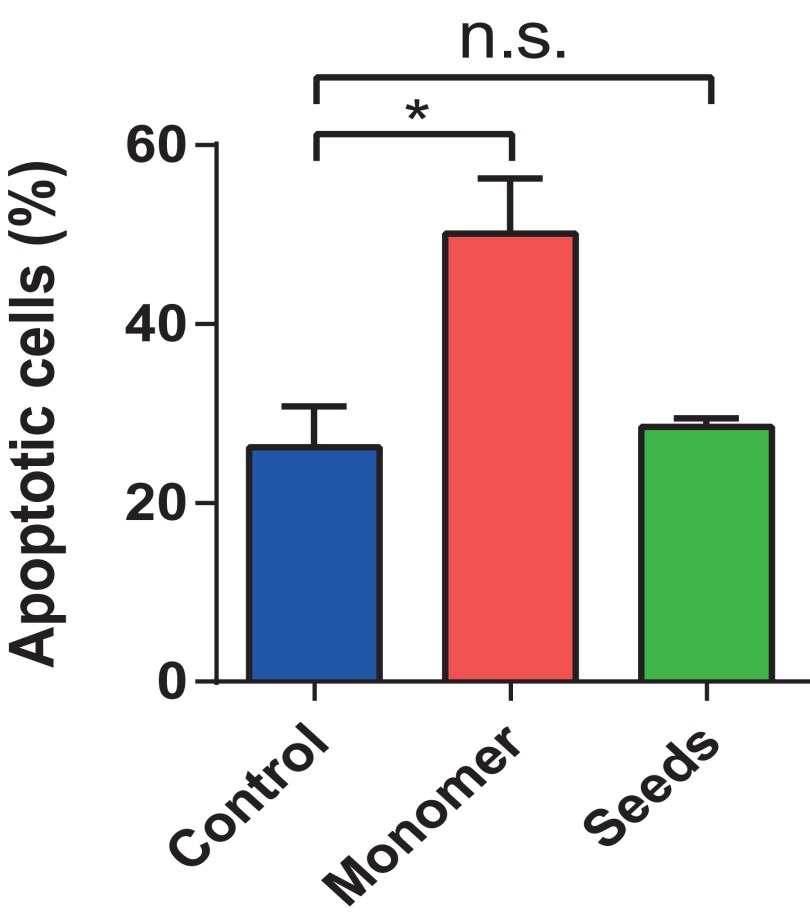
Many studies have recently shown that smaller, oligomeric species of AS, rather than mature fibrils, induce toxicity (12, 13, 22–24). Here, we addressed directly whether or not seed fibrils that are capable of seeding endogenous AS can induce toxicity in neuronal cells, as some reports have suggested (8, 25, 26). Using an apoptosis detection assay (Fig. 4D and Figs. S6 and S7) we show that adding unlabeled seed fibrils (either 50 nM or 500 nM) to neurons does not lead to significantly increased cell death within 72 h of incubation in AS-free medium in comparison to untreated control neurons. In contrast, we find that the addition of unlabeled monomeric AS (500 nM) leads to significantly increased levels of apoptosis in VM cells under similar experimental conditions (Fig. 4D and Figs. S6 and S7), confirming reports that correlate increased levels of AS with disease pathology (27, 28).
Fig. 4.
(A, i and B, i) Overlaid differential interference contrast and wide-field fluorescence images of VM cells immunostained for endogenous AS using a secondary Ab tagged with AF568 (green), either treated for 1 h with monomeric AS labeled with AF647 (red), followed by a 24-h incubation in AS-free medium (A), or untreated (B). (A, ii and B, ii) Zoomed-in dSTORM images in the areas indicated by white arrows. (A, iii and B, iii) Zoomed-in dSTORM images of aggregates of the endogenous AS species (green) in both treated (A) and control (B) cells. (Scale bars: 500 nm.) (C) Size distribution of endogenous AS species formed in control cells compared with cells treated with monomeric AS. The statistical analysis was performed using an unpaired t test (**P < 0.01). The experiment was repeated seven times, and 10 randomly chosen areas were imaged each time. (D) Percentage of apoptotic cells in control cells (blue), cells treated with monomer only (red), cells treated with seeds only (green), and cells treated consecutively with seeds and monomer (yellow). The statistical analysis was performed using repeated measures ANOVA: F(3,12) = 7.198 followed by a Tukey’s multiple comparison test (*P < 0.05; **P < 0.01). The experiment was repeated four times, and two samples per condition were analyzed each time.
Fig. S6.
Fluorescence images of the nuclei of VM cells treated with the Hoechst 33342 stain, marking apoptotic cell death. Control cells (A), cells to which monomeric AS was added (B), cells to which AS seed fibrils were added (C), and cells that had been treated consecutively with AS seed fibrils and monomeric AS (D) are shown. In all cases, the cells were imaged after 72 h of incubation in AS-free medium, following the treatment protocol described in the Materials and Methods.
Fig. S7.
Percentage of apoptotic cells in control cells (blue), cells treated with monomer only (red) at a concentration of 500 nM, and cells treated with seeds only (green) at a concentration of 500 nM. The statistical analysis was performed using two-way ANOVA: F(2,3) = 17.36, followed by a Tukey’s multiple comparison test (*P < 0.05). The experiment was repeated four times. n.s., not significant.
Exogenously Added Monomeric AS Triggers the Nucleation of Endogenous AS.
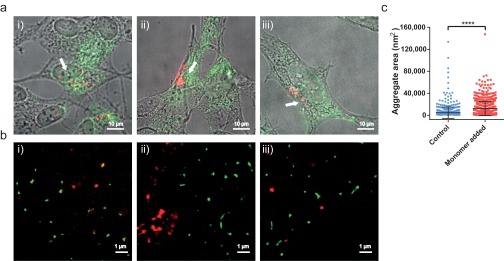
To test whether or not exogenous monomeric AS induces toxicity via coaggregation with endogenous AS, we added monomeric AF647-labeled AS (500 nM, 10% covalently labeled with AF647, red) to VM cells in the absence of seed fibrils. Using the same protocol as described above for the detection of heterofibrils in VM and SH-SY5Y cells, we observed that aggregates of endogenous AS were formed throughout the cell, even in areas that were not in close proximity to incorporated exogenous protein. Moreover, dSTORM imaging revealed that the mean area of endogenous AS particles (stained with a primary Ab and a secondary Ab conjugated with AF568, green) formed in the presence of exogenously added monomer was significantly higher than the mean area of endogenous AS species present in control cells that had not been treated with exogenous AS monomers (Fig. 4C). It thus appears that the endocytosed exogenous monomer triggers the aggregation of endogenous AS (Fig. 4 A, iii) without the two moieties necessarily coming into direct contact. Similar results were obtained for SH-SY5Y cells (Fig. S8). However, as we have previously shown in Fig. 2, exogenously added monomeric AS self-nucleates and forms small aggregates inside the cells. It therefore remains to be determined whether or not the exogenously added monomeric protein, upon formation of small aggregates, can indirectly trigger endogenous AS nucleation via other mechanisms, such as cell stress or the production of oxidative species, or through a general loss of protein homeostasis. Overall, these findings therefore link the aggregation of endogenous AS induced indirectly by exogenous monomer with an increased toxicity.
Fig. S8.
(A) Overlaid DIC and wide-field fluorescence images of SH-SY5Y cells treated for 1 h with monomeric AS (labeled with AF647, red), followed by 24 h of incubation in AS-free medium, and immunostained against endogenous AS (labeled with AF568, green). (B) dSTORM images of aggregates in areas indicated by the white arrows in A, showing aggregation of the endogenous AS. (C) Quantification of the sizes of aggregates formed by endogenous AS in control cells compared with cells treated with monomeric AS. A statistical analysis was performed using an unpaired t test (****P < 0.0001). The experiment was repeated eight times in SH-SY5Y cells, and for each 10 randomly chosen areas were imaged each time.
Endocytosed Monomeric AS Has a Reduced Propensity to Seed Endogenous Compared with Preformed AS Fibrils.
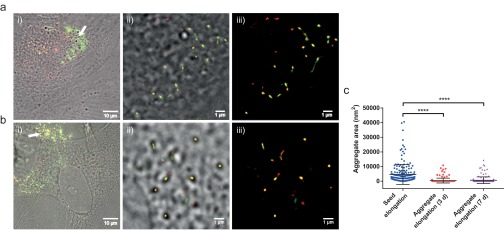
Having established that seed fibrils can elongate via addition of monomeric AS, both externally added and endogenous, we investigated the growth propensity of aggregates formed by endocytosed monomeric protein. We find that these aggregates have a reduced propensity to seed endogenous AS relative to preformed AS seed fibrils. Indeed, in previous experiments performed in vitro (18), we observed a high level of heterogeneity in the elongation rates for individual AS fibrils within a given population. We thus hypothesized that aggregates formed of endogenous AS upon addition of exogenous monomer might correspond to nonfibrillar structures or fibrillar populations with low seeding propensity. To test this idea, we treated VM cells for 1 h with AF647-labeled monomeric AS (red), incubated them in AS-free medium for either 3 or 7 days, and then incubated them for 1 h in medium containing monomeric AF568-labeled AS (green). This procedure was followed by a 24-h incubation period in AS-free medium (details are provided in SI Materials and Methods). Subsequent dSTORM imaging (Fig. S9 A and B) reveals little growth of AF647-labeled AS aggregates via addition of AF568-labeled monomer, despite the two being clearly colocalized. Most of the aggregates appear globular, with only a few featuring elongated, fibrillar shapes. Taken together with the in vitro data reported earlier, these findings are consistent with the concept of amyloid fibril structural polymorphism (5, 29) (i.e., that aggregates of the same peptide can exhibit a variety of conformational structures). This observation is interesting in light of recent reports demonstrating that fibrillar mouse explants do not induce seeding in all cases in nontransgenic mice (30) and in other animal models of disease (31–33). Furthermore, our results indicate that in addition to fibrillar AS species, soluble AS can readily aggregate following uptake by cells, a conclusion similar to the conclusion drawn from experiments with Tau in a cellular model of Alzheimer’s disease (21).
Fig. S9.
(A, i and B, i) Overlaid DIC and wide-field fluorescence images of VM cells to which two different colors of monomeric AS had been added consecutively (first AF647-labeled and then AF568-labeled) for 1 h each and separated by a 3-d (A) or 7-d (B) incubation period in AS-free medium. Images were taken 24 h after AF568-tagged monomer had been added. (A, ii and B, ii) Overlay of zoomed-in two-color dSTORM images and corresponding DIC images of areas indicated by the white arrows in A, i and B, i. (A, iii and B, iii) Zoomed-in dSTORM images reveal AS species that contain both colors. (C) Quantification of aggregate elongation by AF568-labeled monomeric protein for the three different treatments: seed fibrils added to cells (blue circles) as in Fig. 2D (for reference), AF647-labeled aggregates formed after 3 d of incubation (red squares), and AF647-labeled aggregates formed after 7 d of incubation (purple triangles). The statistical analysis was performed using one-way ANOVA: F(2,532) = 53.03. Tukey’s multiple comparison test (****P < 0.0001). The experiment was repeated twice, and for each 10 randomly chosen areas were imaged.
Apoptosis Can Be Counteracted by the Addition of Seed Fibrils Before Exposure to Monomeric AS.
In a final set of experiments, we found that upon preincubation of neurons with seed fibrils for 1 h before the addition of monomeric AS, apoptosis was reduced to the levels observed in control cells (Fig. 4D). These results indicate a direct correlation between the nucleation of endogenous AS and apoptosis when exogenous monomeric AS is added to neurons alone, but not when seed fibrils are also present. It appears likely that free monomeric AS is rapidly sequestered by the added seed fibrils, thus reducing the levels of soluble protein and decreasing the propensity for de novo formation of aggregates. The process of transmission of toxicity-inducing species from cell to cell thus appears to be potentially more complex than the simple transmission of fibrillar aggregates.
In conclusion, we have established a nanoscopic assay to track aggregation processes directly in neuronal cells, which provides for a powerful tool to probe the links between specific mechanisms of AS amyloid fibril self-assembly and toxicity. In particular, we have shown that exogenously added fibrils can seed endogenous AS and that subsequent elongation of seed fibrils dominates over nucleation of endogenous AS. Moreover, exogenously added monomeric AS triggers aggregation of endogenous AS, and monomeric, but not fibrillar, AS added exogenously to neurons induces apoptosis. The latter effect, however, can be counteracted by the addition of seed fibrils before exposure to monomeric AS, which may prevent the formation of small toxic species by reducing the excess monomeric protein pool. Taken together, our data suggest that the level of soluble AS is crucial to the development of AS pathology and that the relative concentrations of the different forms of AS are likely to play a key role in the spreading of disease.
SI Materials and Methods
Protein Labeling and Seed Fibril Preparation.
Monomeric AS (N122C variant) was labeled at residue 122 with either maleimide-modified AF647 or AF568 dye (Life Technologies) via a Cys thiol moiety. The protein was separated from free dye molecules with a Superdex 200 Increase 10/300 GL size exclusion column (GE Healthcare). We have verified by atomic force microscopy (AFM) and thioflavin T kinetic assays that the addition of a fluorophore at this position has no influence on the kinetics of the conversion of monomeric protein into amyloid fibrils and on the morphology of ensuing structures. Full details on the labeling protocol and its validation are described by Pinotsi et al. (18).
We first produced unlabeled AS amyloid fibrils by incubating 500-μL solutions of WT human AS at 600 μM [in 20 mM phosphate buffer (PB) at pH 6.5] for 48 h at 45 °C and under strong stirring with a Teflon-coated stir bar on a basic heat plate (IKA). AF568-labeled seed fibrils were prepared as follows. The unlabeled amyloid fibrils produced previously were first diluted to 30 μM and sonicated for 30 s. Subsequently, this sample was incubated with 80 μM unlabeled monomeric AS and 3.6 μM AF568-labeled monomeric AS (in PB at pH 6.5) with 0.01% sodium azide at 37 °C under stirring for 48 h until all of the monomeric protein was consumed. Unlabeled seed fibrils were prepared in the same way but without the addition of labeled monomeric AS.
Primary Neuronal Cultures.
VM neurons were dissected from E14 Sprague–Dawley rat embryos (Charles River UK). The cells were incubated in 0.1% trypsin (Worthington Biochemical Corporation) and 0.05% DNase (Sigma) in DMEM (Sigma) for 20 min at 37 °C, washed four times with 0.05% DNase in DMEM, transferred to 10% (vol/vol) FBS in DMEM, and triturated. Neurons were seeded at 100,000 cells per well in LabTek chambered coverglasses (Nunc, Thermo Scientific) previously coated with poly-l-lysine (Sigma). Neurons were cultured for 2 wk before experiments were carried out.
Neuroblastoma Cell Culture.
SH-SY5Y human neuroblastoma cells were obtained from LGC standards (Teddington, UK). Cells were maintained on 1:1 MEM (Sigma): nutrient mixture F12 Ham (Sigma), 15% (vol/vol) FBS (Life Technologies), 1% l-glutamine (Sigma), 1% MEM nonessential amino acids (Sigma), and 1% antibiotic-antimycotic (10,000 units of penicillin, 10,000 μg of streptomycin, and 25 μg of amphotericin B; Life Technologies). Cells were plated at 10,000 cells per well in LabTek chambered coverglasses.
Cell Treatment and dSTORM Imaging of Cell Cultures.
All incubations with AS fibrils or monomeric protein were carried out by replacing the FBS with 2% (vol/vol) B27 complement (Life Technologies). All incubations of cells with fibrils were performed at 50 or 500 nM final concentration of fibrils labeled with AF568 (1:20 labeled/unlabeled ratio) or with 500 nM monomeric protein labeled with AF647 (1:10 labeled/unlabeled ratio). Treatment of cells was always performed for 1 h at 37 °C, followed by washing the cells twice with growth medium. Subsequently, the cells were incubated in AS-free medium for either 24 h or 72 h. All incubations were done at 37 °C, unless otherwise stated. The uptake of both monomeric and fibrillar AS that was added to the extracellular medium of SH-SY5Y or primary VM cells occurred within 10 min at 37 °C, whereas no uptake was observed for both species after 1 h of incubation at 4 °C (Fig. S2). Photoswitching buffer, as described below for superresolution imaging, was added to the cells before dSTORM imaging. The samples were imaged by both differential interference contrast and fluorescence microscopy to localize the position of the aggregates present inside cells.
Immunofluorescence.
Cells were fixed in 4% formaldehyde (Sigma), permeabilized with 0.05% (vol/vol) Tween-20, and immunostained with the following Abs: monoclonal mouse Ab LB509 (Life Technologies) for SH-SY5Y cells; monoclonal rabbit Ab (D37A6) XP (Cell Signaling Technology, Inc.), which is specific to rat AS (present in VM cells); and AF647 or AF568 secondary Abs (both from Life Technologies).
Toxicity Assays.
Both treated and control VM or SH-SY5Y cells were stained for 5 min with 0.5 mg/mL Hoechst 33342 stain (Sigma), as described by Pöltl et al. (34). The cells were treated as follows. Fifty or 500 nM unlabeled fibrils or 500 nM unlabeled monomeric AS was added to the extracellular medium of VM cells. After 1 h of incubation, we washed the extracellular medium twice and then continued the incubation for 72 h in AS-free medium. Images from randomly selected fields were taken, and the number of nuclei displaying condensed chromatin was counted in a blind manner. Data from >25 cells were analyzed each time from at least two different wells. The experiment was repeated four times, and two repeats for each condition were performed each time.
Superresolution Fluorescence Microscopy by Single-Molecule Localization and dSTORM Imaging.
Superresolution imaging in vitro and in cells was performed using a dSTORM microscopy setup based on a Nikon Eclipse TE 300 inverted wide-field microscope and a 100×, 1.49-N.A. total internal reflection fluorescence (TIRF) objective lens (Nikon, UK Ltd.) as described by Pinotsi et al. (18). Imaging was performed in a highly inclined (HiLo) illumination mode (35) to image deeper into the region above the coverslip (to ca. 5 μm) than possible with TIRF, and thus inside the cells. The field of view imaged covered 128 × 128 camera pixels, corresponding to an area on the sample of ∼20 × 20 μm2. For two-color superresolution imaging, the two channels were imaged sequentially and then merged using image processing software. Typically, 10,000 fluorescence frames with an exposure time of 10 ms were recorded; the exposure time was matched to the average “on” time of the fluorescent dyes. From each image stack, a reconstructed dSTORM image was generated by using the open-source rainSTORM software developed in-house (36) written in MATLAB (The MathWorks, Inc.).
Image Analysis.
Data image analysis and analysis of the aggregate sizes from different samples were performed using ImageJ (NIH). All seeding experiments were repeated eight times in SH-SY5Y cells and seven times in primary VM cell cultures; for each experiment, at least eight randomly chosen areas were imaged. In total, more than 100 cells per condition were analyzed. The length distributions were extracted with a MATLAB code written in-house, which was based on segmenting the objects in each channel separately, intensity thresholding, and measuring the end-to-end distances for each individual object. To quantify seed elongation, we first applied masks to areas in which green and red signals coclustered, and we subsequently quantified the length of the red aggregates, which depicts elongation. Similarly, to quantify the nucleation of added monomeric protein, we measured the length of aggregates in the red channel that did not colocalize with any green seed fibrils. The statistical analysis was performed in all repeats using Prism (GraphPad Software, Inc.) with either an unpaired t test or repeated measures ANOVA, followed by a Tukey’s multiple comparison test. Only structures resolved at a resolution better than the threshold of the experiment (i.e., better than 30 nm) were included in the analysis.
Coclustering Analysis of dSTORM Data.
To test our two-color dSTORM data for statistically significant coclustering, a clustering algorithm based on Ripley’s K function was developed. All routines were implemented in MATLAB. Briefly, dSTORM images were segmented by Otsu thresholding, and the center of mass of each object was then determined. The coordinates of the center of mass of each object were then used to compute the bivariate Ripley’s K function (37) to evaluate coclustering.
The bivariate Ripley’s K function is defined as follows:
D is the average density of objects per unit area in the image (D = N/A), A is the size of the area considered, N is the number of points from the first channel contained in this area, and M is the total number of points in the second channel in the same area. δij is equal to 1 if the distance between object i and j is shorter than r; otherwise, it is equal to 0. This function gives a measure of the average number of points j contained within concentric circles of radius r, centered on each point i.
The L(r) − r function is then defined as follows:
For complete spatial random (CSR) distribution, L(r) − r = 0 for all values of r. Therefore, if L(r) − r > 0, then there is clustering at the spatial scale r.
The average density was obtained for each image by segmenting the area in the dSTORM image containing the objects. The edge effect was corrected for by excluding the objects that were closer to the edge of the images than the analysis window (here, 500 nm) from the analysis.
The confidence intervals (CIs) were obtained by generating N = 10,000 sets of spatially randomly distributed objects (CSR distribution) with the same average density as the experimental dataset and computing their corresponding L(r) − r functions. These curves were distributed around the horizontal axis, as expected for a random distribution. The confidence-bound limits were then estimated from the sorted values by taking the order statistics N (1 − p/2), where p is the given type 1 error (set to 1% here; hence, a 99% CI). Therefore, an L(r) − r curve exceeding the 99% CI will have a probability lower than 1% to have originated from a random distribution.
Correlative AFM Imaging.
AFM was used to obtain correlative information on the structure of the elongated fibrils imaged using superresolution microscopy. Correlative AFM/dSTORM imaging on the same fibrils was achieved by using quartz slides (UQG Optics Ltd.) with a lithographic gold pattern using alignment markers and fabricated in-house similar to the protocol described by Duim et al. (17). The alignment markers were fabricated using optical lithography, followed by gold deposition and lift-off, and were undertaken at the Nanoscience Centre of the University of Cambridge.
AFM images were acquired using a VEECO Dimension 3100 atomic force microscope (Bruker AXS). The instrument was operated in tapping mode in air using silicon cantilevers with a resonance frequency of 300 kHz, a spring constant of 40 N/m, and a tip radius of 10 nm (Cantilever RTESP; Bruker AXS). Images were collected at a scan rate of 1 Hz. In standard AFM imaging, 5 μL of each fibrillar sample was deposited onto freshly cleaved mica surfaces for 2 h for adsorption. The samples were rinsed with 200 μL of Milli-Q water (Sigma Aldrich) five times and left to dry completely in air before imaging.
For correlative imaging of fibrils on quartz surfaces, the sample was imaged using dSTORM in TIRF mode. The quartz slide was then glued to the bottom of a well with silicon glue (Exaktosil N15 silicone duplicating material; A&B), which could be removed upon drying. Photoswitching buffer was added in the well to enable imaging with dSTORM. Each fibril position on the gold grid was noted. Subsequently, the quartz slide with the fibrils adsorbed onto the surface was removed from the well, cleaned with Milli-Q water, and dried using a nitrogen gun. After cleaning, the quartz slide was transferred to the AFM setup and the aggregate structures at the noted locations were found and imaged in tapping mode.
For the correlative stimulated emission depletion (STED)/AFM imaging in liquid, we used a home-built STED microscope, as described by Mahou et al. (38). The superresolution microscope was equipped with a platform specially designed for performing AFM on an inverted optical frame (BioScope Catalyst; Bruker AXS). Typically, labeled fibrils were first quickly located using STED microscopy over field of views of ∼80 × 80 μm2. The excitation wavelength was 640 nm and the depletion wavelength was 765 nm to excite the AF647 dye. Then, AFM data were acquired in a selected area of interest, defined within the optical field of view. To ensure good correlation between the STED and AFM data, we used a calibration protocol before each imaging session. STED images were collected with a pixel size of 20 nm and a pixel dwell time of 30 μs. AFM data were acquired using the peak force tapping mode with silicon cantilevers with a resonance frequency of 300 kHz, a spring constant of 40 N/m, and a tip radius of 10 nm (Cantilever RTESP). The images were acquired at a scan rate of 1 Hz with a peak force set point of 1 nN and a peak force amplitude of 25 nm.
Transmission EM Imaging of Fibrils in Cell Sections.
Neuroblastoma cells treated with seed fibrils, following the protocols described above, were rinsed in phosphate and calcium-free solution before fixation. Normal saline (0.9% sodium chloride) was the rinsing medium used. Adherent cells were then fixed in 2% glutaraldehyde and 2% formaldehyde in 0.05 M sodium cacodylate buffer at pH 7.4 for 4 h at 4 °C. They were then scraped from the culture wells in the fixative and aspirated into 1.5-mL tubes. They were rinsed five times by centrifugation (of 10,000 × g to form a packed pellet) in 0.1 M cacodylate buffer. The excess buffer was removed immediately after spinning to avoid the cells beginning to resuspend. The cells were then treated with 1% osmium ferricyanide at room temperature (RT) for 2 h. They were rinsed in distilled water (DIW) and treated with 2% uranyl acetate in 0.05 M maleate buffer at pH 5.5 for 2 h at RT. They were again rinsed in DIW and dehydrated in an ascending series of ethanol solutions from 70 to 100%. This step was followed by treatment with two changes of dry acetonitrile and infiltration with Quetol epoxy resin (Agar Scientific). The resin was cured at 60 °C for 48 h. Thin sections (50 nm in thickness) were carefully prepared with a Leica Ultracut UCT ultramicrotome and mounted on 300 mesh transmission EM copper grids (Agar Scientific). They were then again stained with uranyl acetate and lead citrate. The samples were examined on a Tecnai G2 transmission electron microscope (FEI) operating at 200 kV, and images were captured using an AMT XR60B camera operating Deben software (Deben UK Ltd). The experiment was repeated two times, and more than 40 images of cell sections were acquired in total.
Uptake of Species.
The uptake of both monomeric and fibrillar AS, which had been added to the extracellular medium of SH-SY5Y or primary VM cells, occurred within 10 min at 37 °C, whereas no uptake was observed after 1 h of incubation at 4 °C for both species (Fig. S2), suggesting that both AS species were taken up via endocytosis.
Seed Fibril Elongation in Neurons by Exogenously Added AS Monomer.
We added preformed small fibrils, referred to as AS seed fibrils (50 nM, 5% covalently labeled with AF568) (Fig. 1), which had been characterized previously, as well as labeled monomeric AS (500 nM, 10% covalently labeled with AF647) to human SH-SY5Y neuroblastoma cells or primary rat embryonic day 14 VM neurons. The procedure was as fully described in Materials and Methods. Briefly, primary neurons or SH-SY5Y cells were incubated for 1 h with AF568-labeled seeds before washing and subsequent incubation with AF647-labeled monomeric AS for 1 h. After this procedure, the cells were washed twice and incubated for 24 h or 72 h in AS-free medium. The elongation of seed fibrils by monomer addition dominates over spontaneous nucleation/monomer-only aggregation, as can be seen in Fig. 2.
We also quantified the minimum size of a seed fibril that could be detected with our technique. From AFM imaging of seed fibrils, we have obtained an average length of 300 nm and a minimum length of ∼200 nm. From these data, we can estimate the average number of monomers included in a seed fibril to be ∼845 and the minimum number to be ∼540 (19). Moreover, in previous studies (18, 39), it has been shown that a labeled monomer has an equal probability as an unlabeled monomer to attach to a fibril end. Given the labeling density of the seed fibrils (5%), the probability of a fibril composed of n monomers to be fully unlabeled is 0.95n. If n = 540, then this probability will be extremely low (0.95540 = 9.3 × 10⁻¹³). We can therefore confidently say that above 90 monomers, a fibril has a 99% chance of containing one labeled monomer.
We can then calculate the probability of a seed fibril consisting of n monomers to contain k labeled monomers. This probability is binomial, which, for the limit of large n (which would be the case for n > 100 and P = 0.05), can be approximated by a normal distribution: , with , , and .
If we now take the case of n = 540 (the smallest seed fibrils of our sample) and k = 10, we will have μ = 27 and σ = 5.06. We can then calculate:
Therefore, even the smallest seed fibrils of our sample with a length of 200 nm should be detectable.
Correlative AFM/Optical Superresolution Imaging.
For a direct comparison between the two imaging techniques, we performed correlative dSTORM/AFM experiments. We thus deposited AF647-labeled amyloid fibrils on quartz slides containing nanofabricated gold markers (details are provided in Materials and Methods). The AFM measurement setup is depicted schematically in Fig. S1A, and a sample region of the gold pattern fabricated onto the quartz coverslip is shown in Fig. S1B. The pattern permitted the identification of the same measurement region with both AFM and dSTORM, and thus the correlative imaging of individual amyloid fibrils with both techniques. Fig. S1 C–E shows correlative AFM/dSTORM imaging of an AS fibril by AFM (Fig. S1C) and dSTORM (Fig. S1D). The corresponding AFM/dSTORM overlay image is shown in Fig. S1E. In certain cases, we note that not all fibrils visible by AFM can be captured in the dSTORM channel. It is likely that during the transfer time between the two experimental setups, some additional fibrils sediment onto the quartz surface, and that during the additional washing and drying steps before AFM imaging, some small fibrils and aggregates may have dislodged and changed location. Furthermore, fibrils that are out of focus during the acquisition of the dSTORM image, or less bright, are not included in the superresolved image because they produce inaccurate localizations, and are thus rejected by the reconstruction/visualization algorithms.
The above method has certain limitations due to the number of the intermediate steps required between the two modalities. Indeed, preparation of samples for AFM imaging directly after dSTORM imaging can sometimes result in a loss of fibrils or fibril displacement that hampers correlative analyses. We have therefore applied another method with which correlative measurements can be acquired directly in situ and without interfering with the samples when using the two modalities sequentially. This method consists of integrating an AFM scanning unit directly onto an inverted optical frame, such as a STED microscope. Therefore, recording of correlative STED and AFM data can be done sequentially on the same sample without the need for any additional steps, such as washing or drying (Fig. S1 F and G). STED is another type of optical superresolution microscopy technique, offering resolution with the specific AF647 dye that we used of less than 100 nm.
Transmission EM Imaging of Fibrils Inside the Neuronal Cells, After Cell Sectioning.
For a comparison between the fibril species taken up and elongated inside the neuronal cells, we also used transmission EM (TEM) imaging of thin (∼50 nm) cell sections, which correspond to ∼1/250 of the total cell thickness. The details of the method are presented in Materials and Methods. In particular, we studied both treated cells (cells to which seed fibrils were previously added) and control cells, which had been untreated. The experiment was repeated twice. After inspection of more than 100 areas of sections of control cells and the same number of sections of treated cells randomly chosen, the fibrillar structures depicted in Fig. S3D were found, whereas no similar structures were identified in any of the control cell sections. A high number (at least 30) of the treated cell sections contained fibrillar structures. We also obtained TEM images of the seed fibrils in vitro, before addition to the cells. The comparison between the lengths of the seed fibrils in vitro and the fibrils found in cell sections is shown in Fig. S3F. This graph provides further support to our data obtained by dSTORM imaging, namely, that the seed fibrils have elongated inside the cells.
Colocalization/Coclustering Analysis for Seed Fibril Elongation and Monomer Interaction with the Endogenous Protein.
To test the significance of the coclustering between the two fluorescent channels, we used a Ripley’s K function-based approach (Materials and Methods). We first took this approach to analyze the clustering of endogenous AS with exogenous seed fibrils due to elongation (Fig. S4A, green curve). Here, the Ripley’s L(r) − r curve largely exceeds the 99% CI bounds in a large range of spatial positions (50–500 nm), which indicates that the images obtained using exogenous seeds display statistically significant clustering with monomer, which does not originate from random distribution (<1%). Additionally, the L(r) − r function peaks at ∼250 nm, which is in good agreement with half of the length of the average seed fibril.
On the other hand, in the case of added monomer and its interaction with endogenous protein (Fig. S4, red curve), the L(r) − r curve remains within the 99% CI bounds, suggesting that no statistically significant clustering is present in these images.
Ab Cross-Reactivity and Binding.
To visualize the endogenous AS in both SH-SY5Y and primary VM cells, two different primary Abs were used: monoclonal mouse Ab (LB509) for SH-SY5Y cells and monoclonal rabbit Ab (D37A6) XP specific to rat AS for rat embryonic primary VM cells. In both cases, we tested the cross-reactivity of the Abs, with the human AS added to cells in both its fibrillar and monomeric forms.
To confirm the specificity of the rat-specific Ab, we immunostained in vitro fibrillar seeds that were directly labeled with AF568 (green) via addition of rat AS-specific primary and secondary Abs, the latter of which were conjugated to AF647 (red). We found that there was a small degree of cross-reactivity. We thus quantified the elongation of these seeds in cells by taking as a baseline the length of the Ab-stained seeds in vitro. Fig. S5 shows that the latter have indeed elongated by addition of endogenous protein.
In the case of the LB509 Ab used for SH-SY5Y cells, we observed very little cross-reactivity because the epitope of LB509 is located in the region encoded by amino acids 115–122 of AS. It thus colocalizes with the site to which the fluorescent label is attached to (residue 122) within the AS sequence, and is therefore “blocked,” similar to what has been reported previously (39).
Aggregate Species Formed by Exogenously Added Monomeric AS Inside Cells Do Not Seed Endogenous AS.
In this experiment, we tested the growth propensity of aggregates formed when monomeric AS was added to cells. The experimental procedure was as follows. Five hundred nanomolar monomeric AS labeled with AF647 (10% labeled) was added to the extracellular medium of primary VM cell cultures. After 1 h of incubation at 37 °C, we washed the extracellular medium twice and then continued the incubation in AS-free medium for either 3 d or 7 d until aggregates of the AF647-labeled AS were formed. We subsequently added 500 nM monomeric AS labeled with AF568 (10% labeled) and incubated the cells for 1 h at 37 °C. Subsequently, the cells were washed and incubated for 24 h in AS-free medium. As can be seen in the two-color dSTORM images in Fig. S9, the AS-AF647 aggregates formed after either 3 d or 7 d have a very small propensity to elongate or grow by addition of “fresh” monomeric AS-AF568. In comparison, the seed fibrils that had been previously formed in vitro and added to cells had a much higher propensity to elongate, and thus acted as efficient “monomer sinks” (see also Fig. 3).
Materials and Methods
WT human AS was recombinantly expressed and purified as described previously (19). Superresolution imaging in vitro and in cells was performed using a dSTORM microscopy setup based on a Nikon Eclipse TE 300 inverted wide-field microscope and a 100×, 1.49-N.A. total internal reflection fluorescence objective lens (Nikon, UK Ltd) as described by Pinotsi et al. (18). The experiments were performed on both neuroblastoma cell cultures and on VM neurons dissected from rat embryos. Details on all of the experimental protocols, methods, and data analysis can be found in SI Materials and Methods.
Acknowledgments
We thank Dr. Q. Jeng and Dr. A. Stephens for technical assistance and Dr. J. Skepper for transmission EM imaging. This work was funded by grants from the UK Medical Research Council (MR/K015850/1 and MR/K02292X/1), Alzheimer’s Research UK (ARUK-EG2012A-1), the UK Engineering and Physical Sciences Research Council (EP/H018301/1), and the Wellcome Trust (089703/Z/09/Z). D.P. acknowledges support from the Swiss National Science Foundation and the Wellcome Trust through personal fellowships. A.K.B thanks Magdalene College (Cambridge University) and the Leverhulme Trust for support.
Footnotes
The authors declare no conflict of interest.
This article is a PNAS Direct Submission. T.C.P. is a guest editor invited by the Editorial Board.
This article contains supporting information online at www.pnas.org/lookup/suppl/doi:10.1073/pnas.1516546113/-/DCSupplemental.
References
- 1.Prusiner SB, Scott MR, DeArmond SJ, Cohen FE. Prion protein biology. Cell. 1998;93(3):337–348. doi: 10.1016/s0092-8674(00)81163-0. [DOI] [PubMed] [Google Scholar]
- 2.Chiti F, Dobson CM. Protein misfolding, functional amyloid, and human disease. Annu Rev Biochem. 2006;75:333–366. doi: 10.1146/annurev.biochem.75.101304.123901. [DOI] [PubMed] [Google Scholar]
- 3.Aguzzi A, Rajendran L. The transcellular spread of cytosolic amyloids, prions, and prionoids. Neuron. 2009;64(6):783–790. doi: 10.1016/j.neuron.2009.12.016. [DOI] [PubMed] [Google Scholar]
- 4.Brundin P, Melki R, Kopito R. Prion-like transmission of protein aggregates in neurodegenerative diseases. Nat Rev Mol Cell Biol. 2010;11(4):301–307. doi: 10.1038/nrm2873. [DOI] [PMC free article] [PubMed] [Google Scholar]
- 5.Eisenberg D, Jucker M. The amyloid state of proteins in human diseases. Cell. 2012;148(6):1188–1203. doi: 10.1016/j.cell.2012.02.022. [DOI] [PMC free article] [PubMed] [Google Scholar]
- 6.Jucker M, Walker LC. Self-propagation of pathogenic protein aggregates in neurodegenerative diseases. Nature. 2013;501(7465):45–51. doi: 10.1038/nature12481. [DOI] [PMC free article] [PubMed] [Google Scholar]
- 7.Guo JL, et al. Distinct α-synuclein strains differentially promote tau inclusions in neurons. Cell. 2013;154(1):103–117. doi: 10.1016/j.cell.2013.05.057. [DOI] [PMC free article] [PubMed] [Google Scholar]
- 8.Bousset L, et al. Structural and functional characterization of two alpha-synuclein strains. Nat Commun. 2013;4:2575. doi: 10.1038/ncomms3575. [DOI] [PMC free article] [PubMed] [Google Scholar]
- 9.Braak H, et al. Staging of brain pathology related to sporadic Parkinson’s disease. Neurobiol Aging. 2003;24(2):197–211. doi: 10.1016/s0197-4580(02)00065-9. [DOI] [PubMed] [Google Scholar]
- 10.Goldberg MS, Lansbury PT., Jr Is there a cause-and-effect relationship between alpha-synuclein fibrillization and Parkinson’s disease? Nat Cell Biol. 2000;2(7):E115–E119. doi: 10.1038/35017124. [DOI] [PubMed] [Google Scholar]
- 11.Caughey B, Lansbury PT. Protofibrils, pores, fibrils, and neurodegeneration: Separating the responsible protein aggregates from the innocent bystanders. Annu Rev Neurosci. 2003;26:267–298. doi: 10.1146/annurev.neuro.26.010302.081142. [DOI] [PubMed] [Google Scholar]
- 12.Danzer KM, et al. Different species of alpha-synuclein oligomers induce calcium influx and seeding. J Neurosci. 2007;27(34):9220–9232. doi: 10.1523/JNEUROSCI.2617-07.2007. [DOI] [PMC free article] [PubMed] [Google Scholar]
- 13.Winner B, et al. In vivo demonstration that alpha-synuclein oligomers are toxic. Proc Natl Acad Sci USA. 2011;108(10):4194–4199. doi: 10.1073/pnas.1100976108. [DOI] [PMC free article] [PubMed] [Google Scholar]
- 14.Heilemann M, et al. Subdiffraction-resolution fluorescence imaging with conventional fluorescent probes. Angew Chem Int Ed Engl. 2008;47(33):6172–6176. doi: 10.1002/anie.200802376. [DOI] [PubMed] [Google Scholar]
- 15.van de Linde S, et al. Direct stochastic optical reconstruction microscopy with standard fluorescent probes. Nat Protoc. 2011;6(7):991–1009. doi: 10.1038/nprot.2011.336. [DOI] [PubMed] [Google Scholar]
- 16.Kaminski Schierle GS, et al. In situ measurements of the formation and morphology of intracellular β-amyloid fibrils by super-resolution fluorescence imaging. J Am Chem Soc. 2011;133(33):12902–12905. doi: 10.1021/ja201651w. [DOI] [PubMed] [Google Scholar]
- 17.Duim WC, Chen B, Frydman J, Moerner WE. Sub-diffraction imaging of huntingtin protein aggregates by fluorescence blink-microscopy and atomic force microscopy. ChemPhysChem. 2011;12(13):2387–2390. doi: 10.1002/cphc.201100392. [DOI] [PMC free article] [PubMed] [Google Scholar]
- 18.Pinotsi D, et al. Direct observation of heterogeneous amyloid fibril growth kinetics via two-color super-resolution microscopy. Nano Lett. 2014;14(1):339–345. doi: 10.1021/nl4041093. [DOI] [PMC free article] [PubMed] [Google Scholar]
- 19.Buell AK, et al. Solution conditions determine the relative importance of nucleation and growth processes in α-synuclein aggregation. Proc Natl Acad Sci USA. 2014;111(21):7671–7676. doi: 10.1073/pnas.1315346111. [DOI] [PMC free article] [PubMed] [Google Scholar]
- 20.Galvagnion C, et al. Lipid vesicles trigger α-synuclein aggregation by stimulating primary nucleation. Nat Chem Biol. 2015;11(3):229–234. doi: 10.1038/nchembio.1750. [DOI] [PMC free article] [PubMed] [Google Scholar]
- 21.Michel CH, et al. Extracellular monomeric tau protein is sufficient to initiate the spread of tau protein pathology. J Biol Chem. 2014;289(2):956–967. doi: 10.1074/jbc.M113.515445. [DOI] [PMC free article] [PubMed] [Google Scholar]
- 22.Laganowsky A, et al. Atomic view of a toxic amyloid small oligomer. Science. 2012;335(6073):1228–1231. doi: 10.1126/science.1213151. [DOI] [PMC free article] [PubMed] [Google Scholar]
- 23.Celej MS, et al. Toxic prefibrillar α-synuclein amyloid oligomers adopt a distinctive antiparallel β-sheet structure. Biochem J. 2012;443(3):719–726. doi: 10.1042/BJ20111924. [DOI] [PubMed] [Google Scholar]
- 24.Cremades N, et al. Direct observation of the interconversion of normal and toxic forms of α-synuclein. Cell. 2012;149(5):1048–1059. doi: 10.1016/j.cell.2012.03.037. [DOI] [PMC free article] [PubMed] [Google Scholar]
- 25.Pieri L, Madiona K, Bousset L, Melki R. Fibrillar α-synuclein and huntingtin exon 1 assemblies are toxic to the cells. Biophys J. 2012;102(12):2894–2905. doi: 10.1016/j.bpj.2012.04.050. [DOI] [PMC free article] [PubMed] [Google Scholar]
- 26.Peelaerts W, et al. α-Synuclein strains cause distinct synucleinopathies after local and systemic administration. Nature. 2015;522(7556):340–344. doi: 10.1038/nature14547. [DOI] [PubMed] [Google Scholar]
- 27.Ahn T-B, et al. alpha-Synuclein gene duplication is present in sporadic Parkinson disease. Neurology. 2008;70(1):43–49. doi: 10.1212/01.wnl.0000271080.53272.c7. [DOI] [PubMed] [Google Scholar]
- 28.Singleton AB, et al. alpha-Synuclein locus triplication causes Parkinson’s disease. Science. 2003;302(5646):841. doi: 10.1126/science.1090278. [DOI] [PubMed] [Google Scholar]
- 29.Toyama BH, Weissman JS. Amyloid structure: Conformational diversity and consequences. Annu Rev Biochem. 2011;80:557–585. doi: 10.1146/annurev-biochem-090908-120656. [DOI] [PMC free article] [PubMed] [Google Scholar]
- 30.Sacino AN, et al. Amyloidogenic α-synuclein seeds do not invariably induce rapid, widespread pathology in mice. Acta Neuropathol. 2014;127(5):645–665. doi: 10.1007/s00401-014-1268-0. [DOI] [PMC free article] [PubMed] [Google Scholar]
- 31.Brundin P, Li J-Y, Holton JL, Lindvall O, Revesz T. Research in motion: The enigma of Parkinson’s disease pathology spread. Nat Rev Neurosci. 2008;9(10):741–745. doi: 10.1038/nrn2477. [DOI] [PubMed] [Google Scholar]
- 32.Desplats P, et al. Inclusion formation and neuronal cell death through neuron-to-neuron transmission of alpha-synuclein. Proc Natl Acad Sci USA. 2009;106(31):13010–13015. doi: 10.1073/pnas.0903691106. [DOI] [PMC free article] [PubMed] [Google Scholar]
- 33.Kordower JH, et al. Transfer of host-derived α synuclein to grafted dopaminergic neurons in rat. Neurobiol Dis. 2011;43(3):552–557. doi: 10.1016/j.nbd.2011.05.001. [DOI] [PMC free article] [PubMed] [Google Scholar]
- 34.Pöltl D, Schildknecht S, Karreman C, Leist M. Uncoupling of ATP-depletion and cell death in human dopaminergic neurons. Neurotoxicology. 2012;33(4):769–779. doi: 10.1016/j.neuro.2011.12.007. [DOI] [PubMed] [Google Scholar]
- 35.Tokunaga M, Imamoto N, Sakata-Sogawa K. Highly inclined thin illumination enables clear single-molecule imaging in cells. Nat Methods. 2008;5(2):159–161. doi: 10.1038/nmeth1171. [DOI] [PubMed] [Google Scholar]
- 36.Rees EJ, et al. Blind assessment of localisation microscope image resolution. Opt Nanoscopy. 2012;1(1):12. [Google Scholar]
- 37.Ripley BD. The second-order analysis of stationary point processes. J Appl Probab. 1976;13:255. [Google Scholar]
- 38.Mahou P, Curry N, Pinotsi D, Kaminski-Schierle GS, Kaminski CF. 2015. Stimulated emission depletion microscopy to study amyloid fibril formation. Proceedings of SPIE, eds Enderlein J, Gregor I, Gryczynski ZK, Erdmann R, Koberling F (SPIE, Bellingham, WA), Vol 9331, pp 93310U–93310U-10.
- 39.Fritschi SK, et al. Highly potent soluble amyloid-β seeds in human Alzheimer brain but not cerebrospinal fluid. Brain. 2014;137(Pt 11):2909–2915. doi: 10.1093/brain/awu255. [DOI] [PMC free article] [PubMed] [Google Scholar]


