Significance
Hypoglycemia is an important and frequently encountered complication of diabetes treatment. Here, we identify a subset of neurons located in the ventromedial hypothalamic nucleus, activation of which is both necessary and sufficient to mediate adaptive counterregulatory responses to hypoglycemia that return low blood glucose levels into the normal range. These neurons receive ascending input from neurons in the lateral parabrachial nucleus and in turn control blood glucose levels via projections to the anterior bed nucleus of the stria terminalis. Together, this work identifies a previously unrecognized functional neurocircuit involved in glycemic control.
Keywords: glucoregulatory circuit, counter regulation, ventromedial nucleus, bed nucleus of the stria terminalis, hyperglycemia
Abstract
Previous studies implicate the hypothalamic ventromedial nucleus (VMN) in glycemic control. Here, we report that selective inhibition of the subset of VMN neurons that express the transcription factor steroidogenic-factor 1 (VMNSF1 neurons) blocks recovery from insulin-induced hypoglycemia whereas, conversely, activation of VMNSF1 neurons causes diabetes-range hyperglycemia. Moreover, this hyperglycemic response is reproduced by selective activation of VMNSF1 fibers projecting to the anterior bed nucleus of the stria terminalis (aBNST), but not to other brain areas innervated by VMNSF1 neurons. We also report that neurons in the lateral parabrachial nucleus (LPBN), a brain area that is also implicated in the response to hypoglycemia, make synaptic connections with the specific subset of glucoregulatory VMNSF1 neurons that project to the aBNST. These results collectively establish a physiological role in glucose homeostasis for VMNSF1 neurons and suggest that these neurons are part of an ascending glucoregulatory LPBN→VMNSF1→aBNST neurocircuit.
Because the brain relies exclusively on glucose as a fuel source, brain function is rapidly compromised when circulating glucose levels drop below the normal range. Consequently, hypoglycemia elicits a robust, integrated, and redundant set of counterregulatory responses (CRRs) that ensure the rapid and efficient recovery of plasma glucose concentrations into the normal range (1). Components of the CRR include increased secretion of the hormones glucagon, epinephrine, and glucocorticoids, inhibition of glucose-induced insulin secretion, increased sympathetic nervous system (SNS) outflow to the liver, and increased food intake (1–3). Owing to this redundancy, recovery from hypoglycemia is difficult to block in normal humans and animal models, even when adrenal or glucagon responses are prevented. Only when multiple responses are blocked is the ability to recover from hypoglycemia significantly compromised (4). This arrangement is perhaps unsurprising, given the threat to survival posed by hypoglycemia.
Although glucose sensing can occur at peripheral (e.g., neurons innervating the hepatic portal vein) as well as central sites (3, 5), the brain is the organ responsible both for transducing this information into effective glucose counterregulation and for terminating this response once euglycemia is restored. Of the many brain areas that have been investigated, the hypothalamic ventromedial nucleus (VMN) has emerged as potentially being both necessary and sufficient to elicit this powerful response. This assertion is based on evidence that, whereas electrical stimulation of the VMN activates the CRR and thereby raises circulating glucose levels (6), glucose infusion directly into the VMN can suppress the CRR during hypoglycemia (7) and thereby impair recovery of normal blood glucose levels (8). Moreover, two recent papers identified a circuit comprised of neurons in the lateral parabrachial nucleus (LPBN) that project to the VMN, activation of which seems to be required for effective glucose counterregulation (9, 10). The relevant VMN neurons seem to be glutamatergic because genetic disruption of glutamatergic signaling within a specific subset of VMN neurons [known as steroidogenic factor-1 (SF1) neurons] also attenuates recovery from insulin-induced hypoglycemia (11).
Together, these observations support a model in which, during hypoglycemia, inputs from the LPBN and other glucose-responsive neurocircuits converge upon and activate VMN neurons, and in which this activation is required for effective glucose counterregulation. Whether these VMN neurons or any other specific neuronal subset(s) are truly necessary or sufficient for this important adaptive response has yet to be established, however. Recent technological advances, including the use of optogenetics to selectively activate or inactivate neurons in a regionally and temporally specific manner, now enable such questions to be addressed (12).
A relevant parallel can be drawn to knowledge recently gained regarding control of feeding behavior by neurons that express Agouti-related peptide (Agrp), found in the adjacent hypothalamic arcuate nucleus. Since their discovery more than a decade ago (13, 14), innumerable papers were published implicating these neurons as key drivers of fasting-induced hyperphagia (15, 16), but whether they are in and of themselves necessary or sufficient for normal food intake was unknown until recently. The past few years have shown (among other things) that selective activation of Agrp neurons is sufficient to potently drive intake whereas inhibition of these neurons blunts the effect of fasting to stimulate feeding (17, 18). These findings offer direct, compelling support for the hypothesis that Agrp neurons are primary drivers of need-based feeding. Whether activation of VMNSF1 neurons is both necessary and sufficient to explain the powerful adaptive responses elicited by hypoglycemia is a question of similar importance. Given the many sites that participate in glucose sensing (5, 19, 20) and how difficult it is to prevent recovery from hypoglycemia (owing to redundancy inherent in the CRR), it seems improbable that the entire response should hinge on activation of a select population of neurons in a relatively small brain area. To test this hypothesis, we first determined whether optogenetic inactivation of VMNSF1 neurons during insulin-induced hypoglycemia blocks increased glucagon and corticosterone secretion, inhibition of glucose-induced insulin secretion, and recovery of normal blood glucose levels. We also asked whether, conversely, optogenetic activation of VMNSF1 neurons elicits hyperglycemia by activating the CRR in otherwise normal mice. Last and perhaps most importantly, we sought to identify projections of VMNSF1 neurons to downstream brain areas involved in glucose counterregulation and to determine whether these VMNSF1 neuronal subsets make synaptic contacts with the previously identified upstream neurons located in the LPBN. Our data collectively indicate that (i) VMNSF1 neurons are key components of a circuit that extends from the LPBN to the VMN and then to the anterior bed nucleus of the stria terminalis (aBNST) (LPBN→VMN→aBNST), (ii) VMNSF1 neurons function as a primary motor output driving the CRR, and (iii) activation of VMNSF1 neurons is required for effective recovery from insulin-induced hypoglycemia.
Results
VMNSF1 Neurons Are Required for Intact Responses to Insulin-Induced Hypoglycemia.
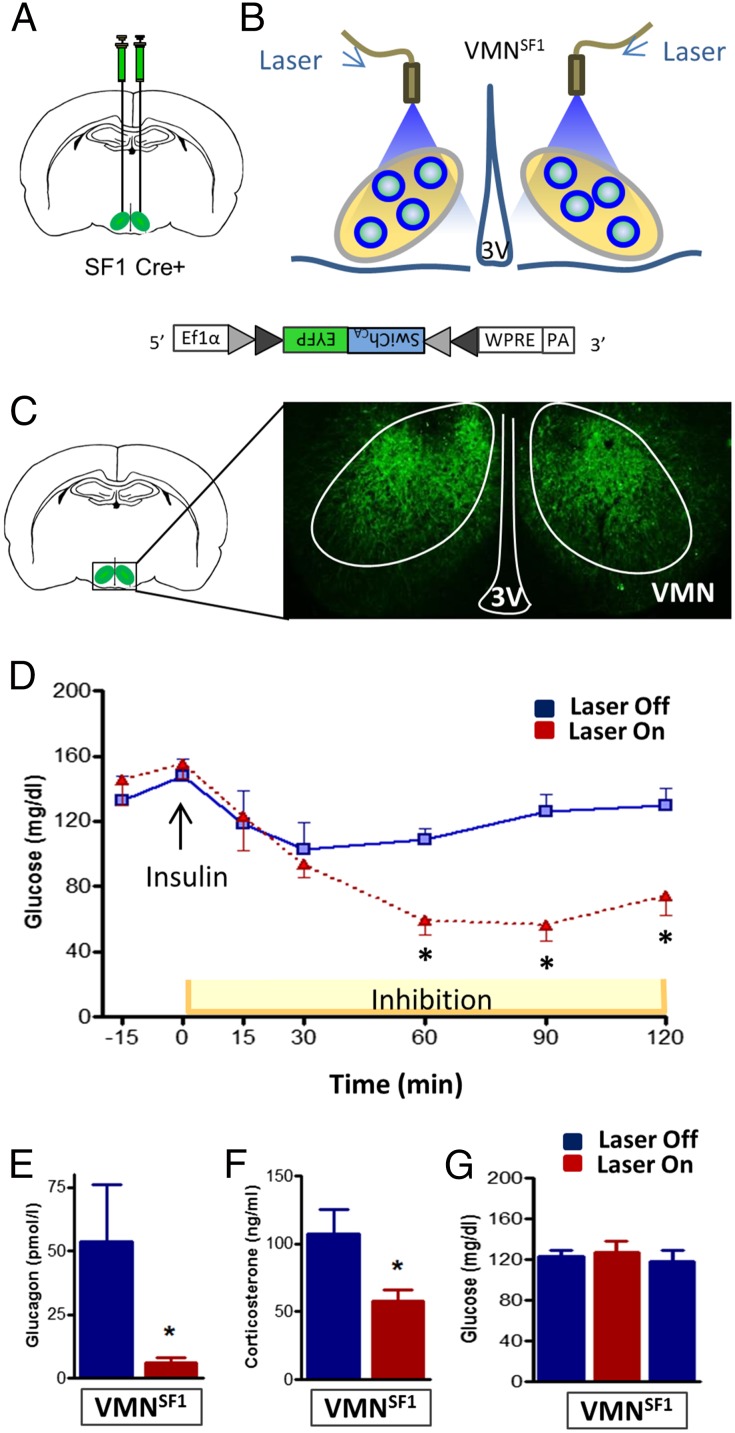
Because of the threat to survival posed by inadequate glucose delivery to the brain, the CRR to hypoglycemia is mediated by a highly integrated, redundant, and powerful combination of behavioral, autonomic, and neuroendocrine responses that are conserved across mammalian species. To investigate the physiological role played by VMNSF1 neurons in this response, we sought to determine whether activation of these neurons is required for the ability to recover from hypoglycemia. To this end, we expressed a light-activated inhibitory channel selectively in VMNSF1 neurons. This objective was achieved through bilateral stereotaxic microinjection of an adeno-associated viral construct (AAV) into the VMN of SF1-Cre-positive (SF1-Cre+) mice (in which Cre recombinase is expressed under the control of the VMN-specific SF1 promoter) (21). The AAV expresses a modified channelrhodopsin chloride-conducting anion channel fused with the fluorescent reporter EYFP (AAVDJ8-DIO-SwiChRCA-EYFP, referred to hereafter as “SwiChRCA virus”) and is “Cre-inducible,” meaning that viral expression is restricted to cells that also express Cre recombinase. Through an optic fiber implanted immediately dorsal to each VMN injection site (Fig. 1 A–C), delivery of light (“Laser On”) causes hyperpolarization of VMNSF1 neurons, but not other neurons in the VMN or surrounding brain areas (Fig. 1C).
Fig. 1.
Photoinhibition of VMNSF1 neurons disrupts recovery from insulin-induced hypoglycemia. (A) Scheme demonstrating bilateral stereotaxic microinjection of the Cre-dependent inhibitory channelrhodopsin-EYFP (SwiChRCA) virus into the VMN of SF1-Cre+ mice and (B) implantation of the optic fiber dorsal to the injection site. (C) Representative image of EYFP fluorescence showing bilateral infection and expression specifically within the VMN of SF1-Cre+ mice. 3V, third cerebral ventricle; VMN, ventromedial hypothalamic nucleus. (D) Blood glucose and plasma (E) glucagon and (F) corticosterone levels in SF1-Cre+ mice during photoinhibition of VMNSF1 neurons (Laser On) relative to the Laser Off during insulin-induced hypoglycemia (n = 7–8 per group). *P < 0.05 vs. Laser off. All data are expressed as mean ± SEM. (G) Blood glucose levels before (pre), during (inhib), and 1 h after (post) bilateral photoinhibition of VMNSF1 neurons in SF1-Cre+ mice in the basal state (n = 8) analyzed by one-way ANOVA with Sidak’s post hoc test. All comparisons are nonsignificant.
We report that, whereas photoinhibition of VMNSF1 neurons had no effect on fasting blood glucose levels in the basal state relative to the “Laser-Off” condition (Fig. 1G), the ability of mice to recover from insulin-induced hypoglycemia was severely impaired by light-induced silencing of VMNSF1 neurons (Fig. 1D). Thus, activation of a discrete and uniquely identified subpopulation of VMN neurons is required to effectively recover from hypoglycemia. By comparison, VMNSF1 neuron activation is not required for maintenance of normal blood glucose levels in the basal state (e.g., in the absence of a threat to brain glucose delivery).
The striking inability of mice to respond to insulin-induced hypoglycemia when VMNSF1 neurons are silenced implies that their activation is required for secretion of counterregulatory hormones in this setting. Consistent with this hypothesis, we found, in a separate experiment, that the increase of circulating glucagon and corticosterone levels that normally occurs during hypoglycemia was blocked when VMNSF1 neurons were silenced (Fig. 1 E and F). These data demonstrate that activation of VMNSF1 neurons is indispensable for an intact CRR to hypoglycemia, as previously hypothesized (11), and thus constitute direct evidence of a physiological role for these neurons in glucose homeostasis.
Photoactivation of VMNSF1 Neurons Induces Hyperglycemia.
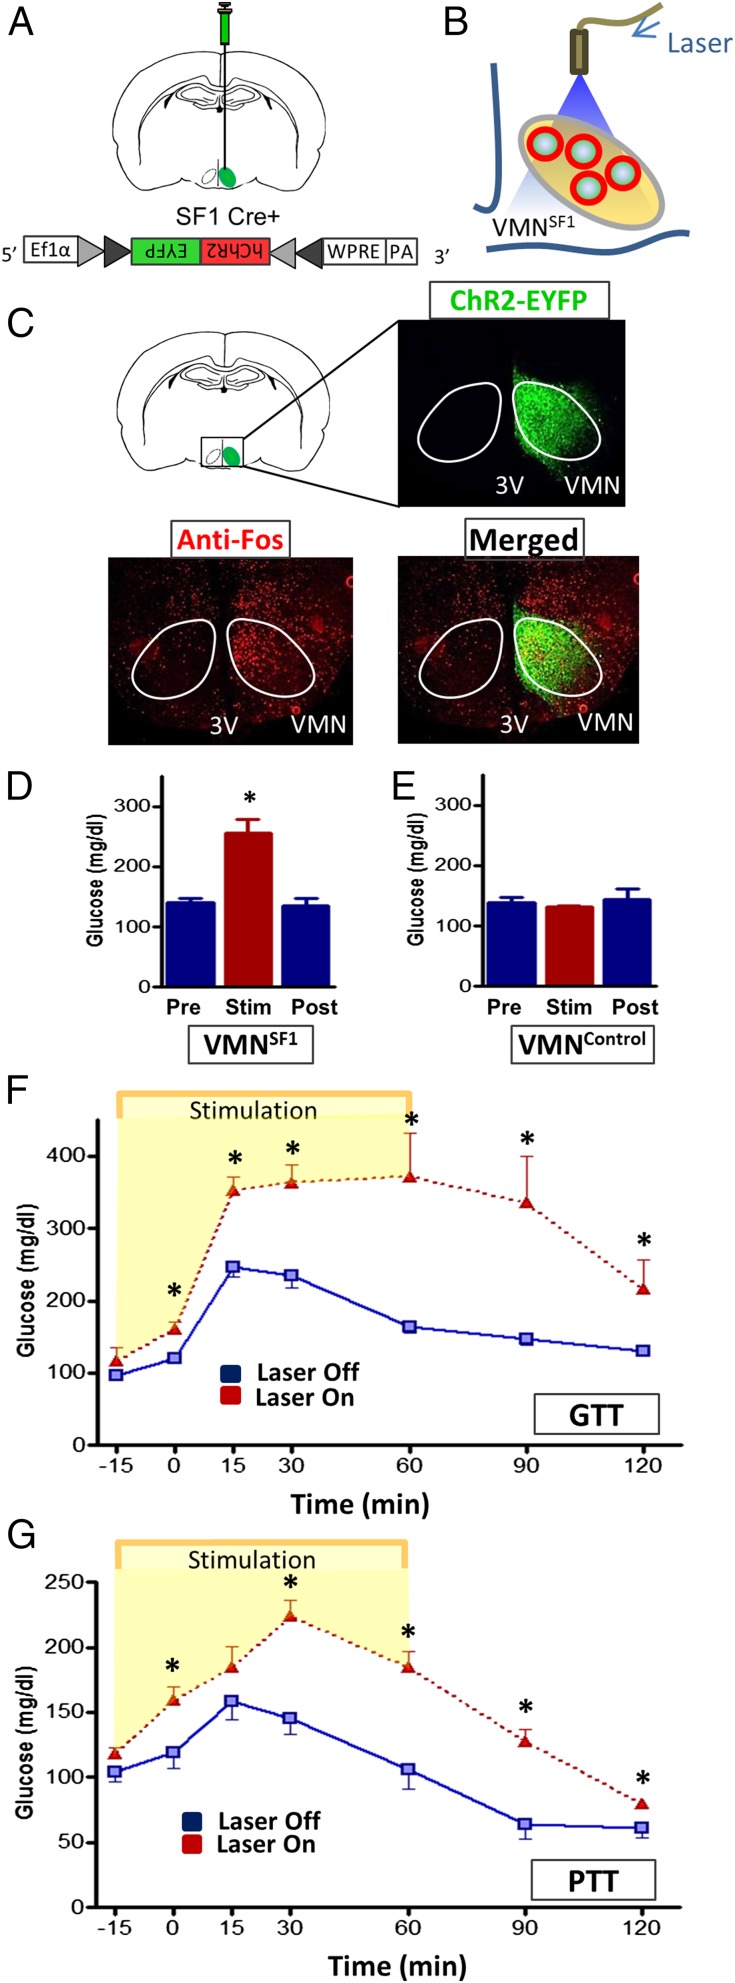
Based on our finding that activation of VMNSF1 neurons is required for an intact response to hypoglycemia, we hypothesized that activation of these neurons in otherwise normal mice will trigger the CRR and thereby cause blood glucose levels to increase. To test this hypothesis, we expressed a light-activated excitatory channel selectively in VMNSF1 neurons through unilateral stereotaxic microinjection of a Cre-dependent, AAV-expressing channelrhodopsin-EYFP virus (AAV5-DIO-ChR2-EYFP) into the VMN of SF1-Cre+ mice, followed by implantation of an optic fiber above the injection site (Fig. 2 A and B). As expected, EYFP fluorescence was restricted to the VMN of SF1-cre+ mice, and, 1 h after photostimulation of these neurons, a robust induction of c-Fos (a marker of neuronal activation) was detected in the VMN and surrounding hypothalamic areas (Fig. 2C). As predicted, photoactivation of VMNSF1 neurons raised blood glucose levels rapidly and markedly, with glycemia returning to baseline values within 1 h after cessation of photostimulation (Fig. 2D). Because this effect was not observed in Cre-negative littermate controls (VMNControl) that underwent the same viral microinjection and light exposure procedure (Fig. 2E), we conclude that the observed hyperglycemic response was a specific consequence of VMNSF1 neuron activation. To further characterize the effect of VMNSF1 neuronal activation on glucose homeostasis, we performed an intraperitoneal (i.p.) glucose tolerance test (IPGTT) in both the presence and absence of unilateral photoactivation of VMNSF1 neurons. Glucose tolerance was markedly impaired by VMNSF1 neuron activation (Fig. 2F) (GluAUC; Laser Off, 21,560 ± 904 vs. Laser On, 39,659 ± 4,253; P < 0.05), further establishing its powerful diabetogenic effect. To determine whether increased hepatic gluconeogenesis contributes to this impairment of glucose tolerance, we performed a pyruvate tolerance test (PTT) in a separate cohort of SF1-Cre+ mice in both the presence and absence of VMNSF1 neuron photoactivation. Our finding that the rise of blood glucose levels in response to a pyruvate challenge was markedly increased during activation of VMNSF1 neurons (Fig. 2G) (GluAUC; Laser Off, 13,723 ± 897 vs. Laser On, 20,855 ± 903; P < 0.05) implicates increased hepatic gluconeogenesis in the hyperglycemia and glucose intolerance observed in this setting.
Fig. 2.
Photoactivation of VMNSF1 neurons induces hyperglycemia and causes impaired glucose and pyruvate tolerance in nondiabetic mice. (A) Scheme depicting unilateral stereotaxic microinjection of the Cre-dependent light-activated channelrhodopsin (ChR2-EYFP) virus into the VMN of SF1-Cre+ mice and (B) implantation of the optic fiber dorsal to the injection site. (C) Representative image indicating unilateral infection and expression of EYFP fluorescence within the VMN of SF1-Cre+ mice and c-Fos within both the VMN and surrounding area 1 h after photostimulation. 3V, third cerebral ventricle; VMN, ventromedial hypothalamic nucleus. Blood glucose levels before (Pre), during (Stim) and 1 h after (Post) unilateral stimulation of VMNSF1 neurons in (D) SF1-Cre+ mice and (E) VMNControl animals (Cre-negative) (n = 5–8 per group). *P < 0.05 vs. Pre. Blood glucose levels during an i.p. (F) glucose- (GTT) and (G) pyruvate-tolerance test (PTT) in both the presence and absence of unilateral photoactivation of VMNSF1 neurons in SF1-Cre+ mice. *P < 0.05 vs. Laser Off. All data are expressed as mean ± SEM.
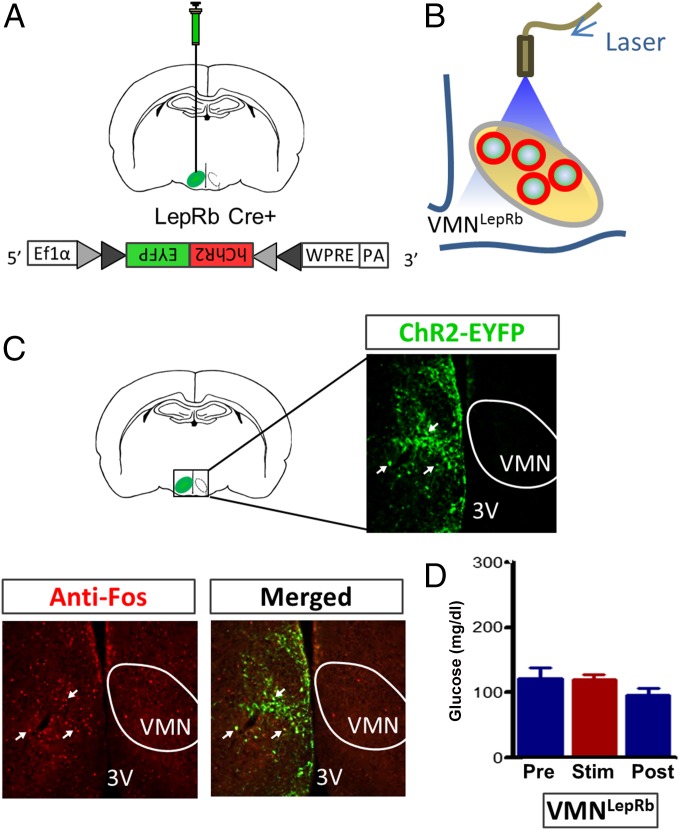
The VMN comprises a heterogeneous population of neurons, many of which express SF1. A large subset of VMN neurons also express the long form of the leptin receptor (LepRb), and a majority of these neurons also express SF1 (21, 22). To determine whether activation of LepRb-expressing neurons in the VMN (VMNLepRb) also causes hyperglycemia, we microinjected the Cre-dependent channelrhodopsin virus into the VMN of leptin receptor-IRES-Cre (Lepr-Cre+) mice (Fig. 3 A–C) so as to enable photoactivation of VMNLepRb neurons. Successful transduction of these neurons was confirmed by observing EYFP fluorescence in the VMN, with EYFP fluorescence also detected in a few cells in adjacent areas, including the dorsomedial hypothalamus (DMH) and arcuate nucleus (ARC) (Fig. 3C). However, little or no c-Fos was colocalized with transduced LepRb neurons outside the VMN after photostimulation (Fig. 3C). Thus, our photostimulation protocol seems to have effectively targeted only VMNLepRb neurons and not adjacent hypothalamic LepRb subsets.
Fig. 3.
Photoactivation of VMNLepRb neurons fails to raise blood glucose levels. (A) Scheme demonstrating unilateral stereotaxic microinjection of the Cre-dependent light-activated channelrhodopsin (ChR2-EYFP) virus into the VMN of Lepr-IRES-Cre mice and (B) implantation of the optic fiber dorsal to the injection site. (C) Representative image depicting unilateral infection and expression of EYFP fluorescence within the VMN of Lepr-IRES-Cre mice and c-Fos within both the VMN and surrounding area 1 h after photostimulation. 3V, third cerebral ventricle; VMN, ventromedial hypothalamic nucleus. (D) Blood glucose levels before (Pre), during (Stim), and 1 h after (Post) unilateral stimulation of VMNLepRb neurons in Lepr-IRES-Cre mice. All comparisons are nonsignificant (n = 11 per group). All data are expressed as mean ± SEM.
In contrast to the potent diabetogenic effect of VMNSF1 neuron activation, photostimulation of VMNLepRb neurons did not affect blood glucose levels (Fig. 3D), despite the fact that VMNLepRb neurons were clearly activated by the photostimulation protocol and that many VMNLepRb neurons coexpress SF1 (21, 22). These observations suggest that a subset of VMNSF1 neurons that do not express LepRb are responsible for the hyperglycemic effect observed during VMN stimulation. Alternatively, it is possible that activation of a subset of VMNLepRb neurons that do not express SF1 exerts an inhibitory effect on those neurons that do, and thereby blocks the activation of responses underlying hyperglycemia.
Neuroendocrine Effects of VMNSF1 Photoactivation.
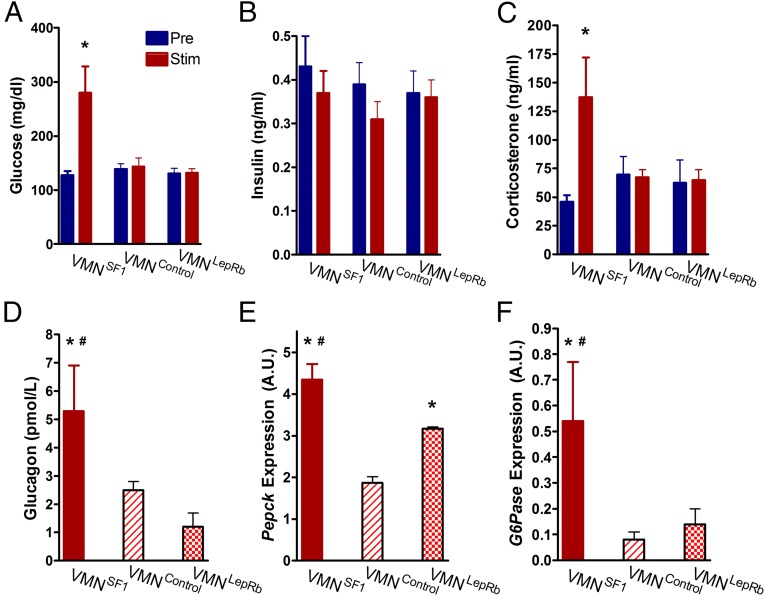
To explain how VMNSF1 neuron photoactivation elicits its robust diabetogenic effect, we hypothesized a role for both an autonomic mechanism, whereby glucose-induced pancreatic insulin secretion is blocked, and a neuroendocrine component involving increased secretion of counterregulatory hormones. To test the former hypothesis, we measured plasma insulin levels before and during photoactivation of VMNSF1 neurons. Despite the marked hyperglycemia elicited by activation of VMNSF1 neurons (Fig. 4A), plasma insulin levels remained at their normoglycemic baseline (Laser Off) (Fig. 4B). As expected, neither blood glucose nor plasma insulin levels were affected by light stimulation of the VMN of either VMNLepRb or VMNControl mice (Fig. 4B). Thus, the hyperglycemic response to VMNSF1 neuron photoactivation seems to be mediated, in part, by a potent inhibition of glucose-induced insulin secretion, consistent with earlier observations after electrical stimulation of the VMN (23, 24).
Fig. 4.
Photoactivation of VMNSF1 neurons mediates CRR responses. (A) Blood glucose, (B) plasma insulin, and (C) plasma corticosterone either prior (Pre), or 1 h after Cre-dependent channelrhodopsin stimulation (Stim) and (D) plasma glucagon and hepatic expression of (E) Pepck and (F) G6Pase as measured by real-time PCR 1 h after Cre-dependent channelrhodopsin activation of VMNSF1, VMNControl, and VMNLepRb cell types, respectively (n = 5–8 per group). *P < 0.05 vs. VMNControl; #P < 0.05 vs. VMNLepRb. All data are expressed as mean ± SEM.
In addition to inhibitory effects on the pancreatic beta cell, the hyperglycemic response to photoactivation of VMNSF1 neurons was associated with a marked rise of both plasma corticosterone and glucagon levels (Fig. 4 C and D). By comparison, plasma levels of corticosterone and glucagon did not change in response to photoactivation of the VMN in either VMNLepRb or VMNControl mice (Fig. 4 C and D). Because increased hepatic glucose production (HGP) figures prominently in the metabolic actions of these hormones, we measured hepatic expression of the key gluconeogenic genes phosphoenolpyruvate carboxykinase (Pepck) and glucose-6-phosphatase (G6Pase). Indeed, expression of both genes was elevated after light exposure in VMNSF1 mice (Fig. 4 E and F). Interestingly, relative to VMNControl mice, hepatic expression of Pepck was also elevated by light exposure of the VMN in VMNLepRb mice, consistent with previous evidence of a role for hypothalamic leptin action in the control of hepatic glucose flux (25, 26), even though this effect occurred in the absence of changes of glycemia or glucoregulatory hormones (Fig. 4E). Collectively, these data suggest that the combination of reduced insulin secretion and increased secretion of corticosterone and glucagon contribute to the hyperglycemic response to VMNSF1 neuronal stimulation and that increased HGP likely contributed to this response.
Identification of Downstream Projections of VMNSF1 Neurons Regulating Glycemia.
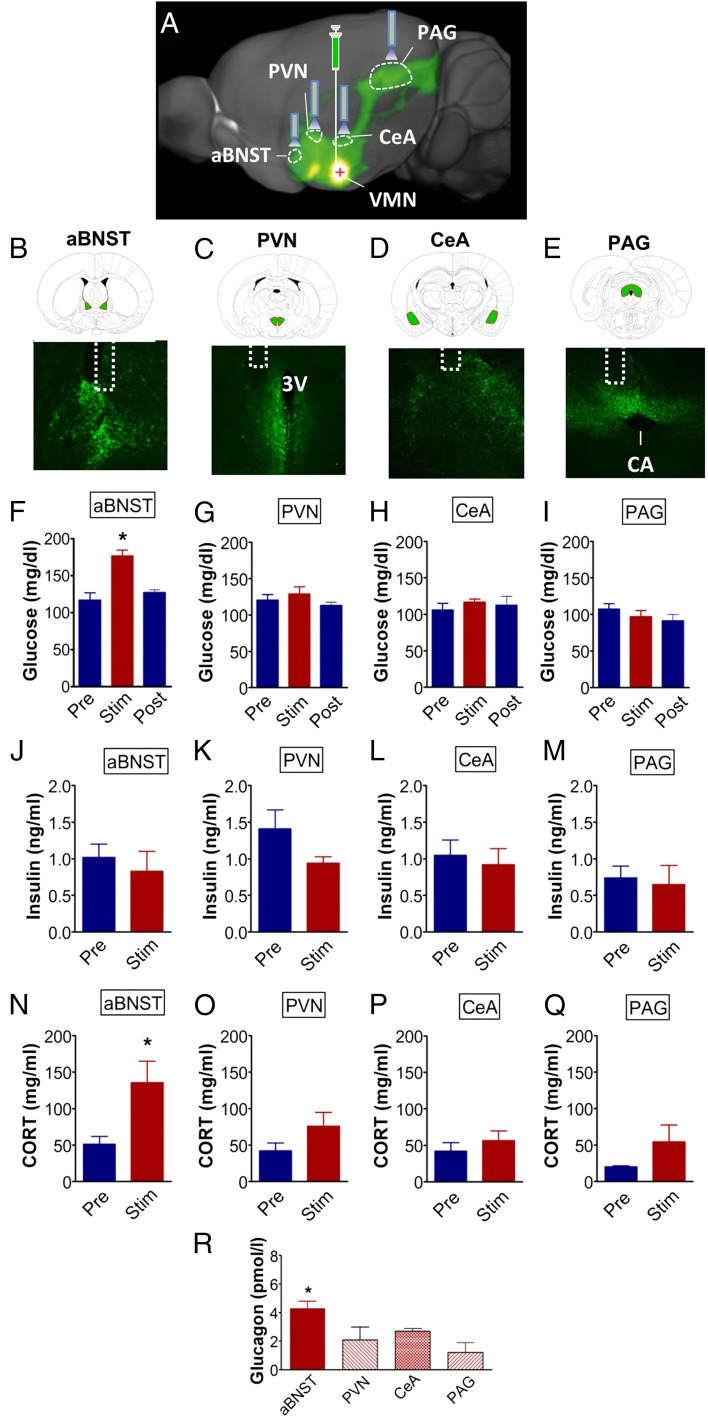
Among brain areas that receive dense projections from VMN neurons are the periaqueductal gray (PAG), the bed nucleus of the stria terminalis (BNST), the central nucleus of the amygdala (CeA), and the hypothalamic paraventricular nucleus (PVN). Each of these brain areas is implicated in autonomic, neuroendocrine, and behavioral regulation and therefore could function within a glucoregulatory circuit involving VMNSF1 neurons (27, 28). To test whether VMNSF1 neurons are among those VMN neurons that project to these four brain areas, we used fluorescently tagged channelrhodopsin to visualize the projection fields. Specifically, AAV5-DIO-ChR2-EYFP was microinjected into the VMN of SF1-Cre+ mice, followed by histological imaging to detect the EYFP reporter in axonal projections (Fig. 5 A–E). Labeled projections of VMNSF1 neurons were detected in both ipsilateral and contralateral PAG, particularly in the dorsal region superior to the cerebral aqueduct. In the BNST, fibers arising from VMNSF1 neurons were detected in the dorsomedial region, along with a dense plexus in the anterior BNST and the anterior-medial subdivision (aBNST). Projections of VMNSF1 neurons were also detected in both the CeA and PVN; in the latter, innervation was particularly robust in medial regions along the border of the third ventricle (Fig. 5 B–E). Because these findings are consistent with previous work using standard tract-tracing methods to detect projections from unspecified VMN neurons (27), the distribution of projections from the subset expressing SF1 does not seem to differ significantly from the population of VMN neurons overall.
Fig. 5.
Photoactivation of VMNSF1→aBNST projections selectively promote hyperglycemia in nondiabetic mice. (A) Schematic showing unilateral stereotaxic microinjection of the Cre-dependent light-activated channelrhodopsin (ChR2-EYFP) virus into the VMN of SF1-Cre+ mice (i.e., VMNSF1 neurons) and implantation of the optic fiber above each of four projection sites in separate cohorts of animals. Image adapted from connectivity.brain-map.org/; experiment ID 182337561. aBNST, anterior bed nucleus of the stria terminalis; CeA, central nucleus of the amygdala; PAG, periaqueductal gray; PVN, paraventricular nucleus; VMN, ventromedial nucleus. Fluorescently labeled projections of channelrhodopsin in VMNSF1 neurons detected in terminal targets including the (B) aBNST, (C) PVN, (D) CeA, and (E) PAG. (Magnification: 4×.) 3V, third cerebral ventricle; CA, cerebral aqueduct. (F–I) Blood glucose, (J–M) plasma insulin, and (N–Q) plasma corticosterone (CORT) levels before (Pre), during (Stim), and 1 h after (Post) photoactivation of VMNSF1 neuron axon projection fields. (aBNST, n = 7; PVN, n = 6; CeA, n = 5; and PAG, n = 6 per group). *P < 0.05 vs. Pre. (R) Plasma glucagon 1 h after photoactivation of each site. *P < 0.05 vs. CeA and PAG; no significant difference from PVN. All data are expressed as mean ± SEM.
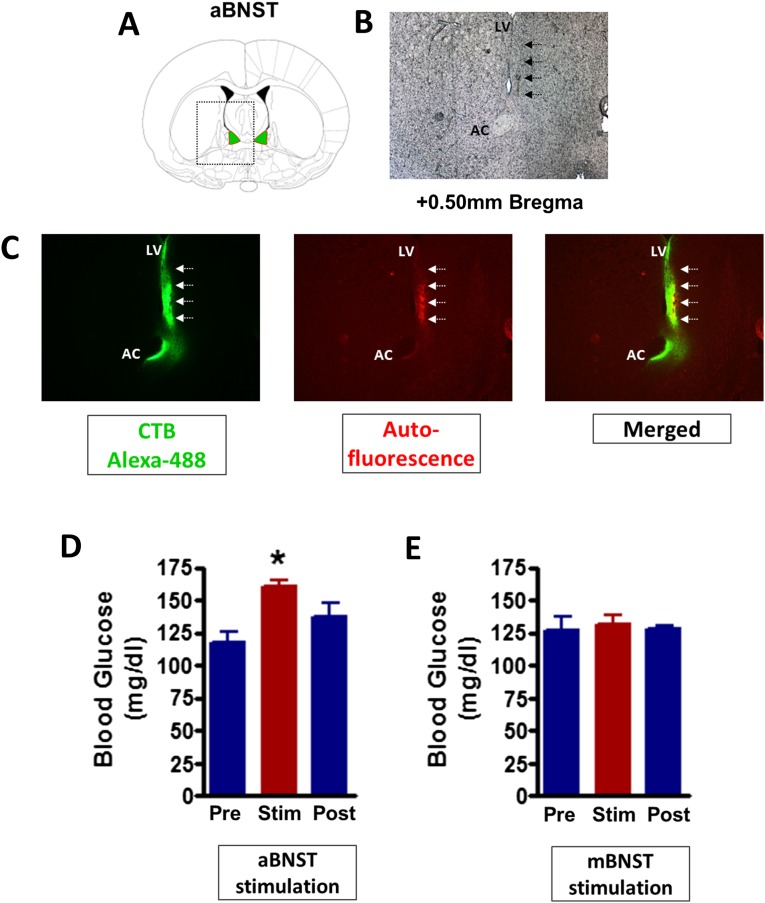
To investigate whether functional connectivity exists between cell bodies of SF1 neurons in the VMN and any of these four downstream innervation sites, we used an optogenetics approach in which a ChR2-expressing virus was unilaterally microinjected into the VMN of SF1-cre+ mice, followed by unilateral implantation of an optic fiber above each of the four projection fields (aBNST, CeA, PAG, and PVN) in separate cohorts of mice. After transport of ChR2 from cell bodies to axons of transduced neurons, the axons can be depolarized by laser stimulation of terminal projections. Six weeks after surgery, stimulation of VMNSF1 axons was achieved using the same 1-h photostimulation protocol described earlier. We found that hyperglycemia was induced after photostimulation of VMNSF1 neuronal projections to the aBNST (VMNSF1→aBNST), but not after stimulation of projections to any of the other three areas (Fig. 5 F–I). To investigate whether this effect was specific to the aBNST, we microinjected the cre-dependent ChR2-EYFP virus into the VMN of a separate cohort of SF1-Cre+ mice and placed the optic fiber above either the aBNST or medial BNST (mBNST). Consistent with our earlier observations, we found that unilateral photoactivation of VMNSF1 projections to the aBNST resulted in hyperglycemia whereas activation of projections to the mBNST had no effect on blood glucose levels (Fig. S1). Collectively, these findings suggest that the glucoregulatory subset of SF1 neurons project specifically to the aBNST.
Fig. S1.
Activation of VMN projections selectively to the aBNST induces hyperglycemia. (A) Diagram showing a coronal section of the mouse brain at the level of the aBNST. (B) Representative image (magnified 4×) depicting scar tissue after an intraparenchymal injection at the coordinates used for aBNST fiber placement. (C, Left) Expression of fluorescently labeled neuronal tracer cholera toxin subunit B (CTB) in green at the injection site and along the needle track (indicated by white arrows). CTB infects all neurons (not cre-dependent) at the site of injection and is transported in the retrograde direction. (Middle) Red autofluorescence in the same tissue section, confirming the tissue damage seen under light microscopy. (Right) A merge of green and red filters. AC, anterior commissure; LV, lateral cerebral ventricle. Blood glucose before (Pre), during (Stim), and 1 h after (Post) unilateral (D) anterior BNST and (E) medial BNST stimulation of ChR2-EYFP 6 wk after viral injection into the VMN of SF1-Cre+ mice (n = 4 per group). *P < 0.05 vs. Pre. All data are expressed as mean ± SEM.
Consistent with the interpretation that VMNSF1→aBNST stimulation recapitulates the glycemic response to VMNSF1 neuronal activation, this effect was accompanied by elevated plasma levels of both corticosterone and glucagon (Fig. 5 N and R) and with inhibition of glucose-induced insulin secretion, such that plasma insulin levels did not increase despite the rise of blood glucose concentrations (Fig. 5 F and J). By comparison, no effect on levels of blood glucose, plasma insulin, or plasma glucagon was detected during stimulation of the VMNSF1 neuron fibers supplying the PVN although a nonsignificant increase of plasma corticosterone levels was observed (Fig. 5 F–R). Collectively, these observations implicate the subset of VMNSF1 neurons that project to the aBNST, but not to the PAG, CeA, PVN, or mBNST, as components of a functional glucoregulatory circuit.
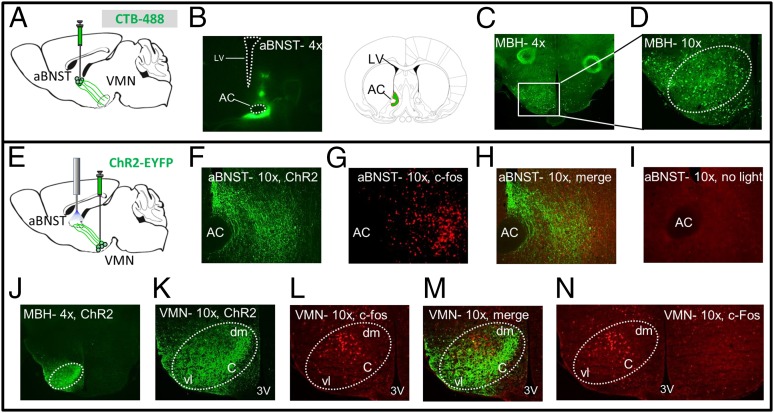
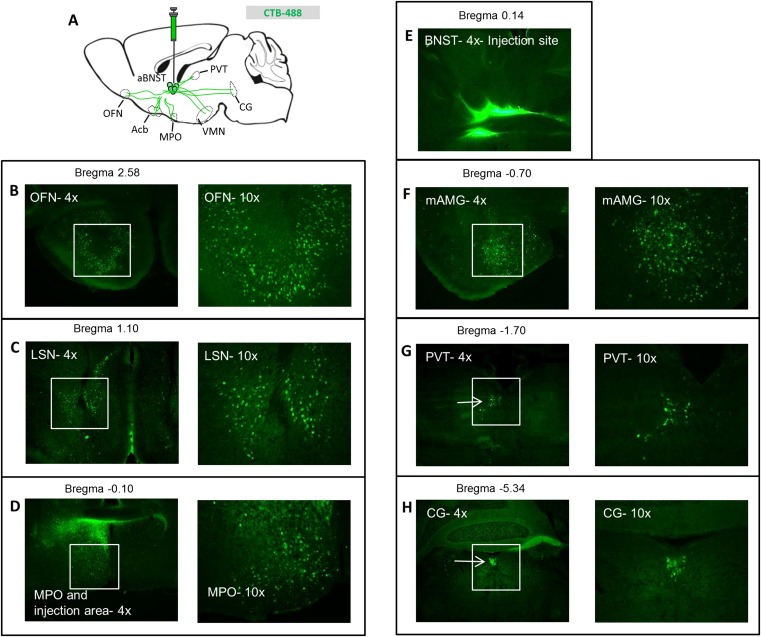
To localize the cell bodies of VMNSF1 neurons that project to the aBNST, we used a two-pronged strategy. First, we injected cholera toxin subunit B (CTB), a fluorescently labeled retrograde neuronal tracer, into the aBNST and examined fluorescence within the VMN (Fig. 6 A and B). As expected, we found dense CTB expression throughout the VMN, supporting previous evidence that axonal projections from neuronal cell bodies in the VMN supply the aBNST (27). CTB was also detected in other mediobasal hypothalamic areas, including the ARC (among other areas) (Fig. S2), consistent with previous evidence (29) that neurons distributed throughout the mediobasal hypothalamus (MBH) project to the BNST (Fig. 6 C and D).
Fig. 6.
Cell bodies of VMNSF1 neurons projecting to the aBNST are located primarily in central and dorsomedial VMN. (A) Diagram showing unilateral stereotaxic microinjection of fluorescently labeled retrograde neuronal tracer cholera toxin subunit B (CTB) into the aBNST of WT mice and (B) expression of the virus at injection site and associated coronal illustration for orientation. AC, anterior commissure; LV, lateral cerebral ventricle. Expression of the fluorescently labeled retrograde neuronal tracer CTB throughout the mediobasal hypothalamus (MBH) at either magnification (C) 4× or (D) 10×. (E) Diagram showing unilateral microinjection of ChR2-EYFP into the VMN of SF1-Cre+ mice followed by 1 h photoactivation of the aBNST projection field. (F) Representative 10× magnification of VMNSF1 projections within the aBNST (green-labeled fibers), with (G) c-Fos (red stain) and the (H) merged image after aBNST photoactivation of VMNSF1projections. (I) Control staining for c-Fos within the aBNST when light treatment was withheld (10× magnification) showing low immunoactivity. (J) Expression of ChR2 within the VMN of SF1-Cre+ mice (4× magnification). (K) Representative images of VMNSF1-infected neurons (green), (L) c-Fos (red), and the (M) merged image after photoactivation of VMNSF1 projections in the aBNST. (Magnification: 10×.) (N) Bilateral view of the VMN showing isolated expression of c-Fos within only the left hemisphere. 3V, third ventricle; c, central; dm, dorsomedial; vl, ventral lateral.
Fig. S2.
Distribution of cholera toxin B throughout the brain after aBNST injection. (A) Schematic of cholera toxin B (CTB) injection into the aBNST of WT mice and tracing of the Alexa-488 fluorophore throughout the brain. See corresponding Fig. 6 for images of mediobasal hypothalamic areas. CTB within (B) the anterior olfactory nucleus (OFN), (C) the lateral septal nucleus (LSN), and (D) the medial preoptic nucleus (MPO) (at both 4× and 10× magnification). (E) CTB at the injection site within the BNST (4× magnification), (F) the medial amygdala (mAMG), (G) the paraventricular thalamic nucleus (PVT), and (H) the central gray (CG) (at both 4× and 10× magnification).
We next identified cell bodies of neurons in the VMN that were activated (as assessed by expression of c-Fos) after photostimulation of axonal projections of VMNSF1 neurons supplying the aBNST (VMNSF1→aBNST) (Fig. 6 E–H). The c-Fos was somewhat widespread after activation of the aBNST projections, mimicking channelrhodopsin expression, with little c-Fos staining observed in the absence of light treatment (Fig. 6I). The resultant c-Fos (+) neurons were concentrated in the central (c) and dorsomedial (dm) regions of the VMN (Fig. 6 J–N), areas previously implicated in metabolic regulation (30, 31). By comparison, few activated neurons were present in the ventrolateral (vl) portion of the VMN, an area associated with reproduction and aggressive behavior (32–35). Together, these findings implicate subsets of SF1 neurons located in central and dorsomedial regions of the VMN in glycemic control (10).
The LPBN Sends Afferents to aBNST-Projecting VMNSF1 Neurons.
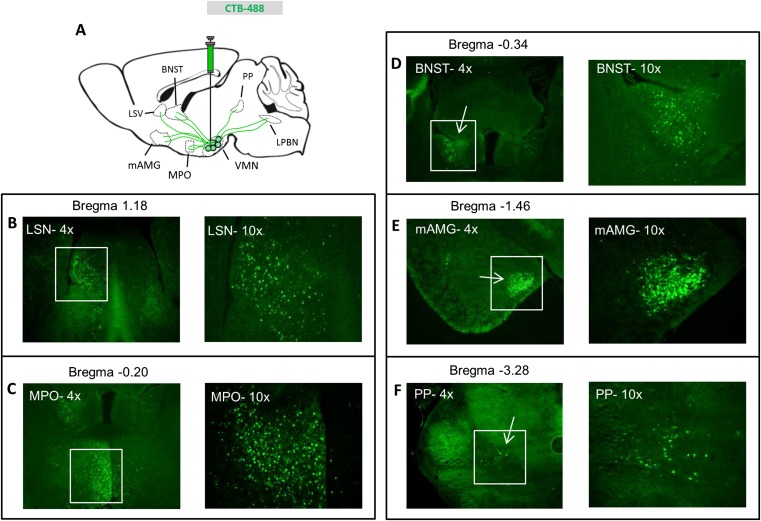
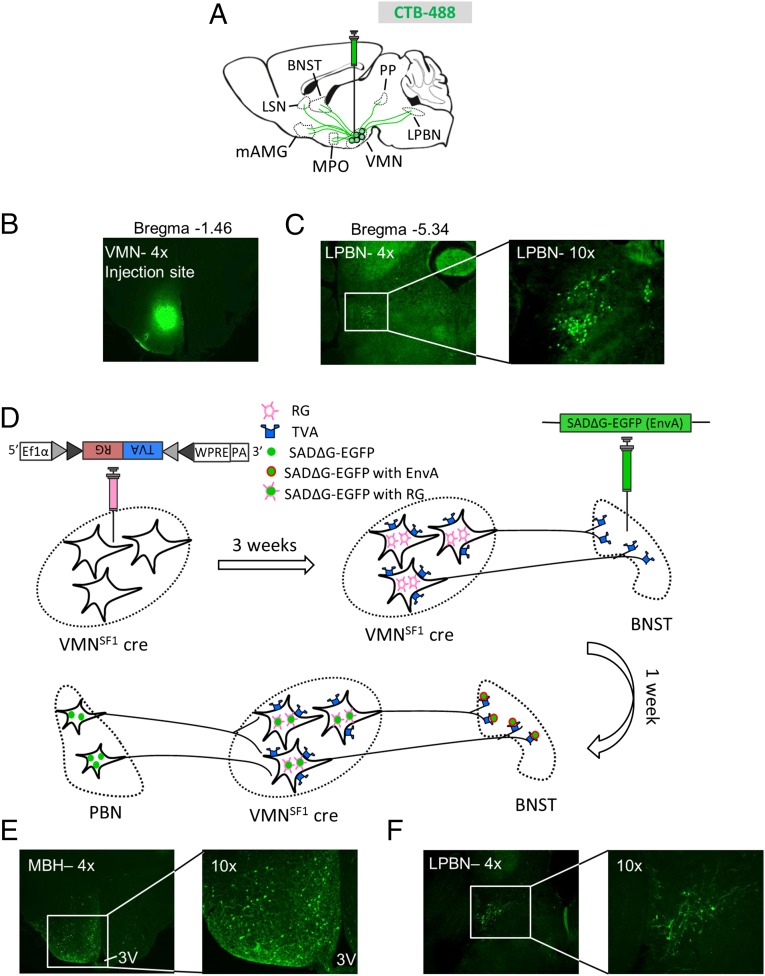
In addition to the VMN, recent evidence suggests that the CRR to hypoglycemia involves a subset of neurons in the LPBN marked by coexpression of leptin receptor and CCK (9, 10). Because these LPBN LepRbCCK neurons also project to the VMN, we sought to determine whether they are anatomically coupled to VMNSF1 neurons identified herein as having a physiological role in glucose counterregulation. To first verify that neurons in the LPBN project to VMN, we injected CTB to the VMN and, 4 d later, examined the brain for alexa-488 fluorescence label. Included among several sites upstream of the VMN identified by this approach were the medial preoptic area, amygdala, and BNST (Fig. S3), as well as the LPBN (Fig. 7 A–C).
Fig. S3.
Distribution of cholera toxin B in upstream brain regions after a VMN injection. (A) Schematic of cholera toxin B (CTB) injection into the VMN of WT mice and tracing of the Alexa-488 fluorophore throughout the brain. See corresponding Fig. 7 for images for lateral PBN. CTB within (B) the lateral septal nucleus (LSN), (C) the medial preoptic nucleus (MPO), (D) the BNST, (E) the medial amygdala (mAMG), and (F) the peripeduncular nucleus (PP) (at both 4× and 10× magnification).
Fig. 7.
aBNST→VMNSF1 afferents originate within the PBN. (A) Schematic of CTB distribution after VMN injection. LPBN, lateral parabrachial nucleus; LSN, lateral septal nucleus; mAMG, medial amygdala; MPO, medial preoptic nucleus; PP, peripeduncular nucleus. (B) Microphotograph of CTB at the injection site within the VMN. (C) Representative image showing the presence of CTB in the lateral PBN 4 d after VMN injection. (Magnification: Left, 4×; Right, 10×.) Additional microphotographs of CTB spread are included in Fig. S3. (D) Diagram showing procedure and timeline of the modified rabies approach (both virus and mode of action). (E) Back propagated modified rabies virus within the VMN from aBNST projecting terminals at 4× (Left) and 10× (Right) magnification. (F) Representative image of modified rabies virus in VMNSF1 afferent neurons found within the LPBN at 4× (Left) and 10× (Right) magnification.
We next sought to determine whether the subset of VMNSF1 neurons that project to the aBNST are synaptically contacted by LPBN neurons. Accomplishing this goal was made possible through the use of a two-virus strategy. The first virus is a modified rabies viral construct, SADΔG-EGFP, engineered to lack the gene encoding rabies glycoprotein G that is required for transsynaptic spread (36), and packaged in a single envelope glycoprotein (EnvA). The second virus is a Cre-dependent AAV-expressing TVA construct (that expresses the receptor for the avian sarcoma leucosis virus glycoprotein, EnvA) linked with RG (rabies envelope glycoprotein) using a 2A-cleavage peptide, AAV8-DIO-TVA-RG (TVA-RG). With this strategy, microinjection of TVA-RG into the VMN of SF1-Cre+ mice selectively renders VMNSF1 neurons (i) uniquely susceptible to infection by EnvA and (ii) capable of retrograde monosynaptic spread due to the presence of RG (Fig. 7D). By subsequently injecting the SADΔG-EGFP virus (EnvA) into the aBNST of the same mice, infection by the latter virus is restricted initially to VMNSF1 terminals projecting to this region previously transfected by the TVA-RG virus. Subsequently, the SADΔG-EGFP virus is able to cross a single synapse and thereby infect neurons upstream of aBNST-projecting VMNSF1 neurons.
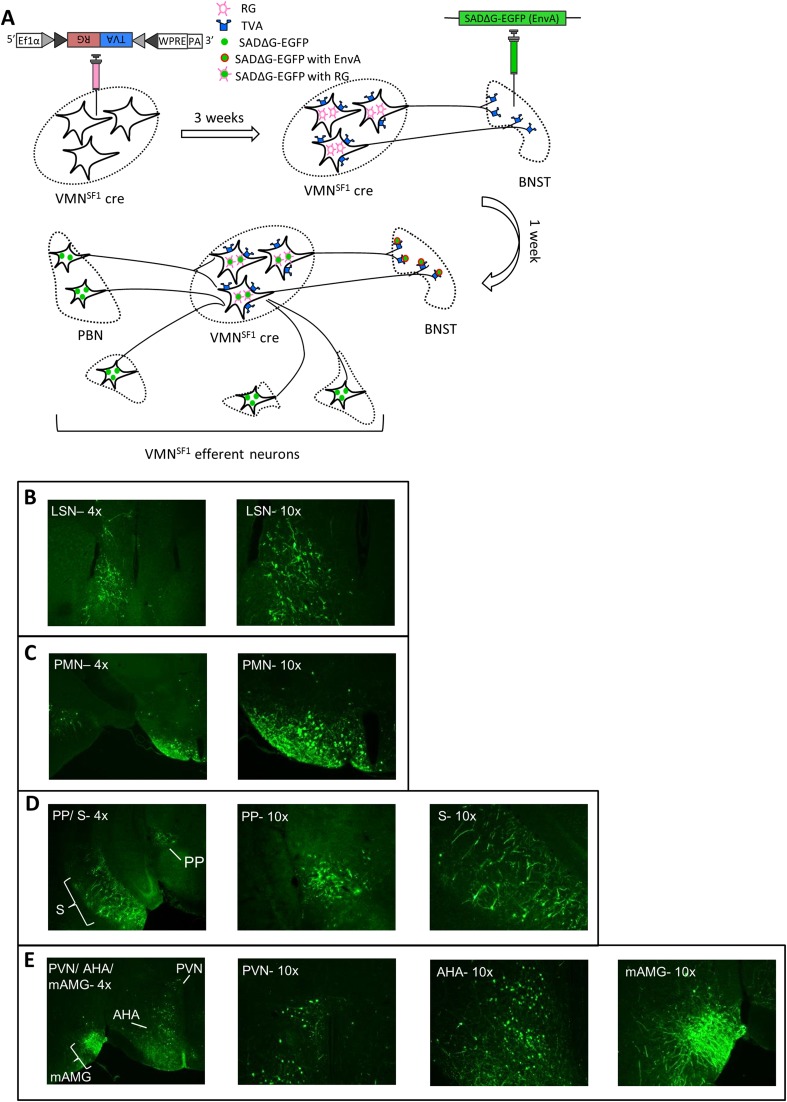
As expected, analysis of the brains of these mice revealed large numbers of EGFP (+) cells in the VMN, potentially representing not only those VMNSF1 neurons initially infected with TVA-RG but also local VMN cells that synapse onto these neurons (Fig. 7E). We also detected EGFP (+) neurons in the LPBN as well as several other brain regions (Fig. S4). Specifically, labeled neurons within the PBN were limited to the external, central, and ventral aspects of the LPBN, with none detected in either the superior LPBN or the medial PBN (Fig. 7F). These observations demonstrate that a subset of LPBN neurons make synaptic connections with those VMNSF1 neurons that project to the aBNST.
Fig. S4.
Distribution of rabies virus throughout the brain after infection of aBNST-VMNSF1 efferent neurons. (A) Schematic of rabies virus procedure and outcome. See corresponding Fig. 7 for images of VMNSF1 efferent neurons located within the LPBN. Rabies virus within (B) the lateral septal nucleus (LSN) (4× and 10×), (C) the premammillary nucleus (PMN) (4× and 10×), (D) the peripeduncular nucleus (PP), and subiculum (S) (4× and 10×), and (E) the PVN, anterior hypothalamic area (AHA), and the medial amygdala (mAMG) (4× shows all three regions simultaneously, and 10× of each individually).
Discussion
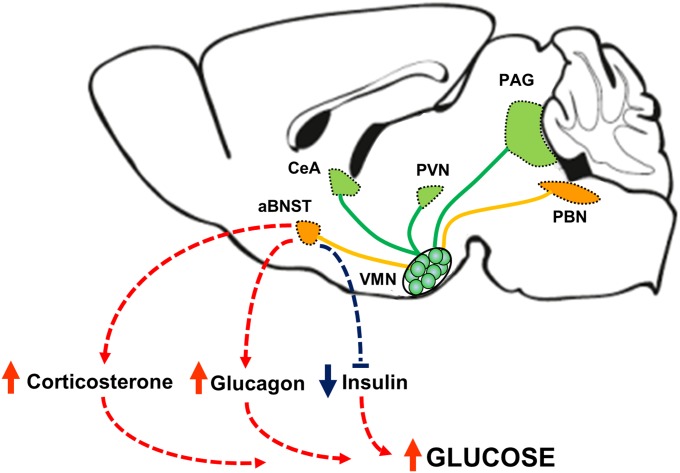
To cope with the brain’s exclusive reliance on glucose as a fuel, a sophisticated system has evolved to detect and respond to the threat posed by reduced glucose availability. The brain clearly plays a central role in this regulatory system, and, whereas previous studies have implicated a role for the VMN, the underlying neurocircuitry remains largely unidentified. Here, we report a crucial role for VMNSF1 neurons in the physiological response to hypoglycemia and identify them as part of an ascending glucoregulatory LPBN→VMNSF1→aBNST neurocircuit (Fig. S5). These observations offer direct evidence of a previously unrecognized neurocircuit involved in glycemic control.
Fig. S5.
Model for a physiological role for VMNSF1 neurons in glucose homeostasis. Our data suggest that activation of VMNSF1 neurons is necessary for counterregulatory responses to insulin-induced hypoglycemia, including increases in corticosterone and glucagon secretion and inhibition of glucose-induced insulin secretion. In addition, activation of VMNSF1 neurons is sufficient to elicit hyperglycemia in otherwise normal mice. Moreover, these neurons receive ascending input from neurons in the lateral parabrachial nucleus (LPBN) and in turn control blood glucose levels via projections selectively to the anterior bed nucleus of the stria terminalis (aBNST).
A key finding is that, whereas inhibition of VMNSF1 neurons has no glucose-lowering effect under basal conditions, it severely impairs recovery from hypoglycemia because it blocks the powerful CRRs that normally restore low blood glucose levels into the normal range. Conversely, activation of VMNSF1 neurons in otherwise normal mice causes diabetes-range hyperglycemia because it activates CRRs despite the absence of hypoglycemia. These findings offer compelling, direct evidence that VMNSF1 neurons function as “primary motor output” neurons for raising circulating glucose concentrations in times of need, analogous to the role in food intake played by Agrp neurons situated in the hypothalamic arcuate nucleus. Although relatively inactive in sated mice, Agrp neurons powerfully stimulate feeding when activated in response to depleted fuel stores (37, 38). These neurons are therefore poised to drive positive energy balance to replenish depleted fuel stores but otherwise are relatively inactive. Consequently, inhibition of Agrp neurons has little effect on food intake in sated mice but impairs fasting-induced feeding (17, 18). Thus, inhibition of Agrp neurons has little impact on food intake under usual circumstances but blocks need-based feeding. Similarly, because activation of VMNSF1 neurons causes marked hyperglycemia, it makes physiological sense for these neurons to remain inactive unless blood glucose levels are threatened. In the latter setting, however, inhibition of VMNSF1 neurons has devastating consequences because it blocks the powerful CRRs that normally restore blood glucose levels into the normal range (11, 30), as expected for neurons that function as a primary motor output for raising blood glucose levels when glucose availability is threatened.
Details regarding the cellular phenotype of VMNSF1 neurons involved in this response await further analysis. Recent work has focused on the role of intracellular glucose sensors, neurotransmitters such as gamma-aminobutyric acid (GABA), glutamate, serotonin, and neuropeptides [corticotrophin-releasing hormone (CRH) and urocortins] (1, 30). Most VMNSF1 neurons are glutamatergic (39, 40), and previous evidence points to a role for glutamate release from these neurons in the CRR response (11). However, our data suggest that not all VMNSF1 neurons participate in glucose counterregulation because photoactivation of VMNLepRb neurons, many of which express SF1 and are also glutamatergic (21, 22), was without effect on either glycemia or secretion of counterregulatory hormones. To shed additional light on the subset of VMNSF1 neurons involved in glucose homeostasis, we used fluorescently tagged channelrhodopsin to characterize the circuit architecture. Consistent with previous studies (27), we found that the heaviest projections of VMNSF1 neurons terminate in the PAG, CeA, PVN, and aBNST. Our finding that photostimulation of VMNSF1 neurons that project to the aBNST, but not to the PAG, PVN, CeA, or mBNTS, mimics the glycemic response elicited by VMNSF1 neuronal stimulation offers clear evidence that projections of VMNSF1 neurons to the aBNST contribute to observed effects on glucose homeostasis. Moreover, the glucose-raising effect of VMNSF1→aBNST fiber activation was accompanied by hormonal responses similar to that induced by stimulation of VMNSF1 cell bodies, including increases of plasma glucagon and corticosterone levels and inhibition of glucose-stimulated insulin secretion. Collectively, these observations implicate axonal projections to the aBNST in the glycemic response observed after photostimulation of VMNSF1 cell bodies.
Our finding that photostimulation of VMNSF1→aBNST axons induces activation of VMNSF1 neuron cell bodies predominantly in the dmVMN and cVMN, and not the vlVMN, is consistent with established evidence implicating the dmVMN and cVMN in autonomic control of metabolism whereas neurons in the vlVMN participate in the control of aggression and reproduction (33–35). These findings collectively support the hypothesis that VMNSF1 neurons involved in glucose homeostasis (i) are located in dmVMN and cVMN, (ii) project to the aBNST, and (iii) are distinct from those neurons expressing leptin receptors.
In addition to the VMN, recent work implicates a subset of neurons situated in the LPBN in the CRR to hypoglycemia. These LPBN neurons express both leptin receptor and CCK, and, like photoactivation of VMNSF1 neurons, pharmacogenetic activation of LPBN LepRbCCK neurons raises blood glucose levels in association with increased secretion of glucagon and corticosterone. Conversely, inhibition of LPBN LepRbCCK neurons blunts the glycemic response to glucoprivation (9, 10), an effect resembling the consequences of optogenetic silencing of VMNSF1 neurons during insulin-induced hypoglycemia in the current studies. Because these LPBN LepRbCCK neurons project to the dmVMN and cVMN and because the induction of CRRs after activation of PBN LepRbCCK neurons is attenuated by pharmacogenetic inhibition of VMNSF1 neurons (10), we hypothesized that the former neurons provide ascending, stimulatory input to the subset of VMNSF1 neurons that project to the aBNST.
In support of this hypothesis, we found that aBNST-projecting VMNSF1 neurons are synaptically connected to neurons in the LPBN, among other regions. These data offer direct evidence in support of an LPBN→VMNSF1→aBNST neurocircuit involved in glycemic regulation, and we anticipate that future studies will demonstrate that LepRbCCK neurons are among those LPBN neurons involved in this circuit. Interestingly, several areas additional to the LPBN send afferents to the subset of VMNSF1 neurons that project to the aBNST. How this information is processed and the extent to which these projections contribute to glucose homeostasis are questions that await additional study.
The liver plays a key role as the primary source of circulating glucose mobilized by CRRs to hypoglycemia. Activation of the hypothalamic-pituitary-adrenal (HPA) axis and increased glucagon secretion (41) each raise blood glucose levels by increasing HGP via increases of both glycogenolysis and gluconeogenesis. The latter can be assessed indirectly by the expression of the hepatic gluconeogenic genes G6Pase and Pepck, and we found that hyperglycemia induced by photoactivation of VMNSF1 neurons is associated with increased hepatic expression of both genes, suggesting that increased hepatic gluconeogenesis may have contributed to hyperglycemia elicited by photoactivation of VMNSF1 neurons. Consistent with this hypothesis, we found that the glycemic excursion in response to a pyruvate challenge was also markedly increased by photoactivation of VMNSF1 neurons.
Additional evidence of a role of the VMN in these responses (42, 43) includes the finding that electrical stimulation of the mediobasal hypothalamus elicits hyperglycemia (6), driven in part by increased glucagon secretion (44). Similarly, glucagon release is triggered by administration of 2-deoxyglucose (2-DG) locally into the VMN to induce neuroglucopenia in this brain area (45). Conversely, the glucagon response to systemic hypoglycemia is blocked by intra-VMN administration of glucose (7) and in rats with bilateral VMH lesions (46). Combined with our findings that photoinhibition of VMNSF1 neurons blocks the plasma glucagon and corticosterone response to hypoglycemia, whereas photoactivation of these neurons has the opposite effect, we conclude that a neuronal network involving VMNSF1 neurons is critically involved in the CRR to hypoglycemia.
In addition to increased counterregulatory hormone secretion, plasma insulin levels were unchanged during photoactivation of VMNSF1 neurons, despite an associated, dramatic increase of blood glucose levels. Although this failure to raise plasma insulin levels may seem unimpressive, the observed increase of blood glucose constitutes a powerful stimulus to insulin secretion, and increased SNS outflow to the pancreas is among very few mechanisms capable of blocking this response in normal animals. From a teleological perspective, it makes intuitive sense that, when glucose availability is threatened, responses that increase glucose production would be activated (e.g., elevated glucagon and corticosterone levels) in concert with responses that reduce glucose clearance (e.g., inhibition of insulin secretion), and much of the literature indicates that pancreatic beta cells are subject to inhibitory control via the sympathetic nervous system (SNS) (47, 48). For example, bilateral VMN lesioning induces hyperinsulinemia (49, 50) whereas electrical stimulation of the VMN suppresses glucose-induced insulin secretion (51). Further, the VMN is known to regulate autonomic outflow to the pancreas (52, 53), and activation of islet sympathetic nerves during glycopenic stress (54) inhibits insulin secretion via a mechanism involving activation of α2-adrenoreceptors on the beta cell (47, 48). However, the neurocircuitry that underlies inhibitory control of insulin secretion by the brain remains unknown.
In conclusion, we report that optogenetic silencing of VMNSF1 neurons profoundly impairs recovery from insulin-induced hypoglycemia by blocking powerful neuroendocrine and autonomic components of the CRR. These findings offer unambiguous evidence that activation of VMNSF1 neurons is required for effective glucose counterregulation. At the same time, tonic inhibition of these neurons seems to be permissive for maintenance of glucose homeostasis under usual conditions because photoactivation of VMNSF1 neurons rapidly induces diabetes-range hyperglycemia with impaired glucose tolerance, owing to a combination of increased CRR hormone secretion and inhibition of glucose-induced insulin secretion. A subset of VMNSF1 neurons that project to the aBNST and are anatomically linked to upstream neurons in the LPBN are implicated in this glucoregulatory neurocircuit. An improved understanding of the functional organization of this neurocircuit may help to identify future strategies for prevention of both insulin-induced hypoglycemia and hypoglycemic unawareness, two of the most common and costly complications of diabetes treatment (55).
Experimental Procedures
Animals.
All procedures were performed in accordance with NIH guidelines for the care and use of animals and were approved by the Animal Care Committee at the University of Washington. All studied animals were individually housed in a temperature-controlled room with a 12:12-h light:dark cycle under specific-pathogen free (SPF) conditions and provided with ad libitum access to water and chow unless otherwise stated (PMI Nutrition). SF1-cre mice (approved mouse gene name, Nr5a1) have been generated and described previously (21, 22) and were bred in our colony (56) whereas Lepr-IRES-Cre mice were purchased from The Jackson Laboratory (stock no. 008320).
Viral Generation, Injections, and Fiber Placement.
The viral vectors AAV5-EF1α-DIO-hChR2(H134R)-EYFP and AAVDJ8-EF1α-DIO-SwiChRCA-TS-EYFP-WPRE used in these studies have been described previously (57–59). All viruses were packaged at the Gene Therapy Center at the University of North Carolina, except the SwiChR2 virus, which was packaged into a DJ8 AAV vector by the University of Washington Diabetes Research Center Viral Vector and Transgenic Mouse Core. The Cre-inducible EF1α-DIO-SwiChRCA-TS-EYFP-WPRE construct was kindly provided by Karl Deisseroth (Stanford University, Stanford, CA) (57). Details regarding stereotaxic delivery of viruses to specific brain areas is provided in SI Experimental Procedures.
Optogenetic in Vivo Photostimulation and Photoinhibition.
Optogenetic studies were supported by the Nutrition Obesity Research Center (NORC) Energy Balance and Glucose Metabolism Core at the University of Washington. For delivery of light pulses with millisecond precision, the output beam from a diode laser (473 nm, DPSS continuous wave laser system; Laserglow) was controlled using an AMPI Master-9 stimulator (Laserglow) through a single fiber port (17, 60). The light was then split using multimode optical fibers with a 200-nm diameter core, N.A. 0.22 (Thor Laboratories), and passed through a fiber optic rotary joint (Thor Laboratories). A terminal fiber attached to the rotary joint was fixed to a 230-µm-bore ceramic ferrule and a mating sleeve that allowed delivery of light to the brain through coupling with a 200-nm ferrule-capped fiber implanted within the mouse brain.
Unless otherwise indicated, for all in vivo photostimulation experiments, 5-ms pulses, 40 pulses per 1 s, were used for 1 h, which is slightly higher than the traditional stimulation patterns used with electrical activation of the VMN (6, 61). Photoinhibition experiments used a constant beam of light for 1–2 h as indicated for each experiment. Irradiance at target regions was estimated at 21 mW/mm2 for photostimulation and 10 mW/mm2 for photoinhibition experiments based upon the previously described relationship of light scattering in the brain of mammals with light power exiting the fiber tip corresponding to 8 mW and 4 mW for activation and inhibition, respectively (web.stanford.edu/group/dlab/cgi-bin/graph/chart.php). The nature of the numerical aperture (N.A. 0.22), a measurement dictating the range of angles light is transmitted along, allowed a greater depth of light penetration into tissue while resulting in a narrow illumination cone. Based on these calculations and the placement of the optic fiber (0.4 mm dorsal to the VMN), the intensity of light reaching the lateral ventral portion of the VMN likely approached the minimum threshold to result in regular burst firing (1 mW/mm2) (12). However, in regions that receive an asymmetrical distribution of VMN terminals along a transverse plane, the stimulation of fibers adjacent rather than directly below the fiber would have been limited.
Viral Track-Tracing Studies.
To investigate the origin of BNST or VMN afferent projections, 150 nL of 1 mg/mL cholera toxin b subunit conjugated with Alexa dye 488 (CTB-488; Life Technologies) in PBS was injected into the region of interest at 50 nL/min. Animals were perfused 4 d after injections to harvest brains for histological analysis.
For retrograde rabies-tracing studies, a modified rabies viral construct, AAV-DIO-TVA-RG (TVA-RG), serotype 8, was injected unilaterally into the VMN (200 nL) of 7- to 8-wk-old mice (titer 1.1 × 10¹² genome copies per milliliter). Twenty-one days later, SADΔG-EGFP (EnvA) rabies was unilaterally injected into the aBNST (100 nL), followed by a 10-min wait. One week after SADΔG-EGFP (EnvA) rabies injection, mice were perfused, and brains were mounted for sectioning as described below.
Metabolic Studies and Tissue Processing.
Intraperitoneal glucose tolerance tests (GTTs) (2 g/kg body weight) or pyruvate tolerance tests (PTTs) (2 g/kg body weight) were conducted in 6-h fasted animals. Tail vein blood was collected for measurement of blood glucose levels at the times indicated and as described in the SI Experimental Procedures.
Immunohistochemistry and RT-PCR.
Details for immunostaining and gene expression estimation can be found in SI Experimental Procedures and as previously described (62, 63).
Statistical Analyses.
All results are presented as means ± SEM. Statistical analyses were performed using PASW Statistics (version 18; IBM SPSS). P values for pair-wise comparisons were calculated by two-tailed Student’s t test. Data for comparisons across more than two groups were analyzed using a one-way ANOVA with post hoc comparisons, where appropriate. Time course comparisons between groups were analyzed using a two-way repeated-measures ANOVA with main effects of light (laser on/off) and time (6–8 instances). All post hoc comparisons were determined using Sidak’s correction for multiple comparisons. In all instances, probability values of <0.05 were considered significant.
SI Experimental Procedures
Viral Generation, Injections, and Fiber Placement.
Animals were placed in a stereotaxic frame (Kopf 1900; Cartesian Research Inc.) under isoflurane anesthesia, and the skull was exposed via a small incision. A small hole was drilled for unilateral 400-nL injection volume of AAV5-EF1α-DIO-hChR2(H134R)-EYFP or AAVDJ8-EF1α-DIO-SwiChRCA-TS-EYFP-WPRE virus as previously described (62, 64) using a Hamilton syringe (80030) with a 33-gauge needle at a rate of 100 nL/min (Micro4 controller) followed by a 7-min wait before needle withdrawal. All injections were directed toward the VMN of SF1-Cre (VMNSF1), Lepr-IRES-Cre (VMNLepRb), or WT littermate control mice (VMNControl) at stereotaxic coordinates from bregma based on coordinates from the Mouse Brain Atlas (65): anterior-posterior (AP), −1.4 mm; lateral, 0.5 mm right side only, dorsal-ventral (DV), 5.3 mm. After viral injections, the fiber-ferrule was then placed above the VMN (AP, −1.4 mm; lateral, 0.5 mm right side only, DV, 4.9 mm). For postoperative care, mice were injected intraperitoneally with buprenorphine hydrochloride (0.05 mg/kg; Reckitt Benckiser). Mice were then allowed 2 wk to recover and acclimated to handling for 1 wk before the start of any in vivo studies. Fiber placement was verified in all animals in which glucose metabolic data were generated, and any data from animals in which the fiber was located outside the targeted area were excluded from the analysis.
Metabolic Studies.
To investigate the effect of selective activation or inhibition of VMN neurons on glycemic control, we used a 3-h approach with alternating light off/on sequences in SF1-Cre (VMNSF1), Lepr-IRES-Cre (VMNLepRb), and WT littermate control mice (VMNControl) mice. After a week of acclimation, food was removed, and mice were attached to a tethering cable for 1 h. Blood glucose was then determined using a hand-held glucometer (FreeStyle) obtained from tail capillary samples during a prestimulus baseline (pre), at the end of the 1-h photostimulation or -inhibition period and again 1 h poststimulus (post). Additional larger blood sample volumes were also collected for measures of plasma insulin, corticosterone, and glucagon.
Intraperitoneal glucose tolerance tests (GTTs) (2 g/kg body weight) or pyruvate tolerance tests (PTTs) (2g/kg body weight) were conducted in 6-h fasted animals. Tail vein blood was collected for measurement of blood glucose levels at −15, 0, 15, 30, 60, 90, and 120 min using a hand-held glucometer. For insulin-induced hypoglycemia studies, mice were fasted for 6 h, followed by i.p. injection of insulin (1.2–1.6 U/kg body weight depending on the experiment; Humulin, Eli Lilly). Blood glucose levels were measured at −15, 0, 15, 30, 60, 90, and 120 min from the tail vein after insulin injection (64, 66, 67).
Blood Collection and Tissue Processing.
At study completion, after 1 h of light photostimulation or -inhibition, animals were decapitated, trunk blood was collected in appropriately treated tubes, and liver samples were harvested. Blood samples were centrifuged, and the plasma was removed, aliquotted, and stored at −80 °C for subsequent assay whereas liver samples were immediately frozen on dry ice and kept at −80 °C. Plasma insulin (Crystal Chem), corticosterone levels (Alpco), and glucagon (Mercodia) were determined by ELISA.
Immunohistochemistry.
For brain immunohistochemical (IHC) studies, anesthetized animals were perfused with PBS followed by 4% (vol/vol) paraformaldehyde (PFA) in 0.1 M PBS. Brains were removed, postfixed in 4% PFA, sucrose (25%)-embedded, and snap-frozen in isopentane cooled with dry ice. Brains were sectioned at 25 µM in the coronal plane throughout the region of interest, slide-mounted, and stored at −80 °C for IHC staining.
c-Fos immunostaining was carried out on perfused-fixed sections as previously published (62, 63). Briefly, slides were washed at room temperature with Tris PBS (TBS) followed by a blocking buffer (5% normal goat serum in 10 mM PBS) for 90 min, and by additional buffer washes. The primary antibody was rabbit polyclonal anti–c-Fos (Calbiochem) diluted 1:5,000 in 0.1% BSA in 10 mM PBS, and the secondary antibody was donkey anti-rabbit Alexa 594 (Jackson ImmunoResearch Laboratories) diluted 1:200 in 0.1% BSA in 10 mM PBS. eYFP was enhanced with a goat polyclonal antibody (Fitzgerald) diluted 1:1000 in 0.1% BSA in 10 mM PBS and the secondary antibody was donkey anti-goat Alexa 488 diluted 1:500. Histochemical images were then captured using a Nikon Eclipse E600 upright microscope (Nikon) equipped with a Diagnostic Instruments Spot RT Color digital camera.
RT-PCR.
Total RNA was extracted from liver using TRIzol B according to the manufacturer’s instructions (MRC). RNA was quantitated by spectrophotometry at 260 nm (Nanodrop 1000) and reverse-transcribed with AMV reverse transcriptase (Promega), and real-time PCR was performed on an ABI Prism 7900 HT (Applied Biosystems) as described previously (66). Expression levels of each gene were normalized to a housekeeping gene (18S RNA) and expressed as arbitrary units (A.U.) relative to vehicle controls.
Acknowledgments
We acknowledge the technical expertise provided by Alexis Cubelo, Annelise Paige Matsuo, Justin Ngoc Lam, Loan Nguyen, and Jonathan D. Fischer (University of Washington). This work was supported by National Institutes of Health Grants DK089056 (to G.J.M.), DK083042, DK090320, and DK101997 (to M.W.S.), and DK098853 (to M.G.M.), by NIH K01 Career Development Award DK097859 (to T.H.M.), by the Nutrition Obesity Research Center (NORC Grant DK035816), by the Diabetes Research Center (DRC Grant DK17047), and by Diabetes and Metabolism Training Grants F32 DK097859 and T32 DK0007247 (University of Washington) and the Michigan Diabetes Research Center (DRC Grant DK020572).
Footnotes
The authors declare no conflict of interest.
This article is a PNAS Direct Submission.
This article contains supporting information online at www.pnas.org/lookup/suppl/doi:10.1073/pnas.1521160113/-/DCSupplemental.
References
- 1.Beall C, Ashford ML, McCrimmon RJ. The physiology and pathophysiology of the neural control of the counterregulatory response. Am J Physiol Regul Integr Comp Physiol. 2012;302(2):R215–R223. doi: 10.1152/ajpregu.00531.2011. [DOI] [PubMed] [Google Scholar]
- 2.Brodows RG, Pi-Sunyer FX, Campbell RG. Sympathetic control of hepatic glycogenolysis during glucopenia in man. Metabolism. 1975;24(5):617–624. doi: 10.1016/0026-0495(75)90141-9. [DOI] [PubMed] [Google Scholar]
- 3.Ritter RC, Slusser PG, Stone S. Glucoreceptors controlling feeding and blood glucose: Location in the hindbrain. Science. 1981;213(4506):451–452. doi: 10.1126/science.6264602. [DOI] [PubMed] [Google Scholar]
- 4.Cryer PE. In: Diabetes Mellitus: A Fundamental and Clinical Text. 3rd Ed LeRoith D, Olefsky JM, Taylor SI, editors. Lippincott Williams & Wilkins; Philadelphia: 2004. [Google Scholar]
- 5.Saberi M, Bohland M, Donovan CM. The locus for hypoglycemic detection shifts with the rate of fall in glycemia: The role of portal-superior mesenteric vein glucose sensing. Diabetes. 2008;57(5):1380–1386. doi: 10.2337/db07-1528. [DOI] [PubMed] [Google Scholar]
- 6.Frohman LA, Bernardis LL. Effect of hypothalamic stimulation on plasma glucose, insulin, and glucagon levels. Am J Physiol. 1971;221(6):1596–1603. doi: 10.1152/ajplegacy.1971.221.6.1596. [DOI] [PubMed] [Google Scholar]
- 7.Borg MA, Sherwin RS, Borg WP, Tamborlane WV, Shulman GI. Local ventromedial hypothalamus glucose perfusion blocks counterregulation during systemic hypoglycemia in awake rats. J Clin Invest. 1997;99(2):361–365. doi: 10.1172/JCI119165. [DOI] [PMC free article] [PubMed] [Google Scholar]
- 8.Routh VH. Glucose sensing neurons in the ventromedial hypothalamus. Sensors (Basel) 2010;10(10):9002–9025. doi: 10.3390/s101009002. [DOI] [PMC free article] [PubMed] [Google Scholar]
- 9.Flak JN, et al. Leptin-inhibited PBN neurons enhance responses to hypoglycemia in negative energy balance. Nat Neurosci. 2014;17(12):1744–1750. doi: 10.1038/nn.3861. [DOI] [PMC free article] [PubMed] [Google Scholar]
- 10.Garfield AS, et al. A parabrachial-hypothalamic cholecystokinin neurocircuit controls counterregulatory responses to hypoglycemia. Cell Metab. 2014;20(6):1030–1037. doi: 10.1016/j.cmet.2014.11.006. [DOI] [PMC free article] [PubMed] [Google Scholar]
- 11.Tong Q, et al. Synaptic glutamate release by ventromedial hypothalamic neurons is part of the neurocircuitry that prevents hypoglycemia. Cell Metab. 2007;5(5):383–393. doi: 10.1016/j.cmet.2007.04.001. [DOI] [PMC free article] [PubMed] [Google Scholar]
- 12.Aravanis AM, et al. An optical neural interface: In vivo control of rodent motor cortex with integrated fiberoptic and optogenetic technology. J Neural Eng. 2007;4(3):S143–S156. doi: 10.1088/1741-2560/4/3/S02. [DOI] [PubMed] [Google Scholar]
- 13.Ollmann MM, et al. Antagonism of central melanocortin receptors in vitro and in vivo by agouti-related protein. Science. 1997;278(5335):135–138. doi: 10.1126/science.278.5335.135. [DOI] [PubMed] [Google Scholar]
- 14.Shutter JR, et al. Hypothalamic expression of ART, a novel gene related to agouti, is up-regulated in obese and diabetic mutant mice. Genes Dev. 1997;11(5):593–602. doi: 10.1101/gad.11.5.593. [DOI] [PubMed] [Google Scholar]
- 15.Schwartz MW, Woods SC, Porte D, Jr, Seeley RJ, Baskin DG. Central nervous system control of food intake. Nature. 2000;404(6778):661–671. doi: 10.1038/35007534. [DOI] [PubMed] [Google Scholar]
- 16.Xu Y, Elmquist JK, Fukuda M. Central nervous control of energy and glucose balance: Focus on the central melanocortin system. Ann N Y Acad Sci. 2011;1243:1–14. doi: 10.1111/j.1749-6632.2011.06248.x. [DOI] [PMC free article] [PubMed] [Google Scholar]
- 17.Aponte Y, Atasoy D, Sternson SM. AGRP neurons are sufficient to orchestrate feeding behavior rapidly and without training. Nat Neurosci. 2011;14(3):351–355. doi: 10.1038/nn.2739. [DOI] [PMC free article] [PubMed] [Google Scholar]
- 18.Krashes MJ, et al. Rapid, reversible activation of AgRP neurons drives feeding behavior in mice. J Clin Invest. 2011;121(4):1424–1428. doi: 10.1172/JCI46229. [DOI] [PMC free article] [PubMed] [Google Scholar]
- 19.Ritter S, Li AJ, Wang Q, Dinh TT. The value of looking backward: The essential role of the hindbrain in counterregulatory responses to glucose deficit. Endocrinology. 2011;152(11):4019–4032. doi: 10.1210/en.2010-1458. [DOI] [PMC free article] [PubMed] [Google Scholar]
- 20.Verberne AJ, Sabetghadam A, Korim WS. Neural pathways that control the glucose counterregulatory response. Front Neurosci. 2014;8:38. doi: 10.3389/fnins.2014.00038. [DOI] [PMC free article] [PubMed] [Google Scholar]
- 21.Dhillon H, et al. Leptin directly activates SF1 neurons in the VMH, and this action by leptin is required for normal body-weight homeostasis. Neuron. 2006;49(2):191–203. doi: 10.1016/j.neuron.2005.12.021. [DOI] [PubMed] [Google Scholar]
- 22.Bingham NC, Anderson KK, Reuter AL, Stallings NR, Parker KL. Selective loss of leptin receptors in the ventromedial hypothalamic nucleus results in increased adiposity and a metabolic syndrome. Endocrinology. 2008;149(5):2138–2148. doi: 10.1210/en.2007-1200. [DOI] [PMC free article] [PubMed] [Google Scholar]
- 23.King BM. The rise, fall, and resurrection of the ventromedial hypothalamus in the regulation of feeding behavior and body weight. Physiol Behav. 2006;87(2):221–244. doi: 10.1016/j.physbeh.2005.10.007. [DOI] [PubMed] [Google Scholar]
- 24.Shimazu T, Ishikawa K. Modulation by the hypothalamus of glucagon and insulin secretion in rabbits: Studies with electrical and chemical stimulations. Endocrinology. 1981;108(2):605–611. doi: 10.1210/endo-108-2-605. [DOI] [PubMed] [Google Scholar]
- 25.Gutiérrez-Juárez R, Obici S, Rossetti L. Melanocortin-independent effects of leptin on hepatic glucose fluxes. J Biol Chem. 2004;279(48):49704–49715. doi: 10.1074/jbc.M408665200. [DOI] [PubMed] [Google Scholar]
- 26.Liu L, et al. Intracerebroventricular leptin regulates hepatic but not peripheral glucose fluxes. J Biol Chem. 1998;273(47):31160–31167. doi: 10.1074/jbc.273.47.31160. [DOI] [PubMed] [Google Scholar]
- 27.Canteras NS, Simerly RB, Swanson LW. Organization of projections from the ventromedial nucleus of the hypothalamus: A Phaseolus vulgaris-leucoagglutinin study in the rat. J Comp Neurol. 1994;348(1):41–79. doi: 10.1002/cne.903480103. [DOI] [PubMed] [Google Scholar]
- 28.Saper CB, Swanson LW, Cowan WM. The efferent connections of the ventromedial nucleus of the hypothalamus of the rat. J Comp Neurol. 1976;169(4):409–442. doi: 10.1002/cne.901690403. [DOI] [PubMed] [Google Scholar]
- 29.Weller KL, Smith DA. Afferent connections to the bed nucleus of the stria terminalis. Brain Res. 1982;232(2):255–270. doi: 10.1016/0006-8993(82)90272-4. [DOI] [PubMed] [Google Scholar]
- 30.Chan O, Sherwin R. Influence of VMH fuel sensing on hypoglycemic responses. Trends Endocrinol Metab. 2013;24(12):616–624. doi: 10.1016/j.tem.2013.08.005. [DOI] [PMC free article] [PubMed] [Google Scholar]
- 31.Choi YH, Fujikawa T, Lee J, Reuter A, Kim KW. Revisiting the ventral medial nucleus of the hypothalamus: The roles of SF-1 neurons in energy homeostasis. Front Neurosci. 2013;7:71. doi: 10.3389/fnins.2013.00071. [DOI] [PMC free article] [PubMed] [Google Scholar]
- 32.Falkner AL, Dollar P, Perona P, Anderson DJ, Lin D. Decoding ventromedial hypothalamic neural activity during male mouse aggression. J Neurosci. 2014;34(17):5971–5984. doi: 10.1523/JNEUROSCI.5109-13.2014. [DOI] [PMC free article] [PubMed] [Google Scholar]
- 33.Lee H, et al. Scalable control of mounting and attack by Esr1+ neurons in the ventromedial hypothalamus. Nature. 2014;509(7502):627–632. doi: 10.1038/nature13169. [DOI] [PMC free article] [PubMed] [Google Scholar]
- 34.Lin D, et al. Functional identification of an aggression locus in the mouse hypothalamus. Nature. 2011;470(7333):221–226. doi: 10.1038/nature09736. [DOI] [PMC free article] [PubMed] [Google Scholar]
- 35.Silva BA, et al. Independent hypothalamic circuits for social and predator fear. Nat Neurosci. 2013;16(12):1731–1733. doi: 10.1038/nn.3573. [DOI] [PMC free article] [PubMed] [Google Scholar]
- 36.Wickersham IR, et al. Monosynaptic restriction of transsynaptic tracing from single, genetically targeted neurons. Neuron. 2007;53(5):639–647. doi: 10.1016/j.neuron.2007.01.033. [DOI] [PMC free article] [PubMed] [Google Scholar]
- 37.Morton GJ, Meek TH, Schwartz MW. Neurobiology of food intake in health and disease. Nat Rev Neurosci. 2014;15(6):367–378. doi: 10.1038/nrn3745. [DOI] [PMC free article] [PubMed] [Google Scholar]
- 38.Sternson SM. Hypothalamic survival circuits: Blueprints for purposive behaviors. Neuron. 2013;77(5):810–824. doi: 10.1016/j.neuron.2013.02.018. [DOI] [PMC free article] [PubMed] [Google Scholar]
- 39.Ovesjö ML, Gamstedt M, Collin M, Meister B. GABAergic nature of hypothalamic leptin target neurones in the ventromedial arcuate nucleus. J Neuroendocrinol. 2001;13(6):505–516. doi: 10.1046/j.1365-2826.2001.00662.x. [DOI] [PubMed] [Google Scholar]
- 40.Ziegler DR, Cullinan WE, Herman JP. Distribution of vesicular glutamate transporter mRNA in rat hypothalamus. J Comp Neurol. 2002;448(3):217–229. doi: 10.1002/cne.10257. [DOI] [PubMed] [Google Scholar]
- 41.Cryer PE. Glucose counterregulation in man. Diabetes. 1981;30(3):261–264. doi: 10.2337/diab.30.3.261. [DOI] [PubMed] [Google Scholar]
- 42.Begg DP, Woods SC. Interactions between the central nervous system and pancreatic islet secretions: A historical perspective. Adv Physiol Educ. 2013;37(1):53–60. doi: 10.1152/advan.00167.2012. [DOI] [PMC free article] [PubMed] [Google Scholar]
- 43.Woods SC, Porte D., Jr Neural control of the endocrine pancreas. Physiol Rev. 1974;54(3):596–619. doi: 10.1152/physrev.1974.54.3.596. [DOI] [PubMed] [Google Scholar]
- 44.Nonogaki K, Iguchi A. Role of central neural mechanisms in the regulation of hepatic glucose metabolism. Life Sci. 1997;60(11):797–807. doi: 10.1016/s0024-3205(96)00596-6. [DOI] [PubMed] [Google Scholar]
- 45.Borg WP, Sherwin RS, During MJ, Borg MA, Shulman GI. Local ventromedial hypothalamus glucopenia triggers counterregulatory hormone release. Diabetes. 1995;44(2):180–184. doi: 10.2337/diab.44.2.180. [DOI] [PubMed] [Google Scholar]
- 46.Borg WP, et al. Ventromedial hypothalamic lesions in rats suppress counterregulatory responses to hypoglycemia. J Clin Invest. 1994;93(4):1677–1682. doi: 10.1172/JCI117150. [DOI] [PMC free article] [PubMed] [Google Scholar]
- 47.Ahrén B. Autonomic regulation of islet hormone secretion: Implications for health and disease. Diabetologia. 2000;43(4):393–410. doi: 10.1007/s001250051322. [DOI] [PubMed] [Google Scholar]
- 48.Nonogaki K. New insights into sympathetic regulation of glucose and fat metabolism. Diabetologia. 2000;43(5):533–549. doi: 10.1007/s001250051341. [DOI] [PubMed] [Google Scholar]
- 49.Frohman LA, Bernardis LL. Growth hormone and insulin levels in weanling rats with ventromedial hypothalamic lesions. Endocrinology. 1968;82(6):1125–1132. doi: 10.1210/endo-82-6-1125. [DOI] [PubMed] [Google Scholar]
- 50.Rohner-Jeanrenaud F, Jeanrenaud B. Consequences of ventromedial hypothalamic lesions upon insulin and glucagon secretion by subsequently isolated perfused pancreases in the rat. J Clin Invest. 1980;65(4):902–910. doi: 10.1172/JCI109744. [DOI] [PMC free article] [PubMed] [Google Scholar]
- 51.Dubuc PU, Leshin LS, Willis PL. Glucose and endocrine responses to hypothalamic electrical stimulation in rats. Am J Physiol. 1982;242(3):R220–R226. doi: 10.1152/ajpregu.1982.242.3.R220. [DOI] [PubMed] [Google Scholar]
- 52.Osundiji MA, Evans ML. Brain control of insulin and glucagon secretion. Endocrinol Metab Clin North Am. 2013;42(1):1–14. doi: 10.1016/j.ecl.2012.11.006. [DOI] [PubMed] [Google Scholar]
- 53.Buijs RM, Chun SJ, Niijima A, Romijn HJ, Nagai K. Parasympathetic and sympathetic control of the pancreas: A role for the suprachiasmatic nucleus and other hypothalamic centers that are involved in the regulation of food intake. J Comp Neurol. 2001;431(4):405–423. doi: 10.1002/1096-9861(20010319)431:4<405::aid-cne1079>3.0.co;2-d. [DOI] [PubMed] [Google Scholar]
- 54.Havel PJ, Taborsky GJ., Jr The contribution of the autonomic nervous system to changes of glucagon and insulin secretion during hypoglycemic stress. Endocr Rev. 1989;10(3):332–350. doi: 10.1210/edrv-10-3-332. [DOI] [PubMed] [Google Scholar]
- 55.Frier BM. Hypoglycaemia in diabetes mellitus: Epidemiology and clinical implications. Nat Rev Endocrinol. 2014;10(12):711–722. doi: 10.1038/nrendo.2014.170. [DOI] [PubMed] [Google Scholar]
- 56.Meek TH, et al. Leptin action in the ventromedial hypothalamic nucleus is sufficient, but not necessary, to normalize diabetic hyperglycemia. Endocrinology. 2013;154(9):3067–3076. doi: 10.1210/en.2013-1328. [DOI] [PMC free article] [PubMed] [Google Scholar]
- 57.Berndt A, Lee SY, Ramakrishnan C, Deisseroth K. Structure-guided transformation of channelrhodopsin into a light-activated chloride channel. Science. 2014;344(6182):420–424. doi: 10.1126/science.1252367. [DOI] [PMC free article] [PubMed] [Google Scholar]
- 58.Boyden ES, Zhang F, Bamberg E, Nagel G, Deisseroth K. Millisecond-timescale, genetically targeted optical control of neural activity. Nat Neurosci. 2005;8(9):1263–1268. doi: 10.1038/nn1525. [DOI] [PubMed] [Google Scholar]
- 59.Zhang F, et al. The microbial opsin family of optogenetic tools. Cell. 2011;147(7):1446–1457. doi: 10.1016/j.cell.2011.12.004. [DOI] [PMC free article] [PubMed] [Google Scholar]
- 60.Betley JN, Cao ZF, Ritola KD, Sternson SM. Parallel, redundant circuit organization for homeostatic control of feeding behavior. Cell. 2013;155(6):1337–1350. doi: 10.1016/j.cell.2013.11.002. [DOI] [PMC free article] [PubMed] [Google Scholar]
- 61.Frohman LA, Bernardis LL, Stachura ME. Factors modifying plasma insulin and glucose responses to ventromedial hypothalamic stimulation. Metabolism. 1974;23(11):1047–1056. doi: 10.1016/0026-0495(74)90071-7. [DOI] [PubMed] [Google Scholar]
- 62.Morton GJ, et al. Leptin action in the forebrain regulates the hindbrain response to satiety signals. J Clin Invest. 2005;115(3):703–710. doi: 10.1172/JCI200522081. [DOI] [PMC free article] [PubMed] [Google Scholar]
- 63.Blevins JE, Schwartz MW, Baskin DG. Evidence that paraventricular nucleus oxytocin neurons link hypothalamic leptin action to caudal brain stem nuclei controlling meal size. Am J Physiol Regul Integr Comp Physiol. 2004;287(1):R87–R96. doi: 10.1152/ajpregu.00604.2003. [DOI] [PubMed] [Google Scholar]
- 64.Morton GJ, et al. Leptin regulates insulin sensitivity via phosphatidylinositol-3-OH kinase signaling in mediobasal hypothalamic neurons. Cell Metab. 2005;2(6):411–420. doi: 10.1016/j.cmet.2005.10.009. [DOI] [PubMed] [Google Scholar]
- 65.Franklin KBJ, Paxinos G. 1997. The Mouse Brain in Stereotaxic Coordinates. (Academic, San Diego)
- 66.German JP, et al. Leptin activates a novel CNS mechanism for insulin-independent normalization of severe diabetic hyperglycemia. Endocrinology. 2011;152(2):394–404. doi: 10.1210/en.2010-0890. [DOI] [PMC free article] [PubMed] [Google Scholar]
- 67.German JP, et al. Leptin deficiency causes insulin resistance induced by uncontrolled diabetes. Diabetes. 2010;59(7):1626–1634. doi: 10.2337/db09-1918. [DOI] [PMC free article] [PubMed] [Google Scholar]


