Significance
Terpenoid indole alkaloids are known to be valuable bioactive compounds. In situ RNA hybridization of gene expression of the terpenoid indole alkaloid (TIA) synthetic enzymes has suggested that the TIA metabolic pathway in Catharanthus roseus stem tissue involves the successive metabolic flow of four types of cells: internal phloem-associated parenchyma, epidermal, idioblast, and laticifer cells. It has never been directly determined in which of these cells these TIA intermediates are localized. The present study showed, using both Imaging mass spectrometry (MS) and Single-cell MS, that many kinds of TIA intermediates, including catharanthine and serpentine, were accumulated in idioblast and laticifer cells. The developed methods should prove useful for studying other aspects of secondary metabolism in plants.
Keywords: terpenoid indole alkaloid, Catharanthus roseus, idioblast cell, Imaging MS, Single-cell MS
Abstract
Catharanthus roseus (L.) G. Don is a medicinal plant well known for producing antitumor drugs such as vinblastine and vincristine, which are classified as terpenoid indole alkaloids (TIAs). The TIA metabolic pathway in C. roseus has been extensively studied. However, the localization of TIA intermediates at the cellular level has not been demonstrated directly. In the present study, the metabolic pathway of TIA in C. roseus was studied with two forefront metabolomic techniques, that is, Imaging mass spectrometry (MS) and live Single-cell MS, to elucidate cell-specific TIA localization in the stem tissue. Imaging MS indicated that most TIAs localize in the idioblast and laticifer cells, which emit blue fluorescence under UV excitation. Single-cell MS was applied to four different kinds of cells [idioblast (specialized parenchyma cell), laticifer, parenchyma, and epidermal cells] in the stem longitudinal section. Principal component analysis of Imaging MS and Single-cell MS spectra of these cells showed that similar alkaloids accumulate in both idioblast cell and laticifer cell. From MS/MS analysis of Single-cell MS spectra, catharanthine, ajmalicine, and strictosidine were found in both cell types in C. roseus stem tissue, where serpentine was also accumulated. Based on these data, we discuss the significance of TIA synthesis and accumulation in the idioblast and laticifer cells of C. roseus stem tissue.
Alkaloids constitute one of the largest groups of specialized metabolites, many of which have biological functions that are indispensable, not only for plants themselves but also for human health. Approximately 20% of plant species are known to contain alkaloids (1). The significant value of alkaloids as medicines or luxury items in human life has attracted widespread interest from researchers in a range of scientific fields. These researchers have extensively studied how plant-specialized metabolites are produced at cellular and tissue levels (2). The reports indicate that biosynthetic pathways of plant specialized metabolites often involve multiple cell types that are biochemically and morphologically distinct (3, 4).
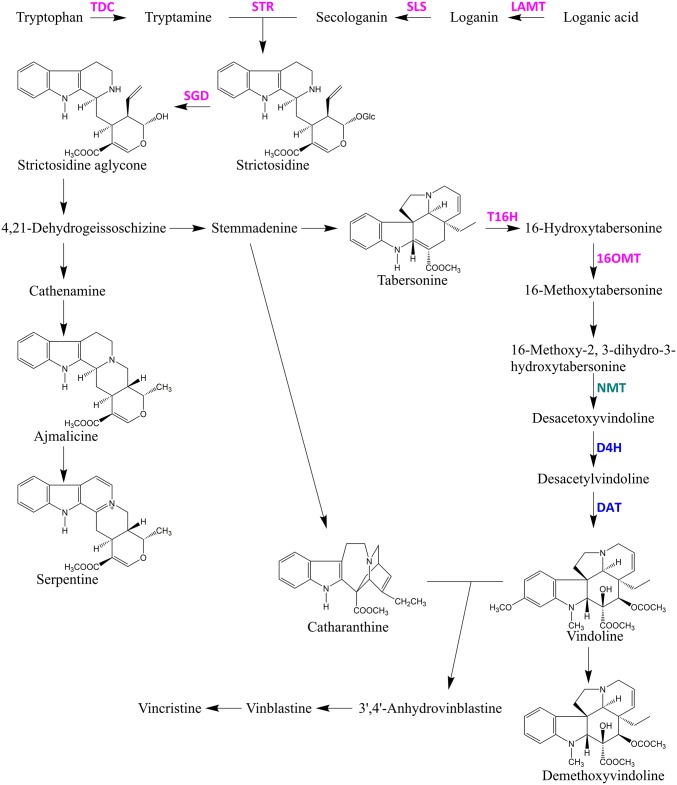
Catharanthus roseus (L.) G. Don (Apocynaceae) is one of the best-characterized terpendoid indole alkaloid (TIA)-producing plants. This plant produces many commercially valuable TIAs, including antitumor drugs such as vinblastine and vincristine (5–7). Since the development of TIAs as antitumor drugs in the 1970s, leaf extracts of C. roseus have been the sole source of vindoline and catharanthine, both of which are monomeric precursors for the commercial production of TIA (8). Extensive studies have revealed that more than 130 TIAs are produced from the central precursor strictosidine in C. roseus (Fig. 1) (9).
Fig. 1.
TIA metabolic pathway in Catharanthus roseus. Purple font represents TIA enzymes localized in ECs. Green represents the TIA enzyme localized in PCs. Blue represents TIA enzymes localized in ICs and LCs. D4H, desacetoxyvindoline 4-hydroxylase; DAT, deacetylvindoline 4-Oacetyltransferase; LAMT, loganic acid O-methyltransferase; NMT, 16-methoxy-2,3-dihydro-3-hydroxy-tabersonine N-methyltransferase; SGD, strictosidine β-glucosidase; SLS, secologanin synthase; STR, strictosidine synthase; T16H, tabersonine 16-hydroxylase; TDC, tryptophan decarboxylase; 16OMT, 16-hydroxytabersonine O-methyltransferase.
TIA metabolism in C. roseus involves more than 20 enzymatic steps and occurs in various cell types, starting from internal phloem-associated parenchyma cells (IPAP cells) through epidermal cells (ECs) to both idioblast cells (ICs) and laticifer cells (LCs) where vindoline and other TIAs are believed to be accumulated (10–12). Cell type-specific localization of TIA metabolic pathways has been primarily inferred indirectly from the results of in situ RNA hybridization and immunocytochemical localization of the pathway enzymes (13). The current understanding, mainly deduced from studies on leaf tissues, is that secoiridoid metabolism begins in IPAP cells and that loganic acid produced in IPAP cells is transferred to ECs. Further synthesis involving secologanin and tryptamine occurs in the ECs. Finally, a TIA intermediate, desacetoxyvindoline, moves to the ICs and LCs, and TIAs are accumulated in the vacuole of those cells (10, 12, 14). In the stem, a similar localization of enzymes of TIA metabolism (TDC, tryptophan decarboxylase; STR, strictosidine synthase; D4H, desacetoxyvindoline 4-hydroxylase; and DAT, deacetylvindoline 4-Oacetyltransferase in Fig. 1) has been proposed (13). Thus far, however, the actual localization of TIA intermediates at the cellular level has not been directly measured in either leaf or stem tissues.
Recently, similar specialized metabolite syntheses have been reported in other plants at the cellular level. For example, polyterpenes are highly accumulated in so-called LCs in rubber trees (Hevea brasiliensis), and enzymes that are responsible for polyterpene biosynthesis have been identified (3). Likewise, a benzylisoquinoline alkaloid morphine is accumulated in LCs in opium poppy (Papaver somniferum). In both cases, cutting the LCs located in the stem and seed capsule in rubber trees and opium poppy, respectively, permits the collection of these valuable plant metabolites. Moreover, proteome analysis of opium poppy shows that enzymes for morphine biosynthesis are localized either in sieve elements or LCs (15–17). These results suggest that the metabolic intermediates in morphine biosynthesis are likely to be shuttled between the two cell types of sieve elements and LCs, and that LCs are metabolically active (16). To understand in detail the metabolic pathways, we need to clearly identify not only the localization of the enzymes but also the localization of these specialized metabolites at the cellular level.
Novel methods for detecting metabolites in situ at the cellular level have been developed. Examples include matrix-assisted laser desorption/ionization imaging mass spectrometry (Imaging MS), which was applied to animal brain sections (18), and desorption electrospray ionization mass spectrometry, which has been applied to many plant species, including C. roseus (19) and Hypericum perforatum (20). These studies succeeded in detecting target metabolites, but the resolution of the mass image was very low. Recent imaging MS revealed localization of many secondary metabolites in the rhizome of Glycyrrhiza glabra, with high resolution of about 20 μm (21). We have also reported the localization of metabolites at the cellular level of Arabidopsis tissues (22).
Another option for analyzing metabolite localization at the cellular level is Single-cell MS, which samples cell contents from a single cell within a tissue using microcapillaries (23). In the Geraniaceae, Pelargonium zonale (L.) L’Hérit, the metabolites from a single cell were measured by video-assisted MS and revealed differences between metabolite contents among cells in different tissues (24).
In the present study, we combined the above two forefront metabolomic techniques, Imaging MS and Single-cell MS, to elucidate cell-specific TIA localization in Catharanthus stem tissue. Stem tissue consists of various cell types that are similar to those in leaf tissue, and in situ RNA hybridization of genes for enzymes involved in TIA metabolism in stems has also been reported (13).
Results
Localization of Idioblast and Laticifer Cells in C. roseus Stem Tissue.
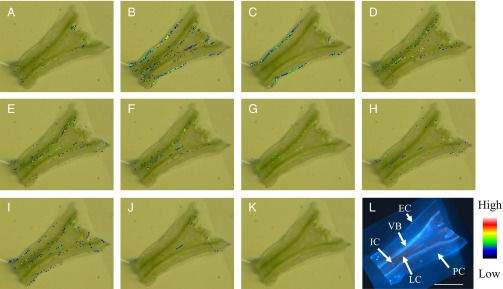
C. roseus stem tissue is composed of various types of cells: IC, LC, parenchyma cell (PC), and EC. IC and LC were easily distinguishable from PC and EC by blue or yellow autofluorescence emitted from the chemical compounds accumulated in these cells when the specimen was excited by UV (25). The blue autofluorescence is most likely due to serpentine (26). In longitudinal sections, ICs were found throughout the stem tissue, whereas short and elongated LCs were localized near the vascular bundles (Fig. 2L and Fig. S1).
Fig. 2.
MS images of C. roseus stem longitudinal section. Most TIA localized in IC and LC; (A) m/z 415.1001 (loganic acid), (B) m/z 429.1157 (loganin), (C) m/z 427.1001 (secologanin), (D) m/z 351.1703 (cathenamine), (E) m/z 353.1859 (ajmalicine), (F) m/z 349.1546 (serpentine), (G) m/z 355.2016 (stemmadenine), (H) m/z 367.2016 (16-methoxytabersonine), (I) m/z 337.1910 (catharanthine), (J) m/z 427.2227 (demethoxyvindoline), (K) MS image control, and (L) longitudinal section excited by UV. Color bar represents MS signal intensity. VB, vascular bundle. (Scale bar, 1 mm.)
Fig. S1.
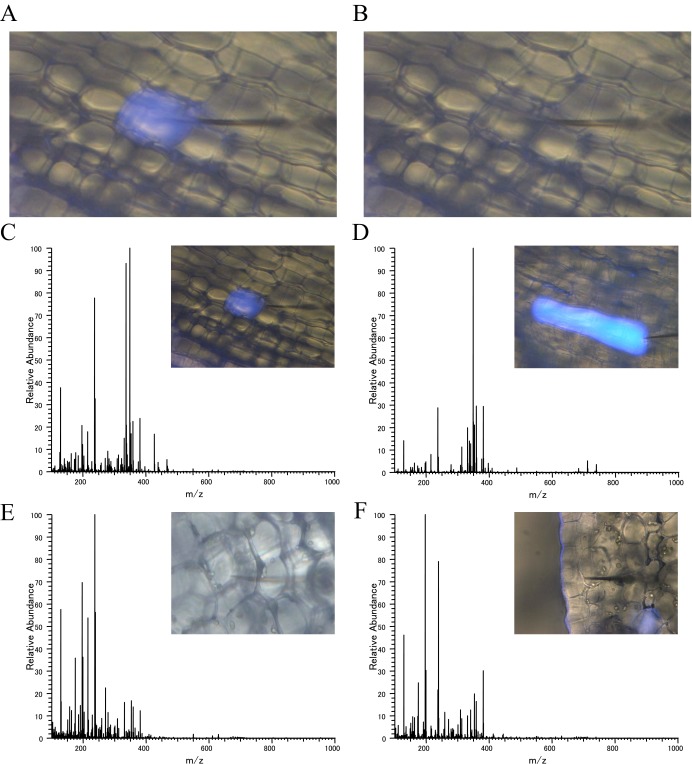
Sampling of the four types of cells’ contents with nano-electrospray tip. (A) IC emitting blue fluorescence under UV excitation, before sampling. (B) The same cell after contents were sucked up with nano-electrospray tip. (C) IC, (D) LC, (E) PC, (F) EC.
TIAs in Stem Tissue.
Liquid chromatography mass spectrometry (LC-MS) analysis of the extracts from whole stem tissue identified mass spectral peaks of various TIAs, including catharanthine, ajmalicine, serpentine, and vindoline (Table S1). Loganic acid, loganin, and secologanin were also detected (Table S2). Some of the peaks were subjected to MS/MS or LC-MS/MS analyses for further confirmation (Figs. S2–S6 and Table S3), and quantitative data were obtained for the main alkaloids in the extracts from both stem tissue and the first leaf tissue (Table S1). In stem tissue, the concentrations were [micrograms per milligram fresh weight (FW)] catharanthine, 0.506 ± 0.044; ajmalicine, 0.071 ± 0.022; serpentine, 0.397 ± 0.031; tabersonine, 0.017 ± 0.003; and vindoline, 0.0026 ± 0.0002.
Table S1.
TIA detected by LC-MS analysis of stem tissue samples
| Molecular formula | [M+H]+ | Measured m/z | Delta, ppm | Stem tissue | Retention time of sample, min | Compound | Retention time of standard, min | Alkaloid content in stem, μg/mg FW | Alkaloid content in leaf, μg/mg FW |
| C21H24N2O2 | 337.191054 | 337.19104 | −0.04 | ○ | 5.96, 7.41, 7.90, 10.63, 13.39, 21.58 | Catharanthine | 10.67 | 0.506 ± 0.044 | 5.199 ± 0.260 |
| C21H24N2O2 | 337.191054 | 337.19080 | −0.75 | ○ | 5.96, 7.41, 7.90, 10.63, 13.39, 21.58 | Tabersonine | 21.47 | 0.017 ± 0.003 | 0.286 ± 0.024 |
| C21H20N2O3 | 349.154668 | 349.15421 | −1.31 | ○ | 6.06 | Serpentine | 6.04 | 0.397 ± 0.031 | 0.037 ± 0.006 |
| C21H22N2O3 | 351.170318 | 351.17023 | −0.25 | ○ | 5.69, 7.41, 7.85, 8.71, 11.02 | ||||
| C21H24N2O3 | 353.185968 | 353.18600 | 0.09 | ○ | 5.77, 6.64, 7.13, 7.52, 8.31, 9.79, 12.11, 13.88 | Ajmalicine | 9.77 | 0.071 ± 0.022 | 0.169 ± 0.007 |
| C21H26N2O3 | 355.201618 | 355.20135 | −0.75 | ○ | 5.77, 6.39, 6.89, 7.41, 10.27, 11.91, 13.20 | ||||
| C22H26N2O3 | 367.201618 | 367.20166 | 0.11 | ○ | 6.75, 8.82, 16.98, 20.13 | ||||
| C21H24N2O4 | 369.180883 | 369.18054 | −0.93 | ○ | 4.87, 5.58, 6.33, 6.89, 7.82 | ||||
| C22H28N2O4 | 385.212183 | 385.21188 | −0.79 | ○ | 6.33, 6.99, 8.23, 9.03, 9.51 | ||||
| C23H30N2O4 | 399.227833 | 399.22714 | −1.74 | ○ | 10.38 | ||||
| C23H30N2O5 | 415.222748 | 415.22238 | −0.89 | ○ | 6.30, 7.63 | ||||
| C24H30N2O5 | 427.222748 | 427.22272 | −0.07 | ○ | 8.82 | ||||
| C25H32N2O6 | 457.233312 | 457.23367 | 0.78 | ○ | 8.23 | Vindoline | 8.24 | 0.0026 ± 0.0002 | 1.6470 ± 0.071 |
| C27H34N2O9 | 531.233706 | 531.23389 | 0.35 | ○ | 5.25 |
○ Denotes that chemical compound exists in the stem tissues (n = 3). Retention time: Mass specific peaks in the stem tissue.
Table S2.
Iridoid detected by LC-MS analysis of stem tissue samples
| Molecular formula | Monoisotopic mass | [M+H]+ (measured m/z) Delta, ppm | Stem tissue [H+] | [M+Na]+ (measured m/z) Delta, ppm | Stem tissue [Na+] | [M+K]+ (measured m/z) Delta, ppm | Stem tissue [K+] | Speculated compound |
| C16H24O10 | 376.136946 | 377.144222 (377.14420) −0.06 | ○ | 399.126164 (399.12619) 0.07 | ○ | 415.100104 (415.10007) −0.08 | ○ | Loganic acid |
| C17H24O10 | 388.136946 | 389.144222 (389.14426) −0.10 | ○ | 411.126164 (411.12631) 0.36 | ○ | 427.100104 (427.10022) 0.27 | ○ | Secologanin |
| C17H26O10 | 390.152597 | 391.159873 (391.15988) 0.02 | ○ | 413.141815 (413.14188) 0.16 | ○ | 429.115755 (429.11603) 0.64 | ○ | Loganin |
○ Denotes that chemical compound exists in the stem tissues (n = 3). Monoisotopic mass was calculated from molecular formula of TIA.
Fig. S2.
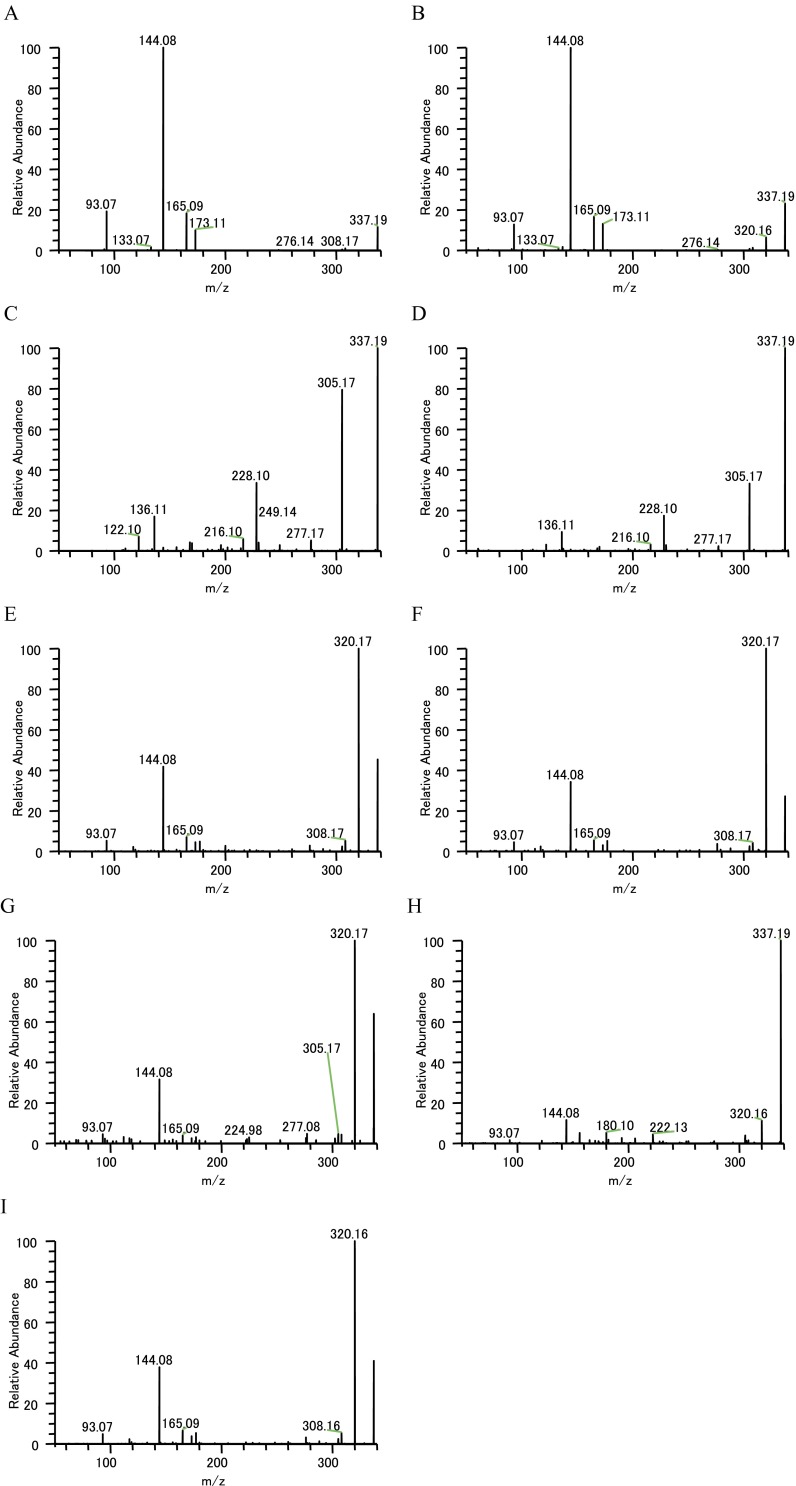
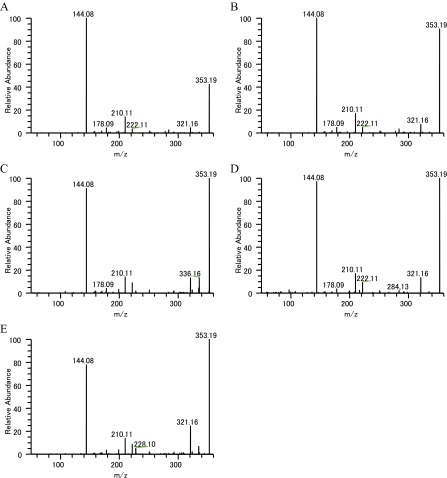
MS/MS analysis of m/z 337.19. (A) Catharanthine standard (LC-MS). (B) Catharanthine standard (infusion). (C) Tabersonine standard (LC-MS). (D) Tabersonine standard (infusion). (E) IC sample (Single-cell MS). (F) LC sample (Single-cell MS). (G) PC (Single-cell MS). (H) EC (Single-cell MS). (I) Stem sample m/z 337.19 specific MS/MS fragment (infusion measurement).
Fig. S6.
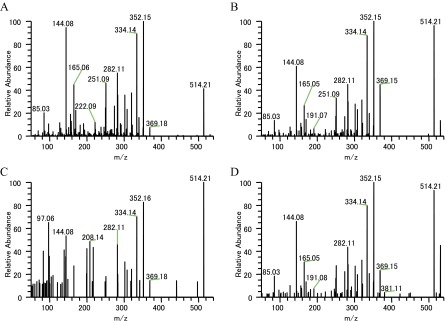
MS/MS analysis of m/z 531.23. (A) Stem sample m/z 531.23 specific MS/MS fragment (LC-MS). (B) IC sample (Single-cell MS). (C) LC sample (Single-cell MS). (D) Stem sample m/z 531.23 specific MS/MS fragment (infusion measurement).
Table S3.
LC-MS/MS analysis of whole stem data
| Compound | [M+H]+ | MS/MS fragments of stem tissue, % | MS/MS fragments of standard, % |
| Catharanthine | 337.191054 | 93.07(18), 133.07(2), 144.08(100), 165.09(18), 173.11(10), 337.19(12) | 93.07(18), 133.07(2), 144.08(100), 165.09(17), 173.11(9), 337.19(12) |
| Tabersonine | 337.191054 | 122.10(6), 136.11(18), 168.08(5), 170.10(4), 216.10(6), 228.10(33), 230.12(4), 249.14(3), 277.17(5), 305.17(76), 337.19(100) | 122.10(7), 136.11(17), 168.08(4), 170.10(4), 216.10(6), 228.10(33), 230.12(4), 249.14(3), 277.17(5), 305.17(81), 337.19(100) |
| Serpentine | 349.154668 | 263.08(7), 295.11(2), 317.13(18), 349.16(100) | 263.08(9), 295.11(2), 317.13(28), 349.16(100) |
| Ajmalicine | 353.185968 | 144.08(100), 178.09(4), 210.11(14), 222.11(21), 321.16(21), 335.18(3), 353.19(56) | 144.08(100), 178.09(4), 210.11(14), 222.11(3), 321.16(5), 353.19(43) |
| Demethoxyvindoline | 427.222748 | 158.10(100), 307.18(5), 325.19(2), 335.17(3), 349.19(2), 367.20(41), 409.21(2), 427.22(11) | 143, 158, 367, 409, 427* |
| Vindoline | 457.233312 | 162.09(3), 188.11(100), 222.11(3), 337.19(4), 397.21(23), 457.23(7) | 162.09(2), 188.11(100), 222.11(3), 337.19(4), 397.21(24), 457.23(8) |
| Strictosidine | 531.233706 | 144.08(93), 165.05(43), 170.10(23), 250.09(25), 251.09(46), 274.12(25), 282.11(55), 283.12(35), 302.12(36), 308.13(23), 320.13(38), 334.14(89), 352.15(100), 514.21(40) | 139.04, 144.08, 165.05, 170.09, 181.09, 222.09, 250.09, 282.12, 302.12, 320.13, 334.14, 352.15, 514.21† |
Imaging MS Analysis.
To study the localization of TIA in the whole stem tissue, we conducted Imaging MS analysis using a longitudinal section of C. roseus stem tissue (Fig. 2). The results showed that monoterpenes, such as loganin (Fig. 2B) and secologanin (Fig. 2C), were localized in EC as reported previously (27).
Although it has been proposed from in situ RNA hybridization experiments that most TIAs are synthesized in EC (13), MS images revealed that various TIAs, including ajmalicine and serpentine, were accumulated not in EC but rather in IC and LC (Fig. 2 D–J). An MS image of m/z 337.19 (a possible candidate is catharanthine; see Fig. 2I) showed that this compound was localized in IC, LC, and EC.
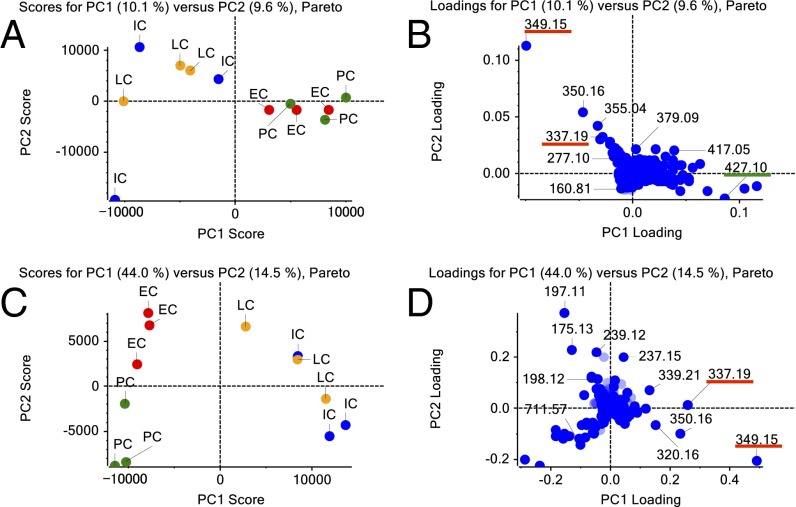
The mass spectrum data of four cell types (IC, LC, PC, and EC) were selected from Imaging MS figures and analyzed by principal component analysis (PCA). The various cell types could be distinguished as different groups. The PCA result showed that IC and LC accumulated similar compounds, which differed from those in PC and EC (Fig. 3A). Loading data for PCA are shown in Fig. 3B.
Fig. 3.
PCA of metabolome data according to cell type. (A) PCA derived from intensities of IC, LC, PC, and EC samples in Imaging MS analysis. (B) PC loadings derived from all m/z peaks of IC, LC, PC, and EC samples in Imaging MS analysis. (C) PCA derived from intensities of IC, LC, PC, and EC samples in Single-cell MS analysis. (D) PC loadings derived from all m/z peaks of IC, LC, PC, and EC samples in Single-cell MS analysis. (B and D) Blue points show monoisotopic and isotope data, and pale blue points show undefined data. Many TIA compounds were detected from IC and LC spectra. Red underbar shows TIA related ion peak. Green underbar shows iridoid related ion peak.
Single-Cell MS Analysis.
To obtain quantitative data of various TIAs that complement the results of Imaging MS, we conducted Single-cell MS on IC, LC, PC, and EC (Fig. S1). The data obtained from the four cell types could also separate the cells into different groups by PCA. The PCA result showed that IC and LC accumulated similar compounds, which differed from those in PC and EC, in agreement with the data from Imaging MS (Fig. 3). We also obtained PC loading data that suggested some alkaloid peaks, such as m/z 337.19 (catharanthine) and m/z 349.15 (serpentine), mainly occur in specific cell types (Fig. 3 C and D).
We conducted target mass analysis of C. roseus TIA using Single-cell MS data (Tables 1 and 2). The mass spectra of IC and LC showed that catharanthine (m/z 337.19) and serpentine (m/z 349.15) were detected in the top 100 peaks in those spectra. Catharanthine (m/z 337.19) was also detected in the mass spectra of PC and EC.
Table 1.
TIA detected by Single-cell MS analysis (mass range m/z = 100–1,000)
| Molecular formula | [M+H]+ | Measured m/z | Delta, ppm | Stem tissue | IC | LC | PC | EC | Speculated compound |
| C21H24N2O2 | 337.191054 | 337.19097 | −0.25 | ○ | ○ | ○ | ○ | ○ | Catharanthine |
| C21H20N2O3 | 349.154668 | 349.15456 | −0.31 | ○ | ○ | ○ | Serpentine | ||
| C21H22N2O3 | 351.170318 | 351.16950 | −2.33 | ○ | ○ | ○ | Cathenamine | ||
| C21H24N2O3 | 353.185968 | 353.18578 | −0.53 | ○ | ○ | ○ | Ajmalicine | ||
| C21H26N2O3 | 355.201618 | 355.20129 | −0.92 | ○ | ○ | ○ | Stemmadenine | ||
| C22H26N2O3 | 367.201618 | 367.20096 | −1.79 | ○ | ○ | ○ | 16-Methoxytabersonine | ||
| C21H24N2O4 | 369.180883 | 369.18066 | −0.60 | ○ | ○ | ○ | Horhammericine | ||
| C22H28N2O4 | 385.212183 | 385.21165 | −1.38 | ○ | 16-Methoxy-2,3-dihydro-3-hydroxytabersonine | ||||
| C24H30N2O5 | 427.222748 | 427.22248 | −0.63 | ○ | ○ | ○ | Demetoxyvindoline | ||
| C25H32N2O6 | 457.233312 | 457.23253 | −1.71 | ○ | Vindoline | ||||
| C27H34N2O9 | 531.233706 | 531.23268 | −1.93 | ○ | Strictosidine |
○ denotes that chemical compound exists in stem tissue each cell type (n = 3).
Table 2.
TIA detected by Single-cell MS analysis (mass range m/z = 385–550)
| Molecular formula | [M+H]+ | Measured m/z | Delta, ppm | Stem tissue | IC | LC | PC | EC | Speculated compound |
| C22H28N2O4 | 385.212183 | 385.21191 | −0.71 | ○ | ○ | ○ | 16-Methoxy-2,3-dihydro-3-hydroxytabersonine | ||
| C23H30N2O5 | 415.222748 | 415.22254 | −0.50 | ○ | Deacetylvindoline | ||||
| C24H30N2O5 | 427.222748 | 427.22244 | −0.72 | ○ | ○ | ○ | ○ | ○ | Demetoxyvindoline |
| C25H32N2O6 | 457.233312 | 457.23420 | 1.94 | ○ | Vindoline | ||||
| C27H34N2O9 | 531.233706 | 531.23262 | −2.04 | ○ | ○ | ○ | Strictosidine |
○ denotes that chemical compound exists in stem tissue each cell type (n = 3).
We examined MS/MS analyses of a peak having m/z 337.19 to clarify whether this was mainly catharanthine or tabersonine (Figs. S2 and S7). As a result of MS/MS, we detected a catharanthine-specific fragment peak (m/z 93.07) from all types of cells (Table 1 and Figs. S2 and S7), although the peak intensity in PC and EC was low. No other catharanthine-specific peaks were detected in PC (m/z 133.07).
Fig. S7.
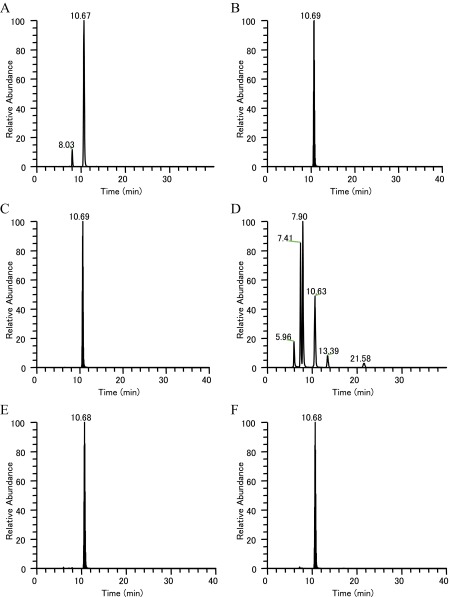
LC chromatogram of catharanthine specific MS/MS fragment. (A) LC chromatogram of catharanthine standard (LC-MS). (B) Extracted chromatogram of catharanthine standard specific MS/MS fragment ion (m/z 93.07). (C) Extracted chromatogram of catharanthine standard specific MS/MS fragment ion (m/z 133.07). (D) Extracted chromatogram of stem sample (m/z 337.19). (E) Extracted chromatogram of stem sample of catharanthine specific MS/MS fragment ion (m/z 93.07). (F) Extracted chromatogram of stem sample of catharanthine specific MS/MS fragment ion (m/z 133.07).
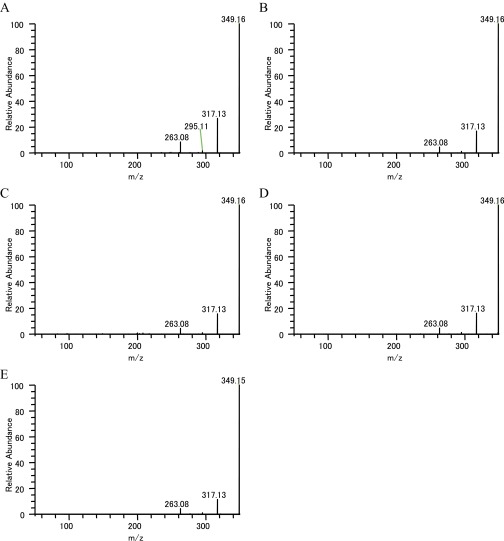
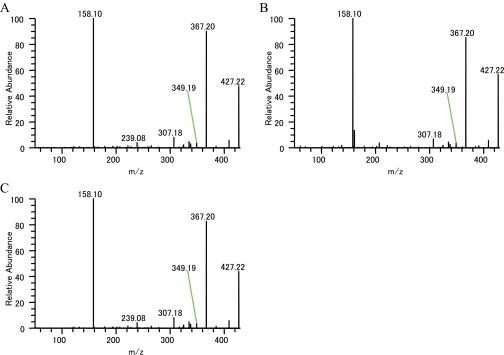
The MS/MS analysis strongly suggested that the peak having the m/z 337.19 that localized in IC and LC and the whole stem tissue is catharanthine. MS/MS fragments corresponding to serpentine (m/z 349.15) and ajmalicine (m/z 353.18) were also detected in Single-cell MS and LC-MS/MS analyses (Table S3 and Figs. S3 and S4). We also speculated on the possible TIA identities of several other peaks (Table S1). To determine whether these peaks were really TIA, we examined their MS/MS fragments. In m/z 427.22 peak, which is supposed to be demethoxyvindoline, the major MS/MS fragments had m/z of 158.10, 367.20, and 409.21 (Fig. S5). These peaks are similar to the vindoline MS/MS fragment pattern (m/z 188.10, 397.20, and 439.21), although demethoxyvindoline MS/MS fragments may deviate by m/z 30 for the deletion of the methoxy group and addition of a proton. At m/z 531.23 ion peak, detected fragment ion peaks (m/z 144.08, 165.05, 282.11, 320.13, 334.14, 352.16, and 514.21) were similar to the major MS/MS fragments of strictosidine that was produced by transformed yeast (Table S3) (28).
Fig. S3.
MS/MS analysis of m/z 349.15. (A) Serpentine standard (LC-MS). (B) Serpentine standard (infusion). (C) IC sample (Single-cell MS). (D) LC sample (Single-cell MS). (E) Stem sample m/z 349.15 specific MS/MS fragment (infusion measurement).
Fig. S4.
MS/MS analysis of m/z 353.18. (A) Ajmalicine standard (LC-MS). (B) Ajmalicine standard (infusion). (C) IC sample (Single-cell MS). (D) LC sample (Single-cell MS). (E) Stem sample m/z 353.18 specific MS/MS fragment (infusion measurement).
Fig. S5.
MS/MS analysis of m/z 427.22. (A) IC sample (Single-cell MS). (B) LC sample (Single-cell MS). (C) Stem sample m/z 427.22 specific MS/MS fragment (infusion measurement).
Semiquantitative Analysis of Single-Cell MS.
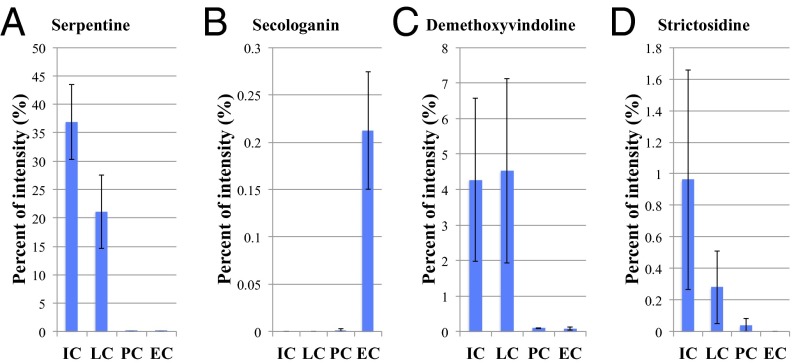
The metabolome of C. roseus stem tissues was analyzed using LC-MS. Single peaks at m/z 349.15, 427.22, and 531.23 correspond to serpentine, demethoxyvindoline, and strictosidine, respectively (Table S1). According to the LC-MS result, we can consider that these m/z values show a single molecular species in each cell type of C. roseus stem tissue. Semiquantitative calculations were made in regard to m/z 349.15, 389.14, 427.22, and 531.23 ion peaks from the Single-cell MS data measured with mass range m/z = 100–1,000 (Fig. 4 A and B) and mass range m/z = 385–550 (Fig. 4 C and D). Serpentine (m/z 349.15) was detected in both IC and LC (Fig. 4A), whereas secologanin (m/z 389.14) was only accumulated in EC (Fig. 4B). Demethoxyvindoline (m/z 427.22) was detected in every type of cell, but with large variations; it was mainly accumulated in IC and LC (Fig. 4C). Strictosidine (m/z 531.23) was also accumulated in IC and LC (Fig. 4D).
Fig. 4.
Semiquantitative analysis of TIAs calculated by Single-cell MS analysis data. (A) Serpentine was detected in IC and LC (m/z 349.15). (B) Secologanin was detected in EC (m/z 389.14). (C) Demethoxyvindoline was detected in all cell types (m/z 427.22). (D) Strictosidine was detected in IC and LC (m/z 531.23). The y axis shows percent of intensity normalized by the value of the total ion intensity of each sample. Values are the mean of three measurements (±SEM).
Discussion
TIA Synthesis in the Stem Tissue C. roseus var. Equator White Eye.
LC-MS data of C. roseus stem extracts showed major peaks from TIAs, including catharanthine and vindoline (Table S1). These data suggest that the variety Equator White Eye also produces major TIAs in stem tissue; previous reports on other C. roseus varieties have focused on TIA in leaf tissue (29). We could not detect all of the vindoline-related intermediates in Single-cell MS data of this variety, even though we succeeded in detecting vindoline and demethoxyvindoline (Tables 1 and 2). It is known that C. roseus stem tissue produces less vindoline than does leaf tissue (30). Our LC-MS quantitative data showed also that the first pair of leaves accumulate more vindoline than stem tissue (Table S1). Because demethoxyvindoline is produced from vindoline, this cultivar might produce vindoline at the cellular level in stem tissue.
Identification of TIA Peaks.
Many peaks corresponding to TIAs were detected using these recent metabolome techniques, i.e., Imaging MS and Single-cell MS. Both of these mass spectrometry systems have quite high mass resolution and high mass accuracy. Values of m/z suggested elemental compositions that could be tentatively assigned to TIAs based on their molecular formulae. To verify that these peaks were TIAs, we measured chemical structures of commercially available TIAs by MS/MS analysis using the same MS apparatus (Table S3 and Figs. S2–S6). We were thus able to confirm, using standard MS/MS fragment data, that IC and LC contain catharanthine, serpentine, and ajmalicine.
Cell-Specific Localization of TIAs in C. roseus Stem Tissue.
Imaging MS data showed that loganin and secologanin localized in the EC (Fig. 2). Single-cell MS showed the same localization for secologanin (Fig. 4). These iridoid metabolites have previously been shown to be synthesized in EC in C. roseus stem tissue (12), and this has been confirmed using our metabolome analyses.
We were not able to ionize loganic acid and loganin in Single-cell MS. Although we could not semiquantify these substances, we assumed that loganic acid was localized in IPAP cells (Fig. 2A).
Imaging MS and Single-cell MS data also showed that most TIAs, including catharanthine (m/z 337.19), were localized in IC and LC (Table 1 and Figs. 2 and 5). These data contrast with previously published reports that showed most catharanthine localized in the wax layer of the leaf tissue (31, 32). The reasons for these differences are unclear but may reflect differences between cultivars or differences between leaf and stem tissue. The stem tissue has no clear wax layer. We cannot detect substances in the wax layer.
Fig. 5.
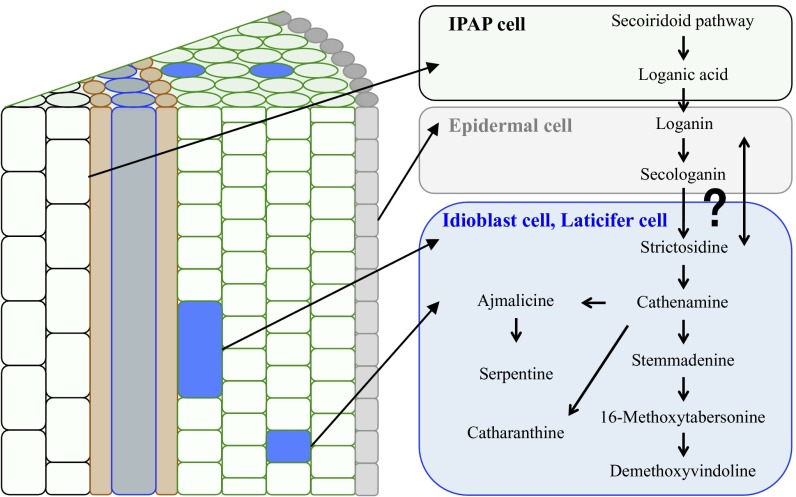
Cell specific localization of TIA in C. roseus stem tissue. Most TIA localized in the ICs and LCs.
Cells in the leaf are much smaller (about 20 μm) than those in the stem (about 40 μm). When we measured extracts of both tissues with LC-MS, leaf tissue was found to contain more TIA metabolites than stem tissues (Table S1), which Góngora-Castillo et al. (33) attributed to differences in expression levels of genes involved in TIA biosynthesis between stem and leaf tissue. So far, we have been able to measure cell contents in stem cells because of their physical advantages. Now we are trying to measure leaf cell constituents using Single-cell MS and attempting to further develop the level of resolution of Imaging MS to enable us to measure TIA localization in leaf cells. In the near future, we expect to be able to compare TIA localization of stem tissue and leaf tissue.
TIA Synthesis and Accumulation in C. roseus ICs and LCs.
It has been proposed that TIA synthesis initially occurs in IPAP cells, and then the products shift from IPAP cells to EC, PC, IC, and LC. It is proposed that loganic acid is transferred from IPAP cells to EC and 16-methoxytabersonine is transferred from EC to other cells at that time. This hypothesis is mainly based on in situ hybridization data of mRNAs of genes encoding enzymes involved in TIA synthesis (12) rather than on the actual localization of TIA molecules themselves at the cellular level (25).
The chemical compounds contained in IC and LC have not previously been accurately measured. To identify TIA compounds accumulated in ICs, we used the recent technologies of Imaging MS and Single-cell MS. Our measurements showed that most alkaloids are localized in IC and LC (Tables 1 and 2). These data are consistent with a previous report, which showed that serpentine, ajmalicine, and vindoline accumulated in the idioblast fraction (25), although the purity of their idioblast fraction was quite low. To our surprise, these recent metabolome results showed that strictosidine also localized in IC and LC (Tables 1 and 2). Strictosidine might move from EC to IC and LC as soon as it is produced.
Movement of TIA Intermediates Between Cells.
Imaging MS and Single-cell MS results revealed that many TIAs are localized in IC and LC. Catharanthine, whose presence was inferred from m/z 337.19, was detected in all types of cells. TIA intermediates, such as strictosidine, catharanthine, and tabersonine, are proposed to be synthesized in EC, and further metabolism of these compounds occurs in the same cell (12, 13). The present results lead to our presumption that catharanthine metabolism might not only occur in EC but may also be synthesized in IC and LC.
Imaging MS and Single-cell MS data showed that loganin and secologanin localized in the EC (Figs. 2 and 4). These iridoid metabolites have previously been shown to be synthesized in EC in C. roseus stem tissue (12), and this has been also confirmed using our metabolome analyses.
Single-cell MS measurements suggested that TIA intermediates, such as serpentine and demethoxyvindoline, were accumulated in IC and LC (Fig. 4). If they are not synthesized in these cells, TIA intermediates must move from synthetic cells to other cells and accumulate in IC and LC. Because we could not detect an m/z value for strictosidine, which is produced by condensation of secologanin and tryptamine in EC, it is possible that strictosidine migrated to IC and LC immediately after synthesis. An m/z value corresponding to strictosidine (m/z 531.23) was detected in IC and LC, and we also obtained MS/MS fragment ion peaks (m/z 144.08, 165.05, 282.11, 320.13, 334.14, 352.16, and 514.21), which are consistent with the speculated strictosidine MS/MS fragment ion peaks (Tables 1 and 2, Table S3, and Fig. S6) (28). A compound peak at m/z 427.22 was detected in every type of cell (Tables 1 and 2). MS/MS fragment ions of this peak were similar to demethoxyvindoline (vindolidine) (34), although we could not obtain a commercially available standard to verify this. We have tentatively assigned the m/z 427.22 peak as demethoxyvindoline, which accumulated in IC and LC (Fig. 4).
The complex distribution pattern of the TIA intermediates suggests that the enzymes responsible for synthesis are located in one cell type, but that the enzyme products are then moved to other cells. A catharanthine transporter responsible for efflux from EC to the wax layer in C. roseus leaf tissue has been already reported (32). It is also possible that symplasmic transport via plasmodesmata may drive movements of TIA intermediates between adjacent cells (Fig. 5). Further studies are needed to clarify how these compounds become distributed between the different cell types.
The Role of ICs and LCs.
IC and LC differed in their form, size, contents, and cell structure, compared with common cell types such as PC or EC (Fig. 2L and Fig. S1) (35). In C. roseus, IC and LC were classified as plant idioblasts using the broad definition of this cell type. PCA showed that IC and LC have many similar features (Fig. 3), which imply that these cell types play a similar role in plant defense (3). The physiological differences between IC and LC remain unclear.
Materials and Methods
A detailed description of materials, chemicals, and sample preparation for MS measurement and LC-MS methods can be found in SI Materials and Methods.
Imaging MS.
Longitudinal sections (100 μm thickness) of C. roseus stem were prepared with a microtome (Plant Microtome MTH-1; NKsystem) and visually inspected with a fluorescent stereoscopic microscope (M250FA; Leica Microsystems). Suitable sections were then washed with MilliQ water to remove alkaloid contamination from dead cells and mounted on Indium Tin Oxide glass slides (Luminescence Technology Co.) using Cryoglue type I (SECTION-LAB Co. Ltd.). The samples on glass slides were lyophilized by freeze-drying (Model 77400; Labconco Co.) then sublimated by α-cyano-4-hydroxycinnamic acid with a conductive glass using a sublimation apparatus (ChemGlass CG-3038; ChemGlass Life Sciences). Mass spectrometric detection was performed on Fourier transform ion cyclotron resonance mass spectrometry (FT-ICR MS) (APEX-Qe-94T with dual source; Bruker Daltonics Inc.). The space resolution of Imaging MS was 20 μm. MS images were reconstituted using an in-house software called LabMSI (22). Target mass peaks were detected in a bin size = 0.02.
Infusion Analysis with LTQ-Orbitrap.
Stem extracts were prepared as described in the procedure for LC-MS analysis. Stem extract (3 µL) was transferred to a nano-electrospray tip (1 μm, Humanix) from the bottom. The tip was then set on the nano- electrospray ionization (nano-ESI) ion source attachment. Mass spectrometric detection was performed on LTQ Orbitrap Velos Pro. The spray voltage for positive measurement was 1,000 V. Alkaloid detection was performed in the range of m/z 100–1,000 and m/z 385–550. The spectrometer was calibrated by polytyrosine (CS Bio) before experiments. MS/MS analyses of alkaloids with known standards were also conducted. Data analysis was conducted using Xcalibur software (Thermo Fisher Scientific). Target mass peaks were detected in ±5 ppm range, relative to the theoretical mass of TIA.
Single-Cell MS in C. roseus Stem Tissue.
To identify cell-specific alkaloid localizations, we used live single-cell video mass spectrometry, termed “Single-cell MS” analysis (23). Longitudinal sections (100 μm thickness) of the stem were prepared with a microtome (Plant Microtome MTH-1; NKsystem), washed with ultrapure water to remove alkaloid contamination, and specimens were then mounted on a glass slide fixed with double-faced adhesive tape and monitored with a stereomicroscope (M205FA; Leica Microsystems). The contents of single cells from four different cell types, namely ICs, LCs, PCs, and ECs, were sucked into a gold-coated glass capillary nano-electrospray tip via tubing using a syringe under the stereoscopic microscope (Fig. S1). After the addition of 3 μL of ionization solvent (0.5% formic acid in methanol) into the nano-electrospray tip from the bottom, the tip was set on a nano-ESI ion source attachment. Mass spectrometric detection was performed on LTQ Orbitrap Velos Pro. The spray voltage for positive measurement was 1,000 V. Alkaloid and secologanin detection was mainly performed in the range of m/z 100–1,000. Strictosidine was detected in the range of m/z 385–550 in samples. The spectrometer was calibrated with polytyrosine before experiments. Data analysis was conducted by using Xcalibur software. Target mass peaks were detected within ±5 ppm, compared with the theoretical mass. Because no isomers of serpentine (alstonine), demethoxyvindoline, and strictosidine were found in the extract of whole stem tissue by LC-MS analysis, we quantified these alkaloids in each of the four kinds of cell types by semiquantitative calculation using Single-cell MS data on m/z intensity values of 349.15, 389.14, 427.22, and 531.23, which were normalized to values of the total ion intensities (y axis of Fig. 4 shows percent of intensity normalized by the value of the total ion intensities).
PCA Analysis.
Principal component analysis (PCA) of both technologies was conducted with MarkerView software (version1.2.1; AB Sciex) on 12 samples (three samples per cell type) for grouping each cell type (IC, LC, PC, and EC). We used total peaks, which were selected under the condition signal-to-noise ratio ≧ 3.
SI Materials and Methods
Plant Material and Sample Preparation.
C. roseus (L.) G Don (cv. Equator White Eye) was grown at 25 °C under 14 light/10 dark h white fluorescent light photoperiod in a growth chamber (NKsystem). Seeds were purchased from Sakata Seed Corporation. Stem tissue of C. roseus was harvested from about 3-mo-old plants just before experiments.
Microscopy.
Bright field and epifluorescence microscopy were performed on a Leica M205FA miccroscope (Leica Microsystems). Ultraviolet long pass filter (ET UV LP, Leica Microsystems) was used as the epifluorescence filter for observation of ICs and LCs.
Chemicals.
Commercially available TIA standards, catharanthine (Enzo Life Sciences), tabersonine HCl (AvaChem Scientific), ajmalicine (AdipoGen), serpentine hydrogen tartrate (ChromaDex), vindoline (ChromaDex), and vindoline-d3 (Tronto Research Chemicals) were used. One-part-per-million solutions of these chemicals were used as standards in LC-MS/MS analysis and infusion analysis with LTQ Orbitrap (LTQ Orbitrap Velos Pro; Thermo Fisher Scientific) used for the Single-cell MS (MS/MS) analysis.
Extraction of TIAs from C. roseus Stem Tissues.
C. roseus stem tissues were frozen with liquid nitrogen immediately after harvesting and ground to fine powder by frost shattering with Multibeads shocker (Yasui Kikai). Metabolites were extracted from the powdered sample with 1 mL extraction solution (0.5% formic acid and 1 ppm vindoline-d3 in methanol). Samples were lyophilized with a freeze-dryer (Model 77400; Labconco Co.) and stored at −80 °C until measurement.
LC-MS Analysis.
Crude extracts of C. roseus stem tissue were analyzed by LC-MS (Prominence). The mobile phases A and B were 25 mM ammonium acetate and acetonitrile, respectively. The ratio of solvent A to B was isocratic at 20:80. TIAs were separated by reverse-phase octadecylsilyl (ODS) column (Eclipse XDB-C18, 5 μm, 4.6 × 150 mm; Agilent). The flow rate was 0.25 mL min−1 at 40 °C. We used vindoline-d3 as an internal standard for quantification of TIA intermediates.
Mass spectrometric detection was performed on LTQ-Orbitrap (LTQ Orbitrap Velos Pro; Thermo Fisher Scientific) mounted on ESI ion source. The spray voltage for positive measurement was 3,800 V. Target mass peaks were detected in ±5 ppm.
Acknowledgments
We greatly appreciate Mr. Tsuyoshi Esaki [Quantitative Biology Center (RIKEN)] for measurement of Single-cell MS, Dr. Jun Murata (SUNTORY Foundation for Life Sciences) for his kind support in preparing the manuscript, and Dr. Rob Reid (University of Adelaide) for his kind discussion and correction of this manuscript. This work was partly supported by MEXT KAKENHI Grant 22120006 (to T. Mimura) and JSPS KAKENHI Grants 14J03616 (to K.Y.) and 24710235 (to M.O.).
Footnotes
The authors declare no conflict of interest.
This article is a PNAS Direct Submission.
This article contains supporting information online at www.pnas.org/lookup/suppl/doi:10.1073/pnas.1521959113/-/DCSupplemental.
References
- 1.De Luca V. Monoterpenoid indole alkaloid biosynthesis. In: Ashihara H, Grozier A, Komamine A, editors. Plant Metabolism and Biotechnology. Wiley; New York: 2011. pp. 263–291. [Google Scholar]
- 2.Kutchan TM. A role for intra- and intercellular translocation in natural product biosynthesis. Curr Opin Plant Biol. 2005;8(3):292–300. doi: 10.1016/j.pbi.2005.03.009. [DOI] [PubMed] [Google Scholar]
- 3.Hagel JM, Yeung EC, Facchini PJ. Got milk? The secret life of laticifers. Trends Plant Sci. 2008;13(12):631–639. doi: 10.1016/j.tplants.2008.09.005. [DOI] [PubMed] [Google Scholar]
- 4.Pan Q, et al. Monoterpenoid indole alkaloids biosynthesis and its regulation in Catharanthus roseus: A literature review from genes to metabolites. Phytochem Rev. 2015 in press. [Google Scholar]
- 5.van Der Heijden R, Jacobs DI, Snoeijer W, Hallard D, Verpoorte R. The Catharanthus alkaloids: Pharmacognosy and biotechnology. Curr Med Chem. 2004;11(5):607–628. doi: 10.2174/0929867043455846. [DOI] [PubMed] [Google Scholar]
- 6.Gigant B, et al. Structural basis for the regulation of tubulin by vinblastine. Nature. 2005;435(7041):519–522. doi: 10.1038/nature03566. [DOI] [PubMed] [Google Scholar]
- 7.Kavallaris M. Microtubules and resistance to tubulin-binding agents. Nat Rev Cancer. 2010;10(3):194–204. doi: 10.1038/nrc2803. [DOI] [PubMed] [Google Scholar]
- 8.O’Keefe BR, Mahady GB, Gills JJ, Beecher CWW, Schilling AB. Stable vindoline production in transformed cell cultures of Catharanthus roseus. J Nat Prod. 1997;60(3):261–264. [Google Scholar]
- 9.Verma P, Mathur AK, Srivastava A, Mathur A. Emerging trends in research on spatial and temporal organization of terpenoid indole alkaloid pathway in Catharanthus roseus: a literature update. Protoplasma. 2012;249(2):255–268. doi: 10.1007/s00709-011-0291-4. [DOI] [PubMed] [Google Scholar]
- 10.Yoder LR, Mahlberg PG. Reactions of alkaloid and histochemical indicators in laticifers and specialized parenchyma cells of Catharanthus roseus (Apocynaceae) Am J Bot. 1976;63(9):1167–1173. [Google Scholar]
- 11.Mahroug S, Courdavault V, Thiersault M, St-Pierre B, Burlat V. Epidermis is a pivotal site of at least four secondary metabolic pathways in Catharanthus roseus aerial organs. Planta. 2006;223(6):1191–1200. doi: 10.1007/s00425-005-0167-y. [DOI] [PubMed] [Google Scholar]
- 12.Dugé de Bernonville T, et al. Phytochemical genomics of the Madagascar periwinkle: Unravelling the last twists of the alkaloid engine. Phytochemistry. 2015;113:9–23. doi: 10.1016/j.phytochem.2014.07.023. [DOI] [PubMed] [Google Scholar]
- 13.St-Pierre B, Vazquez-Flota FA, De Luca V. Multicellular compartmentation of catharanthus roseus alkaloid biosynthesis predicts intercellular translocation of a pathway intermediate. Plant Cell. 1999;11(5):887–900. doi: 10.1105/tpc.11.5.887. [DOI] [PMC free article] [PubMed] [Google Scholar]
- 14.Burlat V, Oudin A, Courtois M, Rideau M, St-Pierre B. Co-expression of three MEP pathway genes and geraniol 10-hydroxylase in internal phloem parenchyma of Catharanthus roseus implicates multicellular translocation of intermediates during the biosynthesis of monoterpene indole alkaloids and isoprenoid-derived primary metabolites. Plant J. 2004;38(1):131–141. doi: 10.1111/j.1365-313X.2004.02030.x. [DOI] [PubMed] [Google Scholar]
- 15.Bird DA, Franceschi VR, Facchini PJ. A tale of three cell types: Alkaloid biosynthesis is localized to sieve elements in opium poppy. Plant Cell. 2003;15(11):2626–2635. doi: 10.1105/tpc.015396. [DOI] [PMC free article] [PubMed] [Google Scholar]
- 16.Onoyovwe A, et al. Morphine biosynthesis in opium poppy involves two cell types: Sieve elements and laticifers. Plant Cell. 2013;25(10):4110–4122. doi: 10.1105/tpc.113.115113. [DOI] [PMC free article] [PubMed] [Google Scholar]
- 17.Lee EJ, Hagel JM, Facchini PJ. Role of the phloem in the biochemistry and ecophysiology of benzylisoquinoline alkaloid metabolism. Front Plant Sci. 2013;4(182):182. doi: 10.3389/fpls.2013.00182. [DOI] [PMC free article] [PubMed] [Google Scholar]
- 18.Stoeckli M, Chaurand P, Hallahan DE, Caprioli RM. Imaging mass spectrometry: A new technology for the analysis of protein expression in mammalian tissues. Nat Med. 2001;7(4):493–496. doi: 10.1038/86573. [DOI] [PubMed] [Google Scholar]
- 19.Hemalatha RG, Pradeep T. Understanding the molecular signatures in leaves and flowers by desorption electrospray ionization mass spectrometry (DESI MS) imaging. J Agric Food Chem. 2013;61(31):7477–7487. doi: 10.1021/jf4011998. [DOI] [PubMed] [Google Scholar]
- 20.Thunig J, Hansen SH, Janfelt C. Analysis of secondary plant metabolites by indirect desorption electrospray ionization imaging mass spectrometry. Anal Chem. 2011;83(9):3256–3259. doi: 10.1021/ac2004967. [DOI] [PubMed] [Google Scholar]
- 21.Li B, Bhandari DR, Janfelt C, Römpp A, Spengler B. Natural products in Glycyrrhiza glabra (licorice) rhizome imaged at the cellular level by atmospheric pressure matrix-assisted laser desorption/ionization tandem mass spectrometry imaging. Plant J. 2014;80(1):161–171. doi: 10.1111/tpj.12608. [DOI] [PubMed] [Google Scholar]
- 22.Takahashi K, Kozuka T, Anegawa A, Nagatani A, Mimura T. Development and application of a high-resolution imaging mass spectrometer for the study of plant tissues. Plant Cell Physiol. 2015;56(7):1329–1338. doi: 10.1093/pcp/pcv083. [DOI] [PubMed] [Google Scholar]
- 23.Mizuno H, Tsuyama N, Harada T, Masujima T. Live single-cell video-mass spectrometry for cellular and subcellular molecular detection and cell classification. J Mass Spectrom. 2008;43(12):1692–1700. doi: 10.1002/jms.1460. [DOI] [PubMed] [Google Scholar]
- 24.Lorenzo Tejedor M, Mizuno H, Tsuyama N, Harada T, Masujima T. In situ molecular analysis of plant tissues by live single-cell mass spectrometry. Anal Chem. 2012;84(12):5221–5228. doi: 10.1021/ac202447t. [DOI] [PubMed] [Google Scholar]
- 25.Mersey BG, Cutler AJ. Differential distribution of specific indole alkaloids in leaves of Catharanthus roseus. Can J Bot. 1986;64(5):1039–1045. [Google Scholar]
- 26.Hisiger S, Jolicoeur M. Plant cell culture monitoring using an in situ multiwavelength fluorescence probe. Biotechnol Prog. 2005;21(2):580–589. doi: 10.1021/bp049726f. [DOI] [PubMed] [Google Scholar]
- 27.Guirimand G, et al. The subcellular organization of strictosidine biosynthesis in Catharanthus roseus epidermis highlights several trans-tonoplast translocations of intermediate metabolites. FEBS J. 2011;278(5):749–763. doi: 10.1111/j.1742-4658.2010.07994.x. [DOI] [PubMed] [Google Scholar]
- 28.Brown S, Clastre M, Courdavault V, O’Connor SE. De novo production of the plant-derived alkaloid strictosidine in yeast. Proc Natl Acad Sci USA. 2015;112(11):3205–3210. doi: 10.1073/pnas.1423555112. [DOI] [PMC free article] [PubMed] [Google Scholar]
- 29.Murata J, De Luca V. Localization of tabersonine 16-hydroxylase and 16-OH tabersonine-16-O-methyltransferase to leaf epidermal cells defines them as a major site of precursor biosynthesis in the vindoline pathway in Catharanthus roseus. Plant J. 2005;44(4):581–594. doi: 10.1111/j.1365-313X.2005.02557.x. [DOI] [PubMed] [Google Scholar]
- 30.Singh D, et al. Predominance of the serpentine route in monoterpenoid indole alkaloid pathway of Catharanthus roseus. Proc Indian Natl Sci Acad. 2008;74(3):97–109. [Google Scholar]
- 31.Roepke J, et al. Vinca drug components accumulate exclusively in leaf exudates of Madagascar periwinkle. Proc Natl Acad Sci USA. 2010;107(34):15287–15292. doi: 10.1073/pnas.0911451107. [DOI] [PMC free article] [PubMed] [Google Scholar]
- 32.Yu F, De Luca V. ATP-binding cassette transporter controls leaf surface secretion of anticancer drug components in Catharanthus roseus. Proc Natl Acad Sci USA. 2013;110(39):15830–15835. doi: 10.1073/pnas.1307504110. [DOI] [PMC free article] [PubMed] [Google Scholar]
- 33.Góngora-Castillo E, et al. Development of transcriptomic resources for interrogating the biosynthesis of monoterpene indole alkaloids in medicinal plant species. PLoS One. 2012;7(12):e52506. doi: 10.1371/journal.pone.0052506. [DOI] [PMC free article] [PubMed] [Google Scholar]
- 34.Zhou H, Tai Y, Sun C, Pan Y. Rapid identification of vinca alkaloids by direct-injection electrospray ionisation tandem mass spectrometry and confirmation by high-performance liquid chromatography-mass spectrometry. Phytochem Anal. 2005;16(5):328–333. doi: 10.1002/pca.852. [DOI] [PubMed] [Google Scholar]
- 35.Foster AS. Plant idioblasts: Remarkable examples of cell specialization. Protoplasma. 1956;46(1):184–193. [Google Scholar]


