Significance
In the quest for inexpensive feedstocks (cost-effective fuel production), here we show a two-stage integrated bioprocess for the conversion of syngas to lipids. We harness the innate capability of acetogens and explore concepts of gas-to-liquid mass transfer to produce an integrated two-stage bioreactor system that can convert gases to liquid fuels at scale. Additionally, as the rate of CO2 fixation substantially exceeds that of CO2 generation in the two units of the process, there is significant potential for CO2 recycling in our integrated system. In a broader sense, implementation of these concepts for fuel production may extend to a number of commercially important biological platforms, depending on the potential sources of synthesis gas or its conversion products, namely, acetate.
Keywords: two-stage bioprocess, lipid production, microbial fermentation, gas-to-liquid fuel, CO2 fixation
Abstract
In the quest for inexpensive feedstocks for the cost-effective production of liquid fuels, we have examined gaseous substrates that could be made available at low cost and sufficiently large scale for industrial fuel production. Here we introduce a new bioconversion scheme that effectively converts syngas, generated from gasification of coal, natural gas, or biomass, into lipids that can be used for biodiesel production. We present an integrated conversion method comprising a two-stage system. In the first stage, an anaerobic bioreactor converts mixtures of gases of CO2 and CO or H2 to acetic acid, using the anaerobic acetogen Moorella thermoacetica. The acetic acid product is fed as a substrate to a second bioreactor, where it is converted aerobically into lipids by an engineered oleaginous yeast, Yarrowia lipolytica. We first describe the process carried out in each reactor and then present an integrated system that produces microbial oil, using synthesis gas as input. The integrated continuous bench-scale reactor system produced 18 g/L of C16-C18 triacylglycerides directly from synthesis gas, with an overall productivity of 0.19 g⋅L−1⋅h−1 and a lipid content of 36%. Although suboptimal relative to the performance of the individual reactor components, the presented integrated system demonstrates the feasibility of substantial net fixation of carbon dioxide and conversion of gaseous feedstocks to lipids for biodiesel production. The system can be further optimized to approach the performance of its individual units so that it can be used for the economical conversion of waste gases from steel mills to valuable liquid fuels for transportation.
Concerns over diminishing oil reserves and climate-changing greenhouse gas emissions have led to calls for clean and renewable liquid fuels (1). One promising direction has been the production of microbial oil from carbohydrate feedstocks. This oil can be readily converted to biodiesel and recently there has been significant progress in the engineering of oleaginous microbes for the production of lipids from sugars (2–5). A major problem with this approach has been the relatively high sugar feedstock cost. Alternatively, less costly industrial gases containing CO2 with reducing agents, such as CO or H2, have been investigated. In one application, anaerobic Clostridia have been used to convert synthesis gas to ethanol (6), albeit at low concentration requiring high separation cost. Here we present an alternative gas-to-lipids approach that overcomes the drawbacks of previous schemes.
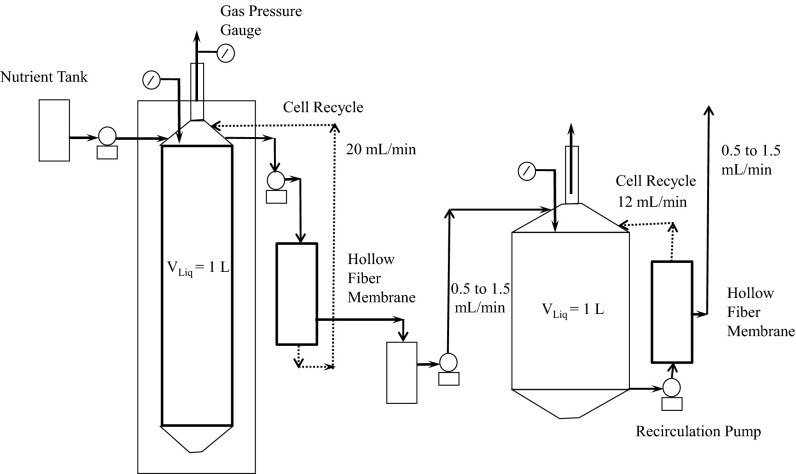
We have shown previously that acetate in excess of 30 g/L can be produced from mixtures of CO2 and CO/H2, using an evolved strain of the acetogen Moorella thermoacetica, with a substantial productivity of 0.55 g⋅L−1⋅h−1 and yield of 92% (7). We also have demonstrated that the engineering of the oleaginous yeast Yarrowia lipolytica can yield biocatalysts that can produce lipids from glucose at high yields and productivities (2, 5). At the same time, as part of the quest for inexpensive feedstock, we have investigated lipid production from other substrates such as acetate and other volatile fatty acids (VFAs) that can be potentially sourced at lower costs as products of anaerobic digestion or from exhaust gases in steel manufacturing. In this study, we show that the above two systems can be integrated into a two-stage process whereby CO2 and CO/H2 are converted to acetic acid in the first-stage anaerobic bubble column bioreactor and the product acetic acid is subsequently converted to lipids by Y. lipolytica in a second-stage aerobic bioreactor. To assess the merits of this approach, we individually optimized fermentations of M. thermoacetica and Y. lipolytica with the intent to maximize acetate and lipid yield and productivity, respectively. A hollow fiber membrane filter was deployed in the anaerobic bioreactor to allow continuous removal of the acetic acid product and recycle of M. thermoacetica cells to the bubble anaerobic column. Similarly, cell recycle was also used in the second bioreactor to decouple the residence time required for growth and lipogenesis in Y. lipolytica cells from that of acetic acid consumption and therefore allow for the development of a dense microbial culture and high lipid concentration in the second bioreactor. We also demonstrate for the first time to our knowledge the separation of the growth phase of M. thermoacetica from the phase of acetic acid production: First a robust culture of M. thermoacetica is established in a CO-dependent growth phase by using a CO2/CO gas mixture, and then the gas composition is switched to a H2/CO2 mixture that produces acetate at significantly higher specific productivity. This advance allowed us to secure both high specific productivity and a high cell density of M. thermoacetica for an overall very high volumetric productivity of 0.9 g of acetate⋅L−1⋅h−1. The two processes are then integrated in a single continuous-flow gas-to-oil processing scheme (Fig. 1), with design decisions based on the performance characteristics of the individual reactors.
Fig. 1.
Integrated bioprocess: Schematic of two-stage lipid production process using microbial conversion. In stage 1, CO2 is fermented to a volatile fatty acid; in stage 2, this acid is converted to lipids by an engineered strain.
Results
Cell Growth and Acetate Production from Syngas.
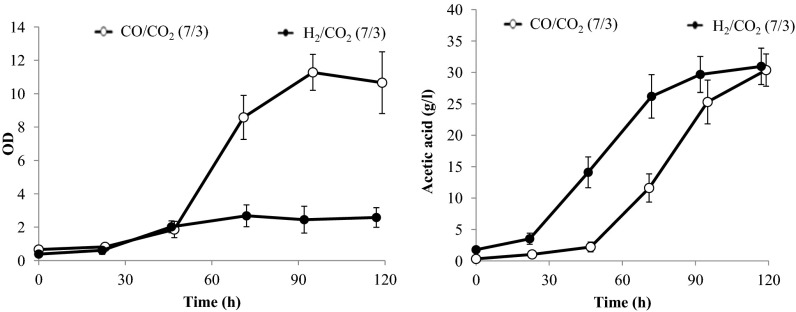
Acetic acid production from syngas by M. thermoacetica is shown in Fig. 2, which presents time courses for growth and acetic acid titer in an anaerobic bubble column run independently. Our prior work provided the basis for flow rates relevant to this study (7). Fermentation was carried out at a flow rate of 1,000 standard cubic centimeters per minute (sccm), using either CO or H2 as reducing gas at a composition of 7/3 CO/CO2 or 7/3 H2/CO2. Substantial amounts of acetic acid (in excess of 30 g/L) were produced under both conditions during similar time periods. Notably, the maximum cell density under H2 (max OD of ∼2.5) was less than one-quarter of that achieved with CO (max OD of ∼11) as electron donor. Because the volumetric productivities of acetic acid were similar in these two experiments, the specific productivity of acetic acid under H2/CO2 was therefore four times greater than that under CO/CO2. This difference in specific cell productivity is likely due to the energetic difference between H2 and CO metabolism in this organism. M. thermoacetica generates ATP under autotrophic conditions by chemiosmosis. In this mechanism, oxidation of reduced ferredoxin by an energy-conserving hydrogenase complex (Ech) results in translocation of protons across the membrane. The generated proton gradient is used by the membrane-bound ATP synthase to generate ATP (8). Production of acetyl-CoA from H2/CO2 involves oxidation of 2 mol ferredoxin for every mole of acetyl-CoA synthesized, whereas production of acetyl-CoA from CO requires oxidation of 6 mol of ferredoxin. Thus, growth on CO supports more ATP production, which, in turn, translates into higher biomass concentrations. The apparent ATP limitation during growth on H2/CO2 forces increased diversion of acetyl-CoA from biomass synthesis to acetate production to increase ATP synthesis via substrate-level phosphorylation, resulting in higher overall acetate fluxes per unit biomass.
Fig. 2.
Cell growth and acetic acid production using either CO or H2 as a reducing gas at a composition of 7/3 CO/CO2 or 7/3 H2/CO2 and a flow rate of 1,000 sccm. The maximum cell density under H2 (max OD of ∼2.5) is less than one-quarter of that achieved with CO (max OD of ∼11) as electron donor. Substantial amounts of acetic acid (∼30 g/L) are produced under both conditions. SDs from triplicate runs are presented.
Acetate Productivity with Gas Composition Switch and Media Replacement.
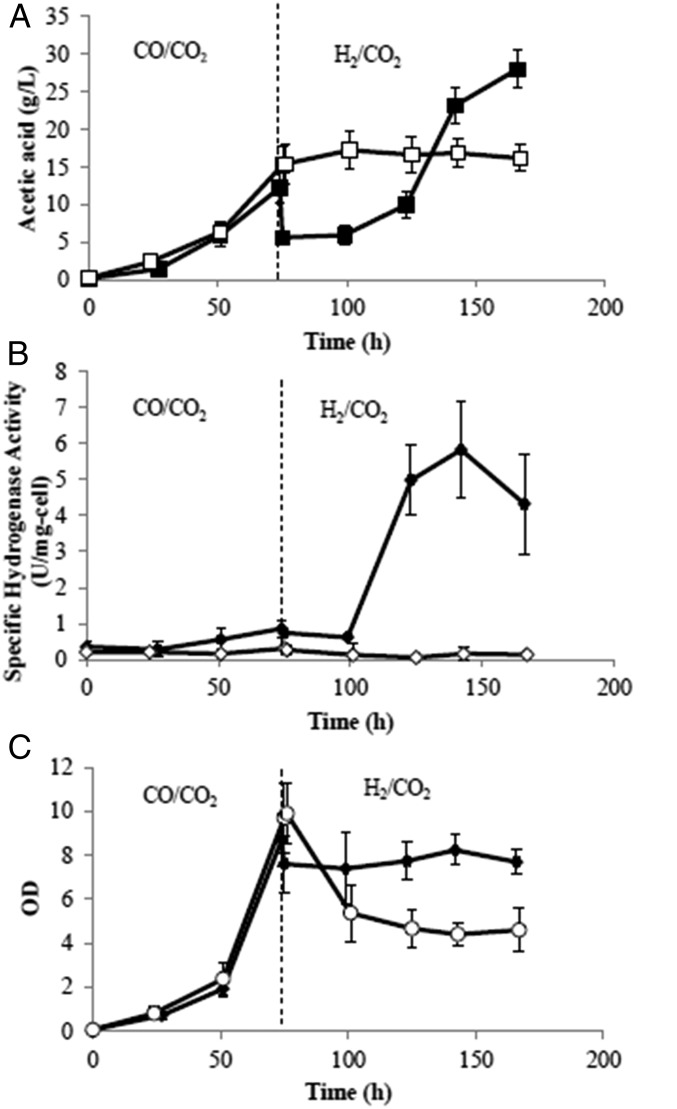
As shown in the previous section, the specific productivity of acetate on H2 by M. thermoacetica is about four times that achieved on CO. On the other hand, much higher cell densities can be supported by a CO/CO2 mixture. This suggests that one should first grow the M. thermoacetica culture on a CO/CO2 mixture and switch to a H2/CO2 composition after the culture is established to take advantage of the higher acetate specific productivity on hydrogen. An experiment was thus designed to assess whether the high cell density achievable by growth on CO/CO2 could be harnessed for higher overall productivity by switching the gas composition to H2/CO2 after the initial growth phase. However, the simple switch of gas composition led to a significant decline of M. thermoacetica culture and no change in acetic acid production (Fig. 3). We hypothesized that this might be due to low hydrogenase activity at the time of the switch, which is known to be inhibited by carbon monoxide (Fig. 3B). Although constitutively expressed, hydrogenase activity is 18-fold higher in H2-cultivated cells than in CO-grown cells (9), and it is required for growth on H2 as a sole electron donor. Successful transition from CO to hydrogen without decline in cell mass and that also maintained the biosynthetic capacity of cells was achieved when half the medium was replaced with fresh medium at the same time of the gas switch. In this experiment, after an initial decline caused by the dilution from the fresh medium, cell density was stabilized (Fig. 3C) at the new value following the gas switch and, more importantly, maintained its acetic acid productivity. An average overall acetic acid productivity of 0.9 g⋅L−1⋅h−1 after the gas switch was obtained, which was 50% higher than that of 0.6 g⋅L−1⋅h−1 observed before the gas switch. These results are consistent with the time course of hydrogenase activity, which rose roughly 20-fold in 1 d following the replacement of CO by H2. This experiment demonstrated that the volumetric productivity of acetic acid could be significantly improved by switching the gas composition and replacing the media midrun, relative to what was possible before using CO2/H2 or CO2/CO gas alone.
Fig. 3.
(A–C) Time courses of (A) acetic acid concentration, (B) specific hydrogenase activity, and (C) optical density for two different methods of switching the gas composition in the anaerobic bubble column. Solid symbols are for the case in which the gas switch from CO/CO2 (4/1) and the flow rate of 1,000 sccm to H2/CO2 (2/1) were performed and the same flow rate was accompanied with replacement of half of the reactor medium with fresh media. In the run represented by the open symbols a similar gas switch was carried out but without medium replacement. SDs from triplicate runs are presented.
Lipid Production from High-Strength Acetic Acid by Y. lipolytica.
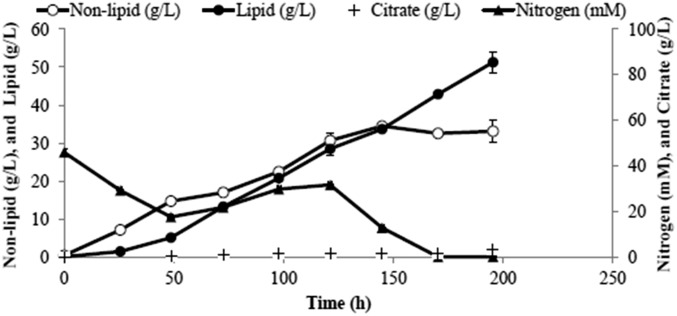
Lipid production from acetic acid (30% vol/vol) by Y. lipolytica in a fed-batch mode is shown in Fig. 4. Y. lipolytica produced lipids at a titer of 51 g/L with a productivity of 0.26 g⋅L−1⋅h−1 and lipid content of 61%, which is the highest reported to date on acetate. Fontannile et al. (10) grew Y. lipolytica first on glucose and then transferred to VFAs, obtaining lower productivity (0.16 g⋅L−1⋅h−1) compared with our study, albeit at lower lipid titers (12 g/L), conversion yields (0.13 g/g), and lipid content of 40%.
Fig. 4.
Fermentation characteristics of Y. lipolytica in semicontinuous mode during acetic acid consumption (high strength). Y. lipolytica produced lipids at a titer of 51 g/L with a productivity of 0.26 g⋅L−1⋅h−1 and lipid content of 61%. SDs from triplicate runs are presented.
Lipid Production from Low-Strength Acetic Acid by Y. lipolytica.
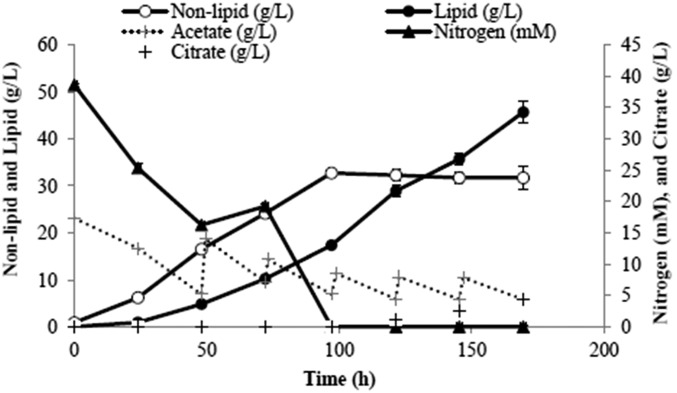
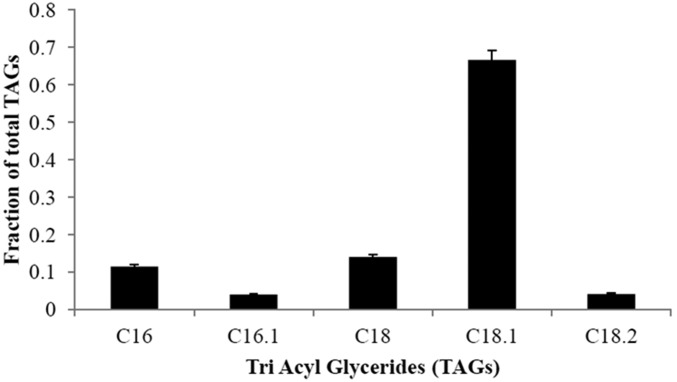
A dilute substrate will result in a dilute product. An exception is possible in the case of intracellular products (like lipids) and also when cells are recycled to increase their residence time in the bioreactor to allow them more time to attain higher lipid content. This can be achieved with the use of a hollow fiber membrane whereby spent medium with a low concentration of residual acetate is removed whereas cells are recycled back into the bioreactor. This scheme was implemented and Fig. 5 shows the time courses of lipid production from dilute acetic acid (3% vol/vol). A lipid titer of 46 g/L was obtained with an overall productivity of 0.27 g⋅L−1⋅h−1 and lipid content of 59%. An average lipid composition profile generated in this run is shown in Fig. 6. This profile is similar to that of Knothe (11), with higher fractions of unsaturated fats, which are desirable as they increase the cetane number and decrease the cloud point of the resulting biodiesel.
Fig. 5.
Acetic acid (3% vol/vol) consumption (low strength) and lipid production by using Y. lipolytica in semicontinuous mode. A hollow fiber module was used to recycle cells and maintain constant volume. The time courses show a lipid titer of 46 g/L with an overall productivity of 0.27 g⋅L−1⋅h−1 and lipid content of 59%. SDs from triplicate runs are presented.
Fig. 6.
Fatty acid distribution during bioreactor fermentation by using Y. lipolytica. C16 palmitate, C16.1 palmitoleate, C18 stearate, C18.1 oleate, and C18.2 linoleate are shown. Samples were performed in triplicate.
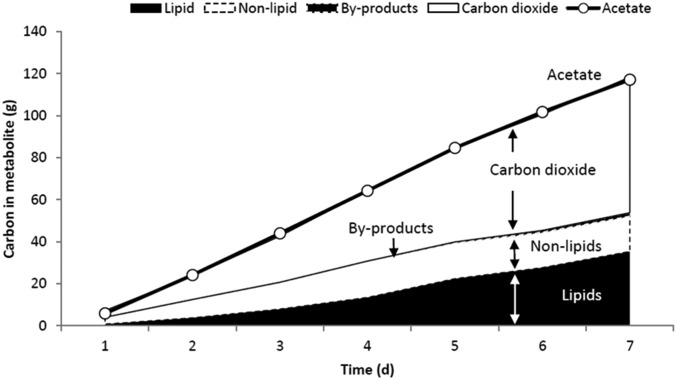
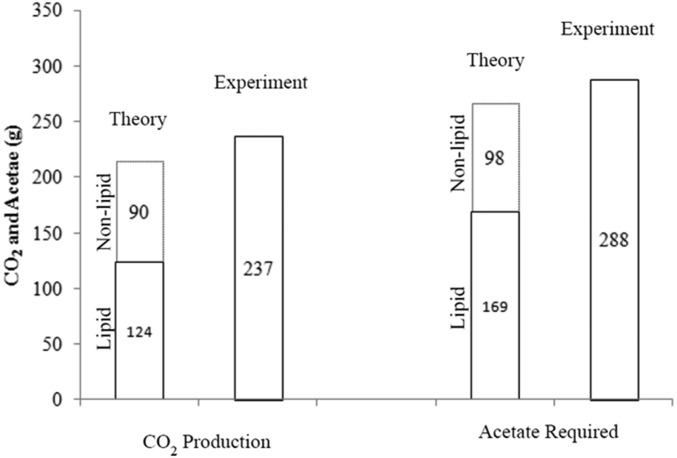
Carbon fluxes were calculated for this run. Y. lipolytica consumes acetic acid and converts the carbon to CO2, lipids, and nonlipid biomass, with small amounts of citrate produced as a by-product. The cumulative carbon mass balance is closed to within 5%, with CO2 accounting for 54% of the total carbon products (Fig. 7). A stoichiometric model was constructed to assess the efficiency of acetate utilization during the fermentation process, considering usual metabolic processes and associated ATP and NADPH costs for nonlipid biomass production (growth) as well as lipid production. Details of the model are provided in SI Notes on the Model. The model essentially predicts, for a given amount of lipid and biomass formed, the amounts of acetate required and CO2 formed, based on reasonable assumptions about the pathways responsible for the main metabolic processes underlying growth and lipid synthesis. By substituting the experimentally measured lipid and nonlipid production data, we determined the theoretically predicted amount of acetate consumption and carbon dioxide production. Upon comparison with the respective experimentally observed levels of acetate consumption and CO2 production it can be seen that experimental lipid production and nonlipid production are within 10% of the theoretical values, as shown in Fig. 8. This suggests that the engineered strain is well optimized for lipid synthesis, wasting very little substrate for other processes.
Fig. 7.
Carbon balance of acetate consumption and lipid production. Shown are input carbon as acetate and output carbon (lipid, nonlipid, by-products, and CO2). The cumulative carbon mass balance is closed to within 5%, with CO2 accounting for 54% of the total carbon products.
Fig. 8.
Theoretical predictions and experimental values of acetate consumed and CO2 produced. A stoichiometric model was constructed to assess the efficiency of acetate utilization during the fermentation process, taking into account acetate consumed and CO2 produced for both nonlipid biomass production (growth) and lipid production, including the associated ATP and NADPH costs of these processes. The experimental CO2 production and acetate consumption are within 10% of the expected theoretical values. Model detail is provided in SI Notes on the Model.
Integrated System for Syngas Bioconversion to Lipids.
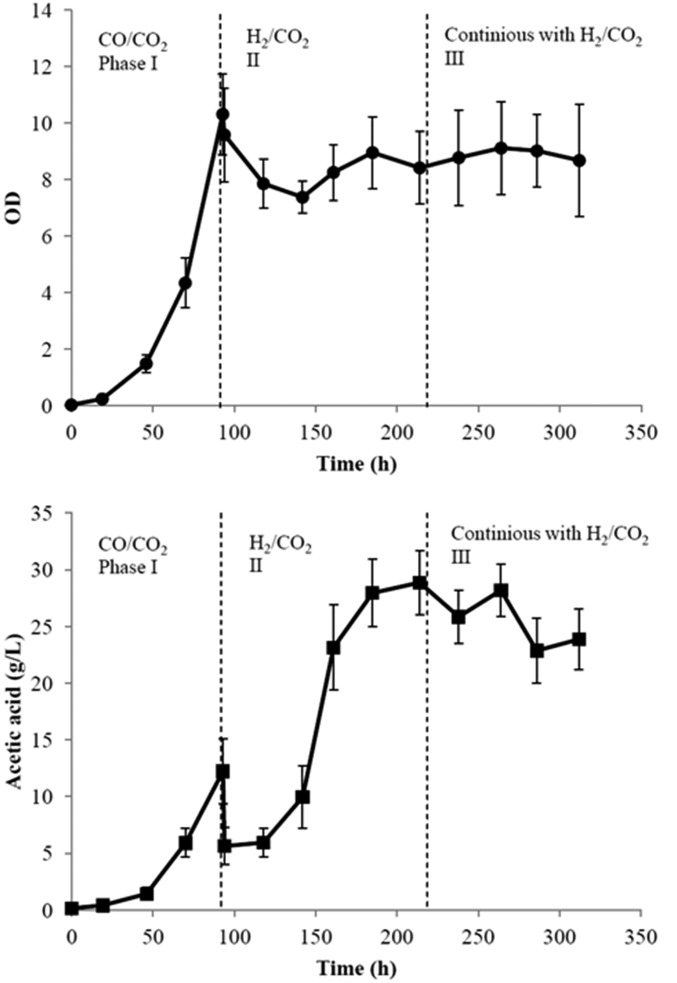
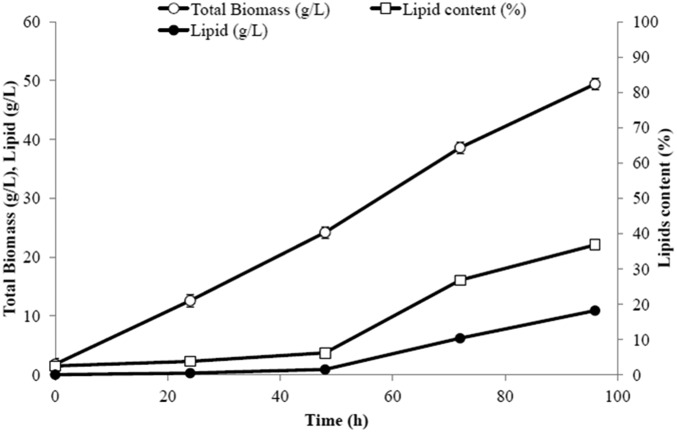
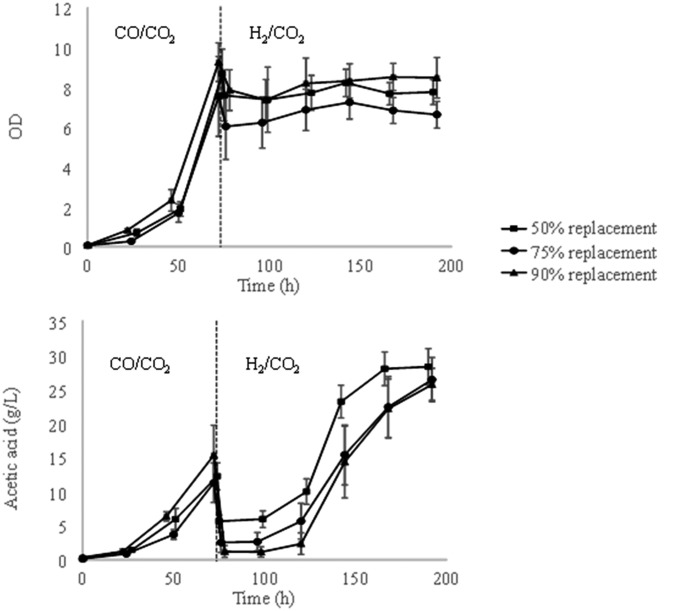
Based on the results obtained with the two bioreactor units, the integrated system of Fig. 1 was assembled and operated as shown in Table 1. Fig. 9 shows the time courses for cell growth and acetic acid production by M. thermoacetica in the anaerobic bubble column, with Fig. 10 summarizing the same for Y. lipolytica in the aerobic stirred tank bioreactor. Before 93 h (first phase), the anaerobic bioreactor was fed with a CO/CO2 gas mixture at 1,000 sccm and composition of (4/1). During this period, M. thermoacetica grew to an OD of 10.3 and acetic acid accumulated to 12 g/L with a productivity of 0.4 g⋅L−1⋅h−1, excluding the lag phase. Then, the gas supply was changed to H2/CO2 at a flow rate of 1,200 sccm and composition of (2/1). The second phase lasted from 93 h to 218 h and was characterized by a steady increase of acetic acid until the maximum of 25 g/L was reached. After the gas switch, the cell OD dropped from the maximum value of 10.3 to about 8 and recovered slowly until the end of the second phase (see Fig. S1 for different media ratios). At the same time (186–218 h), ∼1,000 mL liquid medium was removed from the anaerobic bioreactor through a hollow fiber membrane and fed into the aerobic bioreactor. In the third phase (after 218 h), a continuous-flow operation was initiated, which maintained the level of acetic acid in the anaerobic reactor at the maximum concentration of ∼25 g/L. This was achieved by continuously removing acetic acid while recycling M. thermoacetica cells through a hollow fiber membrane. Cell growth was minimal during this phase and the reactor thus operated like a perfusion bioreactor. The maximum acetic acid concentration of 25 g/L was selected to prevent inhibition of further acetate production (7). The working volumes of both bioreactors were maintained constant by the addition of fresh media in the first bioreactor and removal of spent media from the aerobic bioreactor as shown in Fig. 1. The acetic acid concentration of the media reservoir was measured periodically between 118 h and 312 h, with a total of 212 g acetic acid produced in 194 h. The average productivity of acetic acid was 1.1 g⋅L−1⋅h−1 after the gas switch, threefold higher than the first stage when CO/CO2 was used as gas feedstock.
Table 1.
Experimental conditions during the integrated bioprocess run
| Anaerobic bubble column reactor | Aerobic reactor | ||||
| Phase | Time, h | Gas composition, flow rate (sccm) | Mode (liquid flow rate to aerobic reactor) | Time, h | Mode (outlet liquid flow rate) |
| I | 0–93 | CO/CO2 (4/1), 1,000 | Batch | 0–93 | n.s. |
| II | 94–185 | H2/CO2 (2/1), 1,200 | Batch | 0–185 | n.s. |
| 186–218* | H2/CO2 (2/1), 1,200 | Continuous, 0.5 mL/min | 186–218 | n.s. | |
| III | 219–312 | H2/CO2 (2/1), 1,200 | Continuous, 1.5 mL/min | 219–314† | Continuous, 1.5 mL/min |
n.s., not started.
∼1,000 mL liquid medium obtained for aerobic reactor.
Aerobic bioreactor inoculated with Y. lipolytica and continuous operation started.
Fig. 9.
Cell growth of M. thermoacetica and acetic acid production of the integrated fermentation experiment. In all three phases gaseous substrate is provided in continuous mode, whereas liquid as batch mode is provided in the first two phases. In the third phase both gas and liquid are in continuous mode. Successful gaseous substrate switch allowed acetic acid production (maximum concentration of ∼25 g/L) in the anaerobic reactor. This is achieved by continuously removing acetic acid while recycling M. thermoacetica cells through a hollow fiber membrane. SDs from triplicate runs are presented.
Fig. 10.
Lipid titer and biomass production in an integrated process (phase III). Shown is the time course of cell growth and lipid production (18 g/L titer and 36% lipid content) in the aerobic bioreactor. SDs from triplicate runs are presented.
Fig. S1.
Time courses of acetic acid concentration and optical density for different media replacement ratios of switching the gas composition in the anaerobic bubble column. Three different media replacement ratios (50%, 75%, and 90%) were assessed. All runs showed similar patterns that the production resumed after about 1 d or 2 d delay and the production ended at the acetic acid concentration of about 25–30 g/L.
The time courses of cell growth and lipids production in the aerobic bioreactor are presented in Fig. 10. Lipid titer was 18 g/L and lipid content 36%. Although these numbers are lower than those achieved in the individual units and prior studies (2), the results are nevertheless encouraging as they demonstrate the feasibility of operating an integrated gas-to-lipids process, which was the goal of this study. A comparison of the results obtained from the single-stage bioreactors and those of the combined process is provided in Table 2. The main difference between the independent lipid production run and the integrated process is the lipid yield from acetic acid. In the single-unit investigation, more acetic acid was converted to lipids, whereas in the combined process more acetic acid was converted to nonlipid biomass. In Y. lipolytica, the C/N ratio is known to strongly influence lipid production and titers. In the combined process, the C/N ratio was not strictly controlled and this likely impacted the yields negatively. Therefore, future experiments should aim to minimize the nitrogen content of the M. thermoacetica medium, which will limit the nitrogen content of the acetic acid feed to the Y. lipolytica reactor after the start of the lipid production phase.
Table 2.
A comparison of results of single-stage and integrated processes
| Substrate | Microorganism | Substrate feeding mode | Product | Product titer, g⋅L−1 (lipid content % of dry cell weight) | Productivity, g⋅L−1⋅h−1 | Product yield, g⋅g−1 |
| Syngas | Moorella thermoacetica | Continuous | Acetic acid | 30 | 0.57 | NA |
| Acetate | Yarrowia lipolytica | Fed batch | Lipid | 46 (59) | 0.27 | 0.16 |
| Syngas | Both | Continuous | Lipid | 18 (36) | 0.19 | 0.09 |
NA, not analyzed.
SI Notes on the Model
Overview.
A theoretical maximum of carbon accumulation in lipids is calculated based on microbial metabolism to determine stoichiometry of lipid and nonlipid production on acetate. The objective of this calculation is to determine the efficiency of the oleaginous microbe in converting acetate to lipids during the fermentation process. Now, for the microbe to accumulate lipids, it has to first generate nonlipid biomass from acetate and then divert subsequent carbon toward lipid accumulation. Thus, acetate consumed by the microbes would be diverted toward one of two end products: nonlipid biomass and lipids. We are thus trying to investigate whether the microbe is consuming more than the theoretically required amount of acetate (carbon feedstock) or producing more than the theoretically required amount of carbon dioxide (lost carbon), to produce the observed amount of lipids and nonlipids during the fermentation. To this end, we first developed a model that describes the stoichiometry of conversion of acetic acid to the respective product.
Lipid production on acetic acid.
The stoichiometry of lipid production from acetic acid was obtained by accounting for (i) acetic acid required to produce tripalmitin (our model lipid, a triglyceride form of palmitic acid), (ii) acetic acid required to produce NADPH (reducing equivalent) to sustain lipid production, and (iii) acetic acid required to produce ATP to sustain lipid production. The final equation relating acetic acid to lipid production is
| [S1] |
The equation above provides the theoretical amounts of acetic acid required and carbon dioxide generated during the production of 1 mol of tripalmitin. Details of its derivation are provided in SI Notes on the Model, Stoichiometry for Acetate Conversion to Lipids. Using this equation and the molecular weights of acetate and tripalmitin, we calculate the maximum theoretical yield of lipid production from acetate at 0.272 g lipid per gram acetate.
Nonlipid biomass production on acetate.
Similarly, a model for the production of nonlipid biomass from acetate was developed, which takes into account (i) the chemical formula of nonlipid biomass, (ii) the theoretical dry cell weight produced per electron, and (iii) the acetate consumed for ATP production. The final equation is
| [S2] |
Thus, we have obtained a stoichiometric equation that relates nonlipid biomass production to the moles of acetate consumed and moles of CO2 produced. By plugging in the observed measurements of the lipid and nonlipid amounts into Eqs. S1 and S2, respectively, one can obtain the theoretical levels of acetic acid consumption and carbon dioxide production associated with each conversion. The theoretical estimates of acetic acid consumed and carbon dioxide produced are compared in the text to the observed experimental quantities in Fig. 8, to determine the extent of inefficiency in the microbial metabolism during the fermentation.
Details of the Models.
Stoichiometry for acetate conversion to lipids.
Biosynthesis of triglycerides from acetate requires several pathways. Gluconeogenesis ultimately provides the glycerol backbone. As the starting substrate for gluconeogenesis is a four-carbon compound (oxaloacetate/pyruvate), anaplerotic pathways such as the glyoxalate cycle or the methyl-citrate cycle are required when acetate is the substrate. Fatty acid biosynthesis catalyzes the ATP- and NADPH-dependent conversion of acetate to palmitic acid, and finally the Kennedy pathway condenses glycerol with the lipids to produce the triglycerides. All of the above pathways, as well as pathways for NADPH and ATP generation, are taken into consideration to arrive at the final equation for acetate to lipids. Note that the ATP-generating equation is also used in the prediction of the biomass stoichiometry in SI Notes on the Model, Stoichiometry for Acetate Conversion to Nonlipid Biomass.
The reactions involved in this process have been grouped into modules or sets for simplicity. The symbols (c) and (m) refer to whether the metabolite exists in the cytosol or in the mitochondria. The following modules of reactions have been assumed: (i) acetate to acetyl CoA (ACA), (ii) ACA to oxaloacetate (OAA), (iii) OAA to glycerol, (iv) ACA to C16 fatty acid, and (v) (fatty acid + glycerol) forms lipid.
We analyze the equations of each of the above modules.
Set i.
| [S3] |
This reaction proceeds through the action of the enzyme Acetyl CoA Synthetase (ACS) in the cytosol.
Set ii.
Gluconeogenesis occurs in the cytosol and hence oxaloacetate needs to be present on the cytosol side to initiate gluconeogenesis. This process occurs through a number of successive reactions. First, the glyoxalate cycle operates and produces a succinate for every two acetyl CoA molecules. Next, the succinate produced in the cytosol permeates through the mitochondrial membrane and enters the TCA cycle operating in the mitochondria. The succinate converts to malate, which permeates out into the cytosol. The cytosolic malate is acted upon by the malic enzyme to produce pyruvate, which ultimately is acted upon by the enzyme pyruvate carboxylase to form oxaloacetate in the cytosol. The reactions are as follows:
2 ACA(c) → succinate (c) + NADHc (glyoxalate cycle) (28)
Succinate (c) → succinate (m) (succinate exit)
Succinate (m) → malate (m) + FADH2 (TCA cycle) (28)
Malate (m) → malate (c) (malate exit)
Malate (c) → pyruvate (c) + NADPHc + CO2 (malic enzyme) (28)
Pyruvate (c) + CO2 + ATP → OAA (c) (pyruvate carboxylase) (28)
The net reaction amounts to
| [S4] |
Set iii.
This accounts for the sum of reactions leading up to glycerol production from oxaloacetate via gluconeogenesis (28):
| [S5] |
Set iv.
This accounts for the set of reactions leading up to palmitic acid production from acetyl CoA via the fatty acid synthesis pathway (29):
| [S6] |
Set v.
This accounts for the tripalmitin production via the Kennedy pathway (28):
| [S7] |
Once the reaction modules have been analyzed to obtain a single reaction, the next step involves adding these to obtain our final equation. Adding sets ii–v (reactions 2–5) would provide the following equations:
| [S4] |
| [S5] |
| [S6] |
| [S7] |
with the net equations being
| [S8] |
At this point, the acetate required to provide the required NADPH, NADH, and ATP needs to be accounted for.
We assume all of the NADPH is provided through the action of the malic enzyme. The following equation accounts for NADPH production:
| [S9] |
ATP production from cytosolic ACA is not as straightforward as ACA cannot cross the mitochondrial membrane to form mitochondrial ACA, which could then directly enter the TCA cycle. Thus, the glyoxalate cycle operates to form succinate, which eventually forms pyruvate. Pyruvate can permeate through the mitochondria and then decarboxylate to form acetyl CoA, which subsequently enters the TCA cycle. The equation for ATP/NADH production through the TCA cycle from cytosolic acetyl CoA proceeds through the following set of equations:
2 ACA (c) → succinate (c) + NADHc (glyoxalate cycle)
Succinate (c) → succinate (m) (succinate exit)
Succinate (m) → malate (m) + FADH2 (TCA cycle)
Malate (m) → malate (c) (malate exit)
Malate (c) → pyruvate (c) + NADPHc + CO2 (malic enzyme) (28)
Pyruvate (c) → pyruvate (m) (pyruvate exit)
Pyruvate (m) → 3 CO2 + 4 NADHm + FADH2 + GTP (TCA cycle) (28)
4 NADHm → 4 NADHc (29)
The net equation is
| [S10] |
Eq. S10 can also be used to produce more ATP through the conversion of the NADH and FADH2 in the electron transport chain. However, we are also assuming that the NADPH would not be oxidized because there is a high demand for NADPH in the cell during the fatty acid synthesis as a reducing agent (1 NADH = 2.5 ATP, 1 FADH2 = 1.5 ATP, 1 GTP = 1ATP).
The equation would become
| [S11] |
Eqs. S8–S11 would add up together to arrive at the final equation for lipid production from acetate. The strategy used is to assume Eqs. S9–S11 are multiplied by unknowns x, y, and z and added to Eq. S8. The equations are added such that the coefficients of NADH, NADPH, and ATP add up to 0. In this way, we can ensure that the equation accounts for just the exact amount of acetate needed to arrive at 1 mol of tripalmitin:
| [S8] |
—Multiplying [S9] by the unknown x,
Multiplying [S10] by the unknown y,
Multiplying [S11] by the unknown z, they add up to
| [S12] |
However, the substrate is acetate and hence, multiplying Eq. S3 by (26 + 2y + 2z) and adding to [S12] would substitute all of the ACA by acetate:
| [S13] |
Assigning the coefficients of NADPH, NADH, and ATP to be 0, we obtain a system of three equations in x, y, and z:
Solving for the above three equations, we obtain x = 4.944, y = 5.788, and z = 6.267.
Putting the above values of x, y, and z into Eq. S13, we obtain the final equation for conversion of acetate into lipids as:
| (Eq. S1). |
Stoichiometry for acetate conversion to nonlipid biomass.
Nonlipid biomass of average yeasts has a chemical formula of C5H8.3O2.7N0.7 (21). It corresponds to a molecular weight of 121.3 g/mol. Shuler and Kargi (30) provided an estimate for the yield of dry cell weight (DCW) per electron available: 3.14 g DCW per electron. Because acetic acid has eight electrons, it would correspond to a biomass (nonlipid) yield of 3.14 × 8 = 25.1 g DCW per mole acetic acid. With the molecular weight of average yeast biomass known, the conversion can be shown as
| [S14] |
Here the moles of CO2 were obtained by subtracting the carbon moles in biomass from the carbon moles in acetic acid (= 2 − 0.21 × 5).
In addition, there would be ATP expended by the cell for biomass production. According to Verduyn (31), 105.5 mmol ATP is required per gram dry biomass, which translates to the fact that for every 0.21 mol of biomass produced, 2.65 mol ATP would be required.
Thus, Eq. S14 would be modified as
| [S15] |
Accounting for the additional acetic acid required for producing 2.65 mol of ATP (described in SI Notes on the Model, Stoichiometry for Acetate Conversion to Lipids) and normalizing the equation to 1 mol of biomass, we obtain
| (Eq. S2). |
Discussion
There are several new concepts deployed in this study that allowed the successful implementation of the integrated gas-to-lipids conversion process. First, we used the acetogen M. thermoacetica as a model organism because of its very high autotrophic flux to acetyl-CoA, which naturally produces acetate at very high rates and almost theoretical yields via the canonical Wood–Ljungdahl pathway. Additionally, the high temperature of operation (Topt 60 °C) of this thermophilic organism makes it of industrial interest as it would require less cooling of syngas before feeding the bioreactor (12) compared with the other model acetogens, Clostridium ljungdahlii (Topt 37 °C) (13) and Acetobacterium woodii (Topt 30 °C) (14). Our prior work with M. thermoacetica (7) provided the basis of acetic acid production at high rates relevant to this study.
Second, this work highlights a novel gas composition switch strategy as an important part of the process required for achieving higher overall acetate productivity. Additionally, this result points out the importance of the physiological state of M. thermoacetica at the time of switching the gas composition, so future experiments should aim at identifying optimal medium replacement and culture viability or alternately modifying medium composition to achieve maximum titers, yields, and productivities.
Third, as summarized in Table 2, the numbers of merit obtained for the integrated system are lower than those achieved for the individual bioreactor units. Additionally, the overall energetic efficiency (from hydrogen to lipid and yeast) of the integrated system is 34.4%, compared with maximum theoretical values of 43% (considering yeast energy content) and 60.5% (assuming only hydrogen and tripalmitin are the energy carriers). Model detail on energy efficiency calculation is provided in SI Notes on Energy Efficiency Calculations. Therefore, the process requires further optimization. Nitrogen control in the media of the two units is mentioned as one direction that can be pursued to this end.
Fourth, there is significant potential for reduction of CO2 emissions in our system compared with the single-stage systems. For example, the process in the first reactor is theoretically expected to consume 100.2 mol CO2 whereas aerobic lipid synthesis is theoretically expected to produce 49.22 mol CO2 (a cumulative balance for the whole operation). As such, our process actually fixes CO2 using CO and/or H2 as reducing agents. Carbon dioxide generated in the lipid-producing aerobic reactor could be recycled and used by the anaerobic bacteria of the first stage, yielding a significant overall rate of CO2 fixation. In the same vein, the nonlipid biomass could be used to supply the yeast extract used in the media of both reactors following extraction of the lipids.
The main limitation in biodiesel (the primary renewable alternative to diesel) production is feedstock availability and cost (15). It is unlikely that food-competing feedstocks will contribute significantly to the production of renewable transportation fuels (16). In the quest for a cheaper feedstock, synthesis gas offers attractive features. Also, steel mill gas and natural gas can be used as a cost-effective feedstock (12, 17–19). As such, a syngas-to-liquids process represents an infrastructure-compatible platform that will be important for reducing dependence on fossil fuels. The gas-to-liquid concept presented here has the potential to provide biodiesel production from CO2 in a way that does not impose demands on or changes of land use and is not confined by the need of access to carbohydrate feedstocks.
SI Notes on Energy Efficiency Calculations
Experimental Energy Efficiency Using the Lower Heating Value.
Lower heating value (LHV): 120.21 MJ/kg hydrogen; 36.48 MJ/kg tripalmitin; 15.7 MJ/kg yeast
| Compound | LHV, MJ/kg | Amount produced, g |
| Hydrogen | 120.21 | −28 |
| Tripalmitin | 36.48 | 18 |
| Yeast (biomass) | 15.7 | 32 |
Theoretical Maximum Energy Efficiency Treating only Lipid as the Product.
Hydrogen LHV: -242.82 kJ/mol (cta.ornl.gov/bedb/appendix_a/Lower_and_Higher_Heating_Values_of_Gas_Liquid_and_Solid_Fuels.pdf).
Tripalmitin heat of combustion: −31606 kJ/mol (webbook.nist.gov/cgi/cbook.cgi?ID=C555442&Mask=2).
The heat of combustion on NIST is the higher heating value (HHV). To convert heat of combustion to LHV, account for water’s heat of vaporization:
So we now have
The absolute maximum (no biomass production):
Absolute max (stoichiometric) energy efficiency: (−29,450 × 1 tripalmitin)/(−242.82 × 50.1 × 4 hydrogen) = 60.5%.
Theoretical Maximum Energy Efficiency Treating Lipid and Yeast Biomass as the Product.
Using the experimental ratio of produced lipids to biomass,
Experimental:
So the experimental equation is (where the hydrogen is theoretically calculated from the theoretical equations above and the amount of biomass and lipids produced)
Hence theoretical energy efficiency (LHV) is
Materials and Methods
Bacteria, Media, and Cultivation Conditions.
For details on routine cultivation of microorganisms and descriptions of the strains used, see SI Notes on Materials and Methods.
Anaerobic Bubble Column Bioreactor Operation.
M. thermoacetica was grown in a 1-L glass bubble column bioreactor at 60 °C. Gas composition was controlled with a four-channel mass flow controller and pH was controlled by addition of 5 N sodium hydroxide or hydrochloric acid. Prepared medium (excluding cysteine) was autoclaved, transferred to the bioreactor, and purged with oxygen-free N2 gas overnight. pH was adjusted to 6.0 unless otherwise stated, and syngas flow was initiated and continuously bubbled through the bioreactor (see SI Notes on Materials and Methods for syngas composition). A cysteine solution was added to the medium to remove residual oxygen, and the bioreactor was inoculated at 5% vol/vol.
Stirred Tank Aerobic Bioreactor Conditions.
Y. lipolytica was grown in a 2-L stirred tank bioreactor. Dissolved oxygen (DO) was controlled to 20% saturation, and pH was controlled to 7.3 by addition of acetic acid. During the first 70 h of growth, the feed consisted of 3% acetic acid and 15 g/L ammonium sulfate to provide sufficient nitrogen for generation of nonlipid biomass. Thereafter the feed consisted solely 3% vol/vol acetic acid. Additional acetate required to maintain an acetate concentration of ∼15 g/L was provided as a sodium acetate solution (300 g/L). A hollow fiber module was used to recycle cells and maintain constant volume (20). A theoretical maximum of carbon accumulation is determined as lipid and nonlipid production on acetate (21, 22).
Integrated Bioprocess System.
The bubble column bioreactor (for M. thermoacetica) and stirred tank bioreactor (for Y. lipolytica) were integrated in a process shown schematically in Fig. 1. Experimental conditions during integrated bioprocess run are provided in Table 1, and the complete operation is described in SI Notes on Materials and Methods. Briefly, the bubble column was operated first in a batch mode with respect to the liquid phase. Following the switch of syngas composition and the attainment of stationary phase, continuous liquid removal was initiated and cells were recycled via a hollow fiber membrane. After 1 L effluent had been transferred, the aerobic bioreactor was inoculated and operated continuously, again with cell recycling accomplished via a hollow fiber membrane.
Fermentation Analytics.
Effluent gas composition was analyzed via microGC-TCD (gas chromatography–thermal conductivity detector). Acetate and citrate were measured via HPLC with refractive index detector (RID) detection. Growth was monitored via OD600 for M. thermoacetica (23) and gravimetrically for Y. lipolytica. Conversion of OD to dry cell weight was via ratios determined in our laboratory. Total lipids were quantified using a modified version of a direct transesterification protocol adapted from US Patent 7932077 (24) and Griffiths et al. (25), using gas chromatography–flame ionization detector (GC-FID). For details see SI Notes on Materials and Methods.
Hydrogenase Assay.
Hydrogenase activity was assayed anaerobically by standard protocols following the reduction of benzyl viologen with permeabilized cells in a sealed cuvette (26, 27). For details see SI Notes on Materials and Methods.
SI Notes on Materials and Methods
Bacteria, Media, and Cultivation Conditions.
The anaerobic acetogenic bacterium, M. thermoacetica (ATCC 49707) (www.atcc.org), was grown at 60 °C following strict anoxic techniques in an enhanced culture medium containing (per liter) 1.4 g KH2PO4, 1.1 g K2HPO4, 2.0 g (NH4)2SO4, 0.5 g MgSO4·7H2O, 10 g yeast extract, 10 g morpholinoethanesulfonic acid (Mes), 20 mL ATCC 1754 PETC trace elements solution (www.atcc.org), and 10 mL 0.3% cysteine solution. In addition, 0.5 mL 0.2% resazurin was added to indicate the presence of oxygen.
The engineered Y. lipolytica ACC-DGA strain (2) is a po1g (genotype MatA, leu2-270, ura3-302:URA3, xpr2-332, axp-2; source, Yeastern Biotech), transformed strain with plasmid pMT065 expressing genes ACC and DGA encoding acetyl-CoA carboxylase and diacylglycerol acyltransferase, respectively. ACC1 and DGA1 are important genes responsible for the first and last steps of lipid synthesis. The coupling of ACC1 and DGA1 allows effective flux diversion toward lipid synthesis and creation of a driving force (the simultaneous push and pull of carbon flux toward TAG) by sequestering product formation in lipid bodies. This strain contains the LEU2 marker and an additional copy of both the ACC1 and DGA1 genes. ACC1 is under control of the hp4d promoter (minimal LEU2 promoter preceded by 4 copies of the UAS1B upstream activation sequence enhancer) and the DGA1 gene is under the control of the Yarrowia TEF [transcription elongation factor 1(alpha)] promoter with its associated intron.
The engineered Y. lipolytica ACC-DGA strain was grown with the following media. Selective YNB-Leu agar plates contained (per liter) 1.7 g yeast nitrogen base (without amino acids), 0.69 g CSM (Leu−), 20 g glucose, and 15 g Bacto agar. YPD medium was prepared (per liter) with 20 g Bacto peptone, 10 g yeast extract, and 20 g glucose (Sigma-Aldrich). YPA medium was similar to YPD but contained 28 g/L sodium acetate (or 20 g/L acetate) instead of glucose. Bioreactor inoculum was first grown in an overnight tube culture with YPD medium to an OD of 3–5, followed by streaking onto a YNB-Leu Petri dish. Individual colonies were subcultured into a culture tube [3 mL YPA in a 15-mL culture tube, 200 rpm, 28 °C, 24 h (Thermo Scientific MaxQ 4000 orbital shaker with an orbit of 1.9 cm)]. Once the OD reached 3–5, they were again subcultured into an Erlenmeyer flask at an initial OD of 0.1 [50 mL YPA in 250-mL flasks, 200 rpm, 28 °C, 2 d (Thermo Scientific MaxQ 4000 orbital shaker with an orbit of 1.9 cm)]. The bioreactor was inoculated with exponentially growing cells to a final concentration of 5% vol/vol. Yeast extract, Bacto agar, and Bacto peptone were purchased from BD. Sodium acetate was purchased from Macron Fine Chemicals. All other chemicals used were purchased from Sigma-Aldrich. The ACCDGA strain accumulated up to 62% lipids from glucose as a substrate through de novo synthesis at an overall volumetric productivity of 0.143 g⋅L−1⋅h−1 (5). Subsequent optimized bioreactor cultivations improved performance to 55 g/L titer, 0.707 g⋅L−1⋅h−1 volumetric productivity, 67% lipid content, and 0.234 g/g yield (5).
Anaerobic Bubble Column Bioreactor Operation.
M. thermoacetica was grown in a glass bubble column bioreactor with an inside diameter of 4.5 cm, a height of 80 cm, and a total working volume of about 1 L (G. Finkenbeiner Inc.). Gas composition was controlled with a four-channel mass flow controller, controlling the flow rates of H2, CO, CO2, and N2. Bioreactor temperature was maintained at 60 °C with a heating blanket and temperature controller. pH was controlled by addition of 5 N sodium hydroxide or hydrochloric acid, determined by an Etatron DLX pH/ORP pump control system and a submersible pH electrode. The AALBORG digital mass flow controllers, temperature, and pH were all purchased from Cole-Parmer. Prepared medium (excluding cysteine) was autoclaved at 121 °C for 25 min, transferred to the bioreactor, and purged with oxygen-free N2 gas overnight to remove all traces of dissolved oxygen. Afterward, the pH was adjusted to 6.0 unless otherwise stated, and syngas flow (described below) was initiated and continuously bubbled through the bioreactor. Cysteine solution (10 mL, 3% wt/wt) was added to the medium to remove any residual oxygen. The bubble column bioreactor was inoculated at 5% vol/vol with a culture grown in a serum bottle with the media listed above.
Syngas Composition.
Initial anaerobic reactor experiments were conducted with feed gas composition that was maintained constant throughout the fermentation process. The cells were grown on a syngas mixture supplied at a total gas flow rate of 1,000 sccm and with compositions of CO/CO2 (4/1), and H2/CO2 (4/1). In subsequent experiments, where the gas composition was changed midfermentation, cells were grown initially on CO/CO2 (4/1) at 1,000 sccm. After cells reached stationary phase and the acetate production leveled off, the syngas composition and flow rate were adjusted as described below. At the same time, half of the media in the bioreactor were replaced with fresh media, and flow through a hollow fiber membrane was initiated to recycle cells back to the bioreactor. The working volume of the bubble column was maintained constant at 1 L after the media replacement.
Stirred Tank Aerobic Bioreactor Conditions.
Y. lipolytica was grown in a 2-L stirred tank bioreactor (New Brunswick Scientific). The pH and dissolved oxygen (DO) levels were monitored using a pH probe and a DO probe (Mettler-Toledo Ingold Inc.). The initial medium was composed of 30 g/L sodium acetate (Macron Chemicals), 2.5 g/L yeast extract (Difco Laboratories), 4.2 g/L yeast nitrogen base (without amino acids and ammonium sulfate; Amresco), and 2.4 g/L ammonium sulfate (Macron Chemicals) (C/N molar ratio of 20). The pH and DO set points were 7.3 and 20%, respectively, and were maintained with cascade control. The pH was controlled by feeding an acetic acid solution. During the first 70 h of growth, the feed consisted of 3% acetic acid and 15 g/L ammonium sulfate to provide sufficient nitrogen for generation of nonlipid biomass. The feed consisted of only 3% vol/vol acetic acid for the rest of the run. Additional acetate required to maintain an acetate concentration of ∼15 g/L in the bioreactor was provided as a sodium acetate solution (300 g/L) as needed. A hollow fiber module with a pore rating of 0.2 μm and surface area of 290 cm2 (MiniKros Sample Plus Filter Module; Spectrum Laboratories) was continuously used during the reactor operation to recycle cells and remove the excess volume pumped into the reactor through the acetic acid feeding (20). The acetic acid solutions were prepared with glacial acetic acid (Acros Chemicals). A theoretical maximum of carbon accumulation is determined as lipid and nonlipid production on acetate (21, 22).
Integrated Bioprocess System.
The bubble column bioreactor (for M. thermoacetica) and the stirred tank bioreactor (for Y. lipolytica) were integrated in a process shown schematically in Fig. 1. Experimental conditions during the integrated bioprocess run are provided in Table 1. In this system, gases are fed to the bubble column and are converted to acetic acid, which is, in turn, used as a feed to the stirred tank reactor and converted to lipids. The bubble column was operated first in a batch mode with respect to the liquid phase. A mixture of CO/CO2 gases was supplied at a composition of 4:1 and a flow rate of 1,000 sccm. After 94 h, the gas composition was switched to H2/CO2 (2:1) and the flow rate increased to 1,200 sccm. At the same time, 500 mL of the medium was replaced by 500 mL fresh anaerobic media, using the hollow fiber membrane to retain cells in the bioreactor (MiniKros Sample Plus Filter Module; Spectrum Laboratories). Once the culture reached stationary phase, at 185 h, flow of liquid media was initiated and the bubble column bioreactor with M. thermoacetica was switched to continuous operation with a flow rate of 0.5 mL/min. Cell recycle was also initiated at the same time from the hollow fiber membrane. Throughout the operation, pH was maintained at 6.0. Spent media from the hollow fiber membrane were transferred into the stirred tank bioreactor via a sterile container. The stirred tank bioreactor (for Y. lipolytica) was inoculated about 33 h after the switch of continuous operation, to allow enough time to feed ∼1,000 mL of acetate-containing media into the bioreactor. After the inoculation, the stirred tank bioreactor was operated in a continuous mode as well. To keep the constant working volume in the bioreactor, the effluent containing low concentrations of acetic acid was removed via the hollow fiber membrane with a pore rating of 0.2 μm and surface area of 290 cm2 (MiniKros Sample Plus Filter Module; Spectrum Laboratories). The liquid flow rates increased from 0.5 mL/min to 1.5 mL/min after the inoculation of Y. lipolytica.
Gas and Liquid Analysis.
Gas flow rate was measured by bubble flow meter (Cole-Parmer). Gas composition was analyzed with a dual-channel Agilent micro-GC equipped with PLOT U and Molecular Sieve columns and TCD detectors (Agilent Technology). Argon was used as the carrier gas. OD was measured at 600 nm with 1-mL cuvettes and an Ultrospec 2100 pro UV/Visible Spectrophotometer (General Electric). The OD of M. thermoacetica was proportional to DCW (correlation of ∼0.45 g dry cell per liter per unit OD660) (23), a value confirmed by our laboratory. Y. lipolytica total biomass was determined gravimetrically, using cellulose nitrate (Whatman) filters. The filters were dried initially at 60 °C for 2 h and preweighed. A 15-mL volume of broth was poured into the holding reservoir fitted on the filter membrane. Vacuum was applied to pull the liquid through the membrane. The filters were dried for 24 h in a 60 °C oven and reweighed. Acetate and citrate were measured with a Waters Alliance 2695 HPLC with a Waters 410 Differential Refractometer and a Bio-Rad HPX-87H column (Waters Corporation). The column was eluted at 35 °C with 14 mM sulfuric acid as the mobile phase with a flow rate of 0.6 mL/min.
Lipid Extraction and Quantification.
Total lipids were quantified using a modified version of a direct transesterification protocol adapted from US Patent 7932077 (24) and Griffiths et al. (25). A correlation between the OD and cell biomass (0.3 g dry cell per liter per unit OD600) was used to determine the volume of cell culture. The volume of cell culture was chosen so that each sample would contain ∼1 mg of cell biomass. After centrifugation and removal of the supernatant, the cell pellet was suspended in 100 μL of hexane containing the internal standard glyceryl triheptadecanoate (C17 Tri-Acyl Glyceride). Subsequently, 500 μL of 0.5 N sodium methoxide was added to the mixture and the cell suspension vortexed at room temperature for 60 min. Next, 40 μL of 98% (wt/wt) sulfuric acid was added followed by addition of 500 μL hexane. This entire mixture was vortexed for 30 min at room temperature to extract the fatty acid methyl esters (FAMEs) into the hexane phase. Finally, the mixture was centrifuged at 8,000 rpm (Thermo Scientific MaxQ 4000 orbital shaker with an orbit of 1.9 cm) and the top hexane layer was transferred into vials for analysis through gas chromatography (GC). GC analysis of FAMEs was performed using a Bruker 450-GC instrument equipped with a flame-ionization detector and a capillary column HP-INNOWAX (30 m × 0.25 mm) and the same oven conditions were used as discussed in Tai and Stephanopoulos (2). The FAME concentrations were calculated from commercial standards and normalized to the internal standard (methyl C17) in the control tube with no cells. Total lipid content was calculated as the sum of total fatty methyl ester contents for five FAMEs: methyl palmitate (C16:0), methyl palmitoleate (C16:1), methyl stearate (C18:0), methyl oleate (C18:1), and methyl linoleate (C18:2).
Hydrogenase Assay.
Hydrogenase activity was assayed by monitoring the reduction of benzyl viologen with permeabilized cells in a sealed cuvette (26). An electron acceptor (EA) solution consisting of oxidized benzyl viologen and a cell solution (CS) sampled from fermentation were prepared in two separate Hungate tubes in an anaerobic chamber. The EA solution contained 0.3 mL of 1 M potassium phosphate buffer (pH 6), 0.4 mL of 40 mM benzyl viologen dichloride (BV), and 2.3 mL deionized water. The CS contained 0.3 mL of 1 M potassium phosphate buffer (pH 6), 0.3 mL of 0.5 M DTT, 0.3 mL cell broth, and 1.8 mL deionized water. After preparation, both tubes were removed from the anaerobic chamber and purged with pure H2 gas at a flow rate of 50 sccm in a water bath at 60 °C for 5 min. One minute before the end of purging, 0.3 mL Triton X-100 solution was injected to the CS tube to permeate the cell wall and expose hydrogenase to the solution. To start the assay, 2 mL from the EA solution tube and 0.67 mL from the CS tube were mixed in a sealed anaerobic cuvette, and the reduction of BVox to reduced BVred was monitored continuously at 546 nm. The activity (U) was calculated from the initial slope, using an extinction coefficient of 7.55 m3⋅mol−1⋅cm−1. One unit was defined as the consumption of 1 µmol H2 consumed per minute. Specific activity (U/mg) was determined by dividing the activity by the cell mass in the assay. It should be noted that the determined activity represents a global enzymatic activity of all hydrogenases involved in hydrogen uptake. Prior research has shown that several different hydrogenase enzymes are active in the acetogen M. thermoacetica (27).
Acknowledgments
We thank Dr. Victoria Bertics and Dr. Peter Girguis (Harvard University) for their help. This research was supported by an ARPA-E grant of the Electrofuels program (Award DE-AR0000059) and the Department of Energy’s Genomic Science Program (Grant DE-SC0008744) (MIT: 692-6611).
Footnotes
The authors declare no conflict of interest.
This article is a PNAS Direct Submission.
See Commentary on page 3717.
This article contains supporting information online at www.pnas.org/lookup/suppl/doi:10.1073/pnas.1516867113/-/DCSupplemental.
References
- 1.Chu S, Majumdar A. Opportunities and challenges for a sustainable energy future. Nature. 2012;488(7411):294–303. doi: 10.1038/nature11475. [DOI] [PubMed] [Google Scholar]
- 2.Tai M, Stephanopoulos G. Engineering the push and pull of lipid biosynthesis in oleaginous yeast Yarrowia lipolytica for biofuel production. Metab Eng. 2013;15:1–9. doi: 10.1016/j.ymben.2012.08.007. [DOI] [PubMed] [Google Scholar]
- 3.Blazeck J, et al. Harnessing Yarrowia lipolytica lipogenesis to create a platform for lipid and biofuel production. Nat Commun. 2014;5:3131. doi: 10.1038/ncomms4131. [DOI] [PubMed] [Google Scholar]
- 4.Liu L, Pan A, Spofford C, Zhou N, Alper HS. An evolutionary metabolic engineering approach for enhancing lipogenesis in Yarrowia lipolytica. Metab Eng. 2015;29:36–45. doi: 10.1016/j.ymben.2015.02.003. [DOI] [PubMed] [Google Scholar]
- 5.Qiao K, et al. Engineering lipid overproduction in the oleaginous yeast Yarrowia lipolytica. Metab Eng. 2015;29:56–65. doi: 10.1016/j.ymben.2015.02.005. [DOI] [PubMed] [Google Scholar]
- 6.Shen Y, Brown R, Wen Z. Enhancing mass transfer and ethanol production in syngas fermentation of Clostridium carboxidivorans P7 through a monolithic biofilm reactor. Appl Energy. 2014;136:68–76. [Google Scholar]
- 7.Hu P, Rismani-Yazdi H, Stephanopoulos G. Anaerobic CO2 fixation by acetogenic bacterium Moorella thermoacetica. AICHE. 2013;59:3176–3183. [Google Scholar]
- 8.Schuchmann K, Müller V. Autotrophy at the thermodynamic limit of life: A model for energy conservation in acetogenic bacteria. Nat Rev Microbiol. 2014;12(12):809–821. doi: 10.1038/nrmicro3365. [DOI] [PubMed] [Google Scholar]
- 9.Daniel SL, Hsu T, Dean SI, Drake HL. Characterization of the H2- and CO-dependent chemolithotrophic potentials of the acetogens Clostridium thermoaceticum and Acetogenium kivui. J Bacteriol. 1990;172(8):4464–4471. doi: 10.1128/jb.172.8.4464-4471.1990. [DOI] [PMC free article] [PubMed] [Google Scholar]
- 10.Fontanille P, Kumar V, Christophe G, Nouaille R, Larroche C. Bioconversion of volatile fatty acids into lipids by the oleaginous yeast Yarrowia lipolytica. Bioresour Technol. 2012;114:443–449. doi: 10.1016/j.biortech.2012.02.091. [DOI] [PubMed] [Google Scholar]
- 11.Knothe G. Improving biodiesel fuel properties by modifying fatty ester composition. Energy Environ Sci. 2009;2:759–766. [Google Scholar]
- 12.Abubackar HN, Veiga MC, Kennes C. Biological conversion of carbon monoxide: Rich syngas or waste gases to bioethanol. Biofuels Bioprod Biorefin. 2011;5:93–114. [Google Scholar]
- 13.Tanner RS, Miller LM, Yang D. Clostridium ljungdahlii sp. nov., an acetogenic species in clostridial rRNA homology group I. Int J Syst Bacteriol. 1993;43(2):232–236. doi: 10.1099/00207713-43-2-232. [DOI] [PubMed] [Google Scholar]
- 14.William EB, Schoberth S, Tanner RS, Wolfe RS. Acetobacterium, a new genus of hydrogen-oxidizing, carbon dioxide-reducing, anaerobic bacteria. Int J Syst Evol Microbiol. 1997;27:355–361. [Google Scholar]
- 15.Papoutsakis ET. Re-assessing the progress in the production of advanced biofuels in the current competitive environment and beyond: What are the successes and where progress eludes us and why. Ind Eng Chem Res. 2015;54:10170–10182. [Google Scholar]
- 16.Hill J, Nelson E, Tilman D, Polasky S, Tiffany D. Environmental, economic, and energetic costs and benefits of biodiesel and ethanol biofuels. Proc Natl Acad Sci USA. 2006;103(30):11206–11210. doi: 10.1073/pnas.0604600103. [DOI] [PMC free article] [PubMed] [Google Scholar]
- 17.Köpke M, Mihalcea C, Bromley JC, Simpson SD. Fermentative production of ethanol from carbon monoxide. Curr Opin Biotechnol. 2011;22(3):320–325. doi: 10.1016/j.copbio.2011.01.005. [DOI] [PubMed] [Google Scholar]
- 18.Wilkins MR, Atiyeh HK. Microbial production of ethanol from carbon monoxide. Curr Opin Biotechnol. 2011;22(3):326–330. doi: 10.1016/j.copbio.2011.03.005. [DOI] [PubMed] [Google Scholar]
- 19.Nybo SE, Khan NE, Woolston BM, Curtis WR. Metabolic engineering in chemolithoautotrophic hosts for the production of fuels and chemicals. Metab Eng. 2015;30:105–120. doi: 10.1016/j.ymben.2015.04.008. [DOI] [PubMed] [Google Scholar]
- 20.Chakraborty S. 2013. Exploring volatile fatty acids (VFAs) as a novel substrate for microbial oil production. Thesis (Massachusetts Institute of Technology, Cambridge, MA)
- 21.von Stockar U, Liu J. Does microbial life always feed on negative entropy? Thermodynamic analysis of microbial growth. Biochim Biophys Acta. 1999;1412(3):191–211. doi: 10.1016/s0005-2728(99)00065-1. [DOI] [PubMed] [Google Scholar]
- 22.Fei Q, et al. The effect of volatile fatty acids as a sole carbon source on lipid accumulation by Cryptococcus albidus for biodiesel production. Bioresour Technol. 2011;102(3):2695–2701. doi: 10.1016/j.biortech.2010.10.141. [DOI] [PubMed] [Google Scholar]
- 23.Seifritz C, Fröstl JM, Drake HL, Daniel SL. Influence of nitrate on oxalate- and glyoxylate-dependent growth and acetogenesis by Moorella thermoacetica. Arch Microbiol. 2002;178(6):457–464. doi: 10.1007/s00203-002-0475-6. [DOI] [PubMed] [Google Scholar]
- 24.Damude HG, et al. 2011. High eicosapentaenoic acid producing strains of Yarrowia lipolytica. E. I. Du Pont De Nemours & Co., assignee. Patent US7932077 B2. 26 (April 2011)
- 25.Griffiths MJ, van Hille RP, Harrison STL. Selection of direct transesterification as the preferred method for assay of fatty acid content of microalgae. Lipids. 2010;45(11):1053–1060. doi: 10.1007/s11745-010-3468-2. [DOI] [PubMed] [Google Scholar]
- 26.Xu D, Lewis RS. Syngas fermentation to biofuels: Effects of ammonia impurity raw syngas on hydrogenase activity. Biomass Bioenergy. 2012;45:303–310. [Google Scholar]
- 27.Wang S, Huang H, Kahnt J, Thauer RK. A reversible electron-bifurcating ferredoxin- and NAD-dependent [FeFe]-hydrogenase (HydABC) in Moorella thermoacetica. J Bacteriol. 2013;195(6):1267–1275. doi: 10.1128/JB.02158-12. [DOI] [PMC free article] [PubMed] [Google Scholar]
- 28.Berg JM, Tymoczko JL, Stryer L. Biochemistry. 6th Ed Freeman; New York: 2006. [Google Scholar]
- 29.van Milgen J. Modeling biochemical aspects of energy metabolism in mammals. J Nutr. 2002;132(10):3195–3202. doi: 10.1093/jn/131.10.3195. [DOI] [PubMed] [Google Scholar]
- 30.Shuler ML, Kargi F. Bioprocess Engineering: Basic Concepts. 2nd Ed Prentice Hall; New Jersey: 2001. [Google Scholar]
- 31.Verduyn C. Physiology of yeasts in relation to biomass yields. Antonie van Leeuwenhoek. 1991;60(3–4):325–353. doi: 10.1007/BF00430373. [DOI] [PubMed] [Google Scholar]


