Significance
The notochord is a rod of axial mesoderm that secretes signals that induce formation of vertebrae from somitic mesoderm during embryogenesis. This paper uses genetic approaches in a mouse model to remove function of the Brachyury (T) transcription factor from notochord precursor cells, which show that T regulates notochord cell fate and is consequently essential for normal spine formation. However, progenitor cells deprived of T survive and adopt neural and mesenchymal fates. They proliferate at a high rate and can adopt a mesenchymal morphology, features associated with aggressive behavior in tumors. These results raise concern about appropriate rationales to therapeutically target T in chordomas, sarcomas that arise from notochord rests, as well as other cancers expressing T.
Keywords: notochord, Brachyury, cell fate, EMT
Abstract
The transcription factor Brachyury (T) gene is expressed throughout primary mesoderm (primitive streak and notochord) during early embryonic development and has been strongly implicated in the genesis of chordoma, a sarcoma of notochord cell origin. Additionally, T expression has been found in and proposed to play a role in promoting epithelial–mesenchymal transition (EMT) in various other types of human tumors. However, the role of T in normal mammalian notochord development and function is still not well-understood. We have generated an inducible knockdown model to efficiently and selectively deplete T from notochord in mouse embryos. In combination with genetic lineage tracing, we show that T function is essential for maintaining notochord cell fate and function. Progenitors adopt predominantly a neural fate in the absence of T, consistent with an origin from a common chordoneural progenitor. However, T function is dispensable for progenitor cell survival, proliferation, and EMT, which has implications for the therapeutic targeting of T in chordoma and other cancers.
The notochord, the defining characteristic of chordates, serves as a signaling center for dorsoventral patterning of both the adjacent neural tube and the somites. Sonic hedgehog (Shh) expressed from the notochord specifies ventral neural fates in spinal cord and ventral somitic fate to form sclerotome that gives rise to the vertebrae of the axial skeleton (1, 2). Genetic lineage tracing in the mouse has revealed that later, during the process of intervertebral disk formation, the notochord fragments into discrete segments and differentiates to form the nucleus pulposus of the intervertebral disks (3, 4). It has been proposed that this process generates the notochord “remnants” that can persist within vertebral bodies in adults (5), which are thought to give rise to chordomas, a rare sarcoma of notochord cell origin. A major advance in understanding the pathogenesis of chordoma has been the discovery that Brachyury (T) gene, which is highly expressed in these tumors, is duplicated in certain familial chordomas (6). T expression, which is pathognomonic for diagnosis of these sarcomas (7), has consequently become a major focus for therapeutic targeting in treatment of these cancers (7, 8).
T is the founding member of the T-box gene family of transcription factors (9, 10). During embryonic development, T is expressed in the notochord and primitive streak, and is essential for trunk/tail primary mesoderm formation and migration from the primitive streak, which drives axis elongation (11, 12). Loss of T function in mouse embryos results in body axis truncation caudal to the forelimb, showing that T is dispensable for anterior-most mesoderm formation (rostral to somite 7). The embryonic role in epithelial–mesenchymal transition (EMT) of cells migrating from primitive streak during mesoderm formation has piqued interest that T, which is variably expressed in a number of common cancers in addition to chordoma (8), may play an important role in tumor progression. A functional notochord is absent in T-deletion mutant embryos (11); however, early axis truncation resulting from the loss of T in primitive streak has precluded definitive analysis of its role in notochord formation and maintenance. No conditional genetic approaches in mouse have evaluated the role of T in notochord development selectively in the absence of effects caused by loss at other critical sites of expression. Notably, axis truncations occur in mutants (Wnt3a) that still form a notochord at early stages but fail to maintain a functional primitive streak (13). A recent mouse knockdown model using a ubiquitously expressed T-short hairpin RNA (shRNA) under doxycycline control (14) but with a relatively higher level of knockdown in notochord suggested a critical role for T in maintaining notochord fate and function. However, broad loss of T function resulted in frequent early embryonic lethality before embryonic day 13.5 (E13.5) caused by chorioallantoic defects, and the lack of restricted tissue specificity of the knockdown and inability to trace the fate of notochord progenitors precluded a more definitive analysis of the requirements for T function in notochord formation and maintenance. Consequently, the role of T in notochord differentiation, maintenance, and function has not been selectively evaluated.
We have used a conditional transgenic shRNA approach (15) to generate a Cre-regulated T-knockdown mouse line. When activated using a notochord-selective Cre driver line absent from primitive streak mesoderm (ShhCre) (16), this transgene gives a highly efficient T knockdown in notochord progenitors, while sparing other mesoderm progenitors. In conjunction with genetic lineage tracing, we show that continuing T function is essential for maintaining normal notochord fate and function, but surprisingly, it is dispensable for cell survival, proliferation, and EMT of notochord progenitors. These results suggest that notochord arises from a common chordoneural progenitor and also raise questions about the nature of the role that T plays in the genesis of chordoma and the value of therapeutic inhibition of T in the context of tumor progression promoted by EMT.
Results and Discussion
Efficient T Knockdown in Early Mouse Embryos Using a Cre-Activated Transgenic shRNA Line.
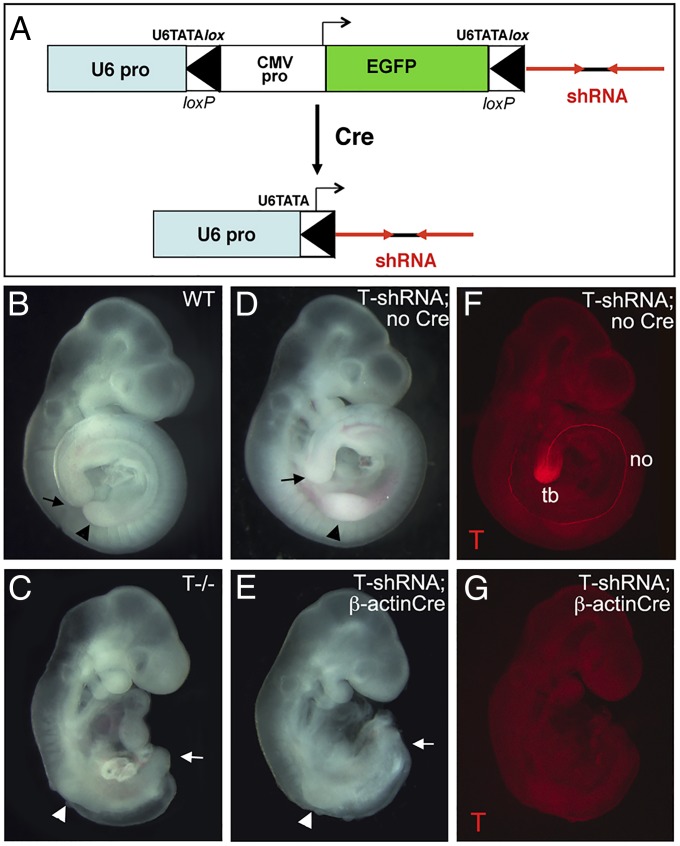
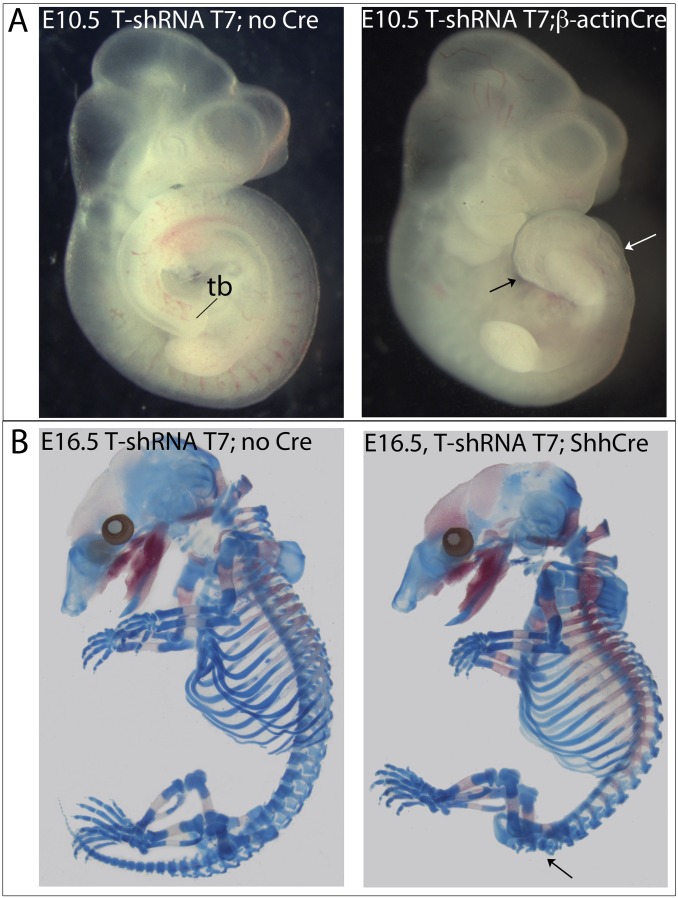
A conditional, Cre-activated shRNA line was generated using the previously developed pSico shRNA expression vector (15), with a Pol-III U6 promoter driving shRNA production that is interrupted by a cytomegalovirus-enhanced green fluorescent protein (CMV-EGFP) reporter flanked by loxP sites (Fig. 1A). After Cre-mediated recombination, the U6 promoter is reconstituted in active form, giving high-level shRNA expression. Based on cell culture screening (Fig. S1 and Table S1), two independent shRNAs giving an 85–90% knockdown (T6 and T7) were selected to produce transgenic mice. Efficacy of T knockdown in early T6- and T7- transgenic embryos was tested in crosses with mice expressing the ubiquitous β-ActinCre. Early ubiquitous knockdown of T in the T6 line was highly efficient and invariably produced a complete loss of T protein (Fig. 1 F and G), recapitulating the T−/− null phenotype in 100% of E9.5–E10.5 T6-shRNA;Cre+ embryos (15 of 15 embryos) (Fig. 1 B–E). A T7-shRNA transgenic line produced similar but milder caudal axis truncation phenotypes than T6 using a ubiquitous Cre driver as well as similar but milder vertebral column phenotypes using a selective notochord Cre driver (Fig. S2 compared with Figs. 1 and 2 A–D and F–I). All additional analyses focused on the T6-shRNA transgenic line (hereafter referred to as T-shRNA), which phenocopied the T−/− null mutant when activated ubiquitously.
Fig. 1.
Construction and efficacy of conditional T-shRNA transgenic line. (A) Schematic diagram showing Cre-inducible shRNA approach. U6 promoter is interrupted by an EGFP expression cassette flanked by loxP sites and inserted into the TATA box. Cre-mediated recombination reconstitutes U6 promoter, activating shRNA expression (15). (B–E) T-shRNA (T6) induced by early ubiquitous β-ActinCre results in truncation caudal to the forelimb level (arrowheads) in E9.5 embryos (15 of 15 embryos), recapitulating T−/− phenotype. Arrows mark caudal axis extent. In the absence of Cre, T-shRNA transgenic embryos develop similarly to WT. (F and G) T-protein immunofluorescence at E9.5 is completely absent in T-shRNA;β-actinCre embryos, whereas strong expression is seen in both notochord (no) and tail bud (tb) in control embryos.
Fig. S1.
Efficiency of T-RNA removal by T6- and T7-shRNA in cultured cells and example of shRNA-vector EGFP cassette expression in transgenic embryos. (A) Efficiency of different T-shRNAs (T1–T7) was assessed by measuring activity of a chimeric Renilla luciferase reporter containing the full-length mouse T-transcript sequence fused to the 3′ end of the luciferase coding region compared with that of the firefly luciferase control. T-shRNAs were cloned into a recombined active version of the pSico vector (EGFP cassette removed) and were cotransfected into NIH 3T3 cells with the chimeric T-luciferase gene to screen for knockdown efficiencies. Empty vector (pSico) and a GFP-shRNA (pSicoGFP) were included as negative controls. Both T6- and T7-shRNAs (shown in A) achieved considerable knockdown of the T-luciferase chimera, averaging 89% for T6-shRNA and 84% for T7-shRNA. The bar graph represents averages from five independent experiments. Statistical significance (P) of difference in normalized luciferase activity was determined using Student’s two-tailed t test. Other shRNAs tested (Table S1) gave knockdown efficiencies ranging between 54% and 75%. (B) Ubiquitous expression of GFP cassette in transgenic pSico-shRNA embryos in the absence of Cre-mediated recombination.
Table S1.
Sequences and knockdown efficiencies of T-shRNAs tested
| shRNA name | shRNA sequence used* | Distance from initiator ATG | T-RNA expression relative to control† | Knockdown efficiency (%) |
| T-shRNA 1 | ACCGGTGTCAACTGGATCT | 1,347 | 0.46 ± 0.21 | 54 |
| T-shRNA 2 | CAACCACCGCTGGAAATAT | 294 | 0.39 ± 0.12 | 61 |
| T-shRNA 3 | CCAGAATGAGGAGATTACA | 594 | 0.40 ± 0.16 | 60 |
| T-shRNA 4 | GCCTCTTGTTTGATACCTA | 1,485 | 0.25 ± 0.06 | 75 |
| T-shRNA 5 | CTCCTTGCATAAGTATGAA | 483 | 0.35 ± 0.12 | 65 |
| T-shRNA 6 | GCTAACTAACGAGATGATTGT | 171 | 0.11 ± 0.02 | 89 |
| T-shRNA 7 | GGGTCCTATATCTTGTGTTTC | 1,604 | 0.15 ± 0.03 | 85 |
Sequence of sense arm only shown; loop sequence used was TTCAAGAGA for all shRNAs (sense arm–loop–antisense arm).
Average and SD from five independent experiments.
Fig. S2.
Early tail bud and late skeletal phenotypes in T7-shRNA T-knockdown embryos. (A) T7-shRNA induced by early ubiquitous β-actinCre results in posterior axis truncation at the sacral level, with malformed tail bud (black arrow) and open posterior neural tube (white arrow), compared with normal Cre-negative siblings at E10.5. This phenotype was milder than that typically observed with activation of T6-shRNA (compare with Fig. 1). (B) E16.5 T7-shRNA;ShhCre embryos show caudal axis truncation and loss of tail and sacral vertebrae (arrow) compared with Cre-negative sibling controls, similar to the mild phenotype class observed in transgenic lines expressing T6-shRNA (compare with Fig. 2). tb, tail bud.
Fig. 2.
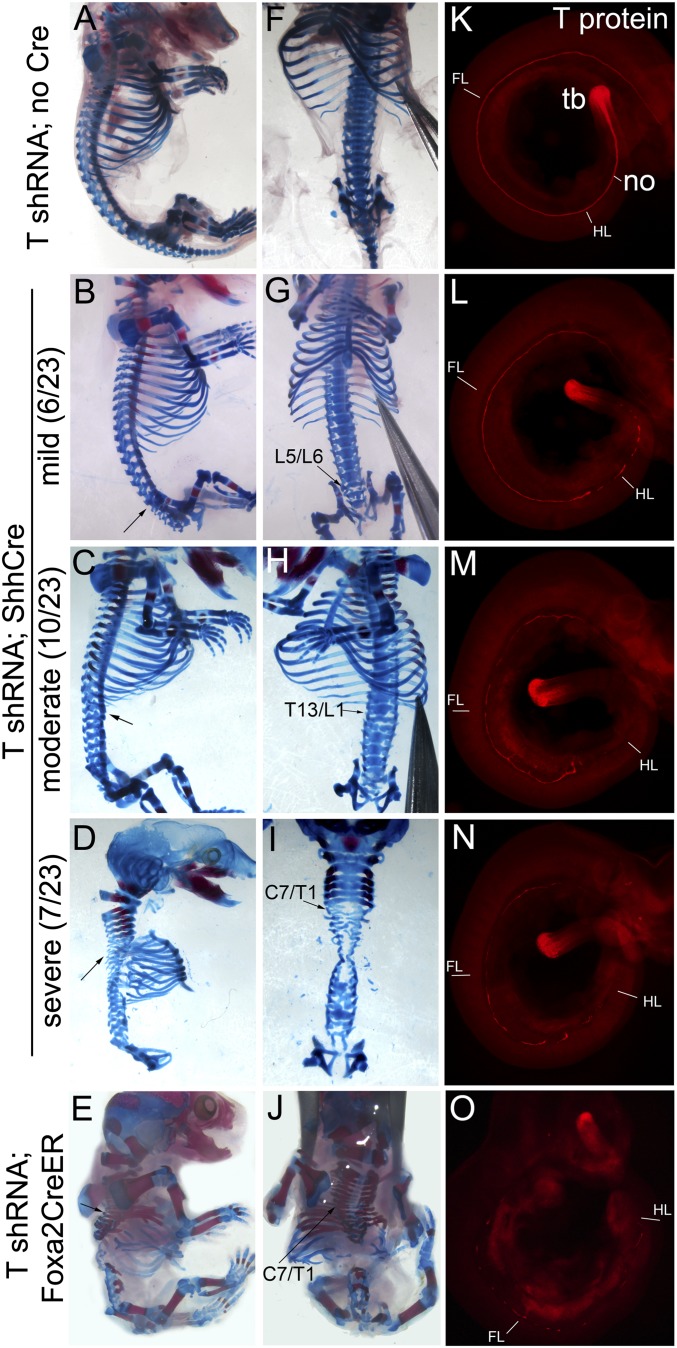
Phenotypes and T-protein levels in embryos with notochord-selective T knockdown. All analyses for this and subsequent figures (Figs. 3–5 and Figs. S1 and S3–S5) were performed using T6-shRNA allele. (A–E) Lateral and (F–J) frontal views of E17.5 skeletal phenotypes in T-shRNA;ShhCre and T-shRNA;Foxa2CreER (tamoxifen at E6.5) embryos compared to (A and F) sibling controls. T-shRNA;Cre+ embryos are categorized according to severity of vertebral loss/malformations (arrows mark rostral level) into (B and G) mild (lumbosacral; 6 of 23 embryos), (C and H) moderate (upper lumbar; 10 of 23 embryos), and (D and I) severe (upper thoracic level; 7 of 23 embryos). In (D, F, H, and I) the hind limbs (F and H), both limbs (D), or limbs plus rib cage (I) were removed to better visualize the entire vertebral column. (K–O) Immunofluorescence for T-protein in T-shRNA;ShhCre and T-shRNA;Foxa2CreER (tamoxifen at E6.5) embryos compared to (K) sibling control. T-protein loss is extensive in notochord (no) of T-shRNA;Foxa2CreER and occurs at varying axial levels in T-shRNA;ShhCre embryos at E10.5, but is completely preserved in tail bud (tb). Notochord T-protein loss in T-shRNA;ShhCre embryos becomes more complete at later stage (Fig. S3). Positions of forelimb (FL) and hind limb (HL) bud posterior borders are indicated in K–O.
Notochord-Specific T Knockdown Causes Severe Vertebral Column Defects Because of Loss of Notochord Cell Fate and Signaling.
To analyze the function of T in notochord selectively, the T-shRNA transgenic line was activated by crossing to ShhCre, a knock-in allele that recapitulates endogenous Shh expression [throughout node and notochord but absent from primitive streak (3, 4, 16)]. Efficacy of recombination was again assessed by immunostaining T-shRNA;ShhCre+ embryos for T protein. Compared with the ubiquitously active β-ActinCre, T protein was selectively lost in notochord but not in primitive streak/tail-bud mesenchyme (Fig. 2 K–N). In situ evaluation of T-transcript levels in knockdown embryos gave comparable results (Fig. S3A).
Fig. S3.
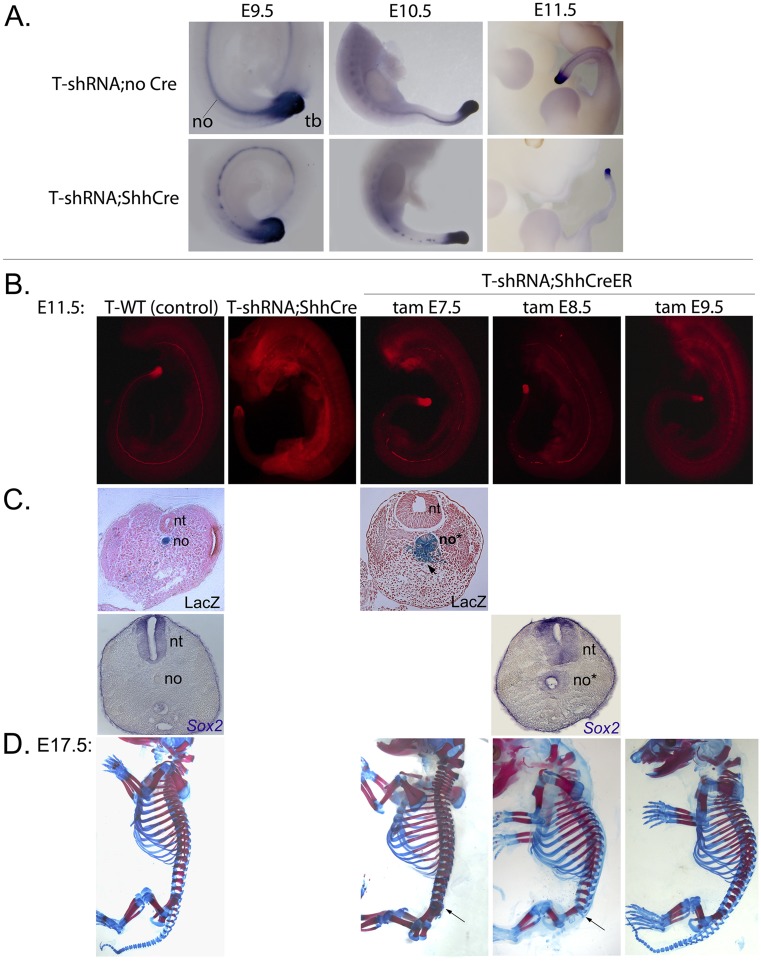
T-transcript and protein levels in T6-shRNA;ShhCre embryos and T-protein levels and phenotypes in T6-shRNA;ShhCreER embryos after T knockdown at different times. (A) Whole-mount in situ RNA hybridization shows progressive loss of T transcripts from notochord of T6-shRNA;ShhCre embryos from E9.5 to E11.5, whereas expression in tail bud mesenchyme is preserved. (B) T immunofluorescence shows essentially complete loss of T protein from notochord in T6-shRNA;ShhCre embryos at E11.5 (compare with Fig. 2) and the extent of T-protein loss in E11.5 T6-shRNA;ShhCreER embryos after a single tamoxifen dose (2 mg) ranging from E7.5 to E9.5. (C) LacZ activity or Sox2 expression in transverse caudal trunk sections of E11.5 T6-shRNA;ShhCreER;RosaLacZ embryos shows notochord progenitor expansion and fate change to form ectopic neural tubes as well as loose mesenchymal cells (arrow), similar to T6-shRNA;ShhCre embryos (compare with Fig. 4). (D) T6-shRNA;ShhCreER;RosaLacZ vertebral skeletal phenotypes (E17.5), with rostral level of vertebral malformations/loss indicated by arrows for E7.5 or E8.5 shRNA activation. After E9.5 tamoxifen treatment, weaker but contiguous T-protein expression is detected along the entire notochord (in B), and no vertebral abnormalities are seen at E17.5. no, notochord; no*, T-knockdown notochord; nt, neural tube; tam, tamoxifen; tb, tail bud.
Loss of T transcripts and T protein in notochord was already extensive by E10.5 and completely absent by E11.5 (Fig. 2 and Fig. S3 A and B). At E10.5, T-shRNA activated by ShhCre produced varying degrees of T-protein loss in notochord, ranging from extensive loss throughout the body axis to more limited loss confined to the tail region, with roughly one-third of embryos falling into each category (Fig. 2 K–N). Evaluation of skeletal phenotypes in late-stage embryos revealed vertebral column defects, including complete loss of vertebrae and axial truncation, as well as malformations, which also ranged from mild to severe, correlating with T-protein loss at early stages, with about one-third of embryos in each phenotypic category (Fig. 2 A–D and F–I). T expression in node/notochord precedes that of Shh slightly (2, 17); consequently, knockdown of T using ShhCre occurs with a slight lag that may lead to variation in the timing of T-protein loss and severity of subsequent skeletal phenotypes. To confirm this impression, we evaluated phenotypes after T-shRNA activation using a Cre line driven by regulatory sequences of forkhead box A2 (Foxa2), which acts upstream of T in node/notochord (discussed in ref. 18). Nonconditional Foxa2Cre lines that have been generated to date produce mosaic recombination in notochord (figure 2C in ref. 19 and figure 4 C and D in ref. 20). Therefore, we used a recently described, highly efficient, tamoxifen-regulated Foxa2CreER line (21) to activate the T-shRNA with tamoxifen at E6.5. Using Foxa2CreER, T-protein loss in notochord was already much more extensive by E10.5 (Fig. 2O compared with Fig. 2 L–N), and only cervical vertebrae formed normally at E17.5 with extensive loss and malformation caudal to the cervical level (in 50%) (Fig. 2 E and J). Even in less severe cases, vertebral loss began at the midthoracic level (∼T7 in 50%). Because a nonconditional Cre ensures greater consistency and complete recombination and marks the entire notochord lineage in T-knockdown embryos, T-shRNA;ShhCre embryos were used to characterize T-knockdown phenotypes.
Evaluation of somitic mesoderm precursors of vertebrae revealed apoptosis by E10.5, becoming extensive by E11.5 in T-shRNA;ShhCre embryos (Fig. 3 G–L). A major early notochord function is production of Shh, which signals to the somites to sustain cell survival and induce ventral sclerotome fate (vertebral progenitors) (1, 2). The loss of vertebrae caused by marked apoptosis in somites in T-knockdown embryos is highly reminiscent of the Shh−/− phenotype in axial skeleton (2). In fact, in situ hybridization analysis showed complete loss of Shh transcripts caudally in T-knockdown notochord (Fig. 3 A and B). Loss of Shh signaling can account for both the extensive apoptosis in somites and the ensuing vertebral loss observed, which are very similar to those occurring in Shh mutant embryos (2), with the exception that, in the Shh null mutant, no vertebral skeleton forms at all. Sparing of the cervical vertebrae in the T knockdown (Fig. 2 D, E, I, and J) occurred even in T-shRNA;Foxa2CreER embryos, despite extensive rostral T-protein loss, and may reflect differential requirements for T function in regulating notochord formation along the rostrocaudal axis. Notably, head process notochord, which arises extranodally, still forms and expresses Shh in T−/− embryos (17, 18, 22). Quantitative differences in T requirement for axis formation occur caudally (23), but it was not previously known if tail phenotypes in haplo-insufficient T+/− mice primarily result from reduced T levels in notochord or tail-bud mesenchyme (late primitive streak equivalent). Our results indicate that selective reduction of T function in notochord alone can produce tail truncation phenotypes as seen in T+/− mice. Our results also indicate that sustained T expression is required for a functional notochord to maintain expression of the downstream signaling factor Shh.
Fig. 3.
Expression of notochord regulators and Shh and somite apoptosis in T-knockdown embryos. (A–F) Axial notochord expression of Shh and Noto is lost in E10.5 T-shRNA;ShhCre embryos compared with Cre-negative sibling controls, whereas expression of Foxa2, acting upstream of T, is preserved. Altered tail Foxa2 thickness in T-shRNA;ShhCre reflects morphologic changes in axial progenitors as shown in transverse sections (Insets in E and F) (Fig. 4 also demonstrates axial progenitor expansion). (G–L) Lysotracker staining shows apoptosis in somites in T-shRNA;ShhCre embryos beginning at E10.5 and becoming extensive by E11.5 and E12.5 compared with Cre-negative sibling controls. Insets in G–L show transverse sections of tail at levels indicated by dotted lines. fp, floorplate; hg, hindgut; HL, hind limb bud; no, notochord; no*, T-knockdown notochord; nt, neural tube; tip, tail distal tip.
Expression of other notochord markers examined was consistent with the regulatory hierarchy of notochord development established from the analysis of mouse null mutants in different notochord transcriptional regulators; Foxa2 functions upstream and Noto functions downstream of T in notochord specification (discussed in ref. 18). Noto, acting downstream of T in caudal notochord, was completely absent (Fig. 3 C and D), whereas Foxa2, acting upstream of T, was still present in the remaining structure formed by notochord progenitors in the T-knockdown embryos (Fig. 3 E and F). Interestingly, Shh, a direct target of Foxa2 (ref. 24 and references therein), was not expressed in T-knockdown notochords, despite persistent Foxa2 expression. Although essential, Foxa2 does not suffice for notochord Shh expression in the absence of T.
T-Knockdown Notochord Progenitors Survive but Adopt Neural and Mesenchymal Fates.
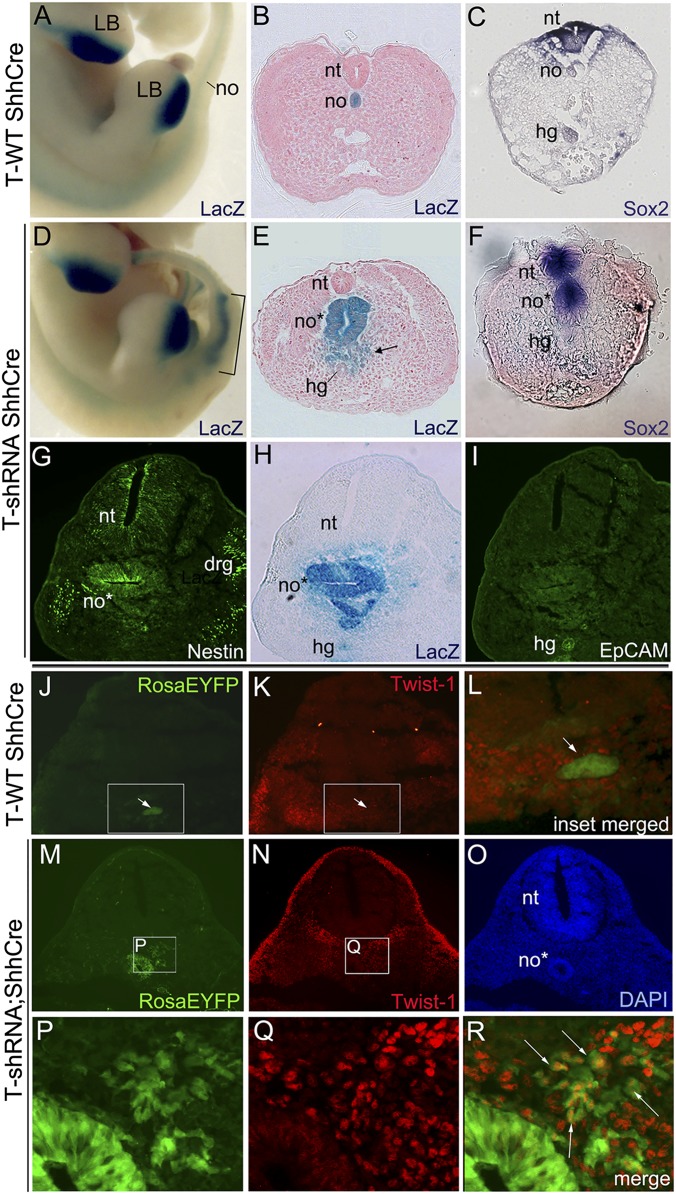
Midline axial Foxa2 expression in knockdown embryos suggested that notochord progenitors persisted in a nonfunctional notochord structure. To determine the fate of progenitors after T knockdown, a Rosa-β-galactosidase (RosaLacZ) (or for some experiments, RosaEYFP) reporter allele was introduced into the T-shRNA;ShhCre line to genetically label notochord progenitors that have expressed ShhCre and trace the fate of these progenitors. LacZ staining revealed that notochord progenitors in T-knockdown embryos survived and formed a broad epithelial structure in place of a well-defined notochord in the sacral region (Fig. 4 A and D) (also observed in T-shRNA;Foxa2CreER embryos). Cross-sections at the caudal trunk/tail level showed that T-knockdown notochord progenitors formed both large, ectopic epithelial tubular structures as well as loose mesenchymal cell aggregates (Fig. 4 B and E). Staining for the panneural markers Sox2 (25) and Nestin (26), expressed in neural tube but not normal notochord, revealed that the T-knockdown notochordal progenitors in tubular structures had adopted a neural fate, forming ectopic neural tubes (Fig. 4 C and F–H), whereas the gut-specific epithelial marker, EpCAM (27), was not expressed (Fig. 4I). This fate change is reminiscent of ectopic neural tube phenotypes produced when mesodermal fate is inhibited in paraxial mesoderm progenitors (13), and it is also seen at low frequency in T+/− embryos in the caudal tail region (23) but has been attributed to T loss in primitive streak/paraxial progenitors. Our results indicate that notochord progenitors can also be diverted to neural fate in the absence of T function. Interestingly, ectopic neural structures were also observed in a previous report using a doxycycline-regulated T knockdown (14), but lack of lineage tracing and tissue restriction of the knockdown precluded establishing a definite causal relationship.
Fig. 4.
Notochord lineage tracing and fate analysis in E12 T-knockdown embryos. (A, B, D, and E) LacZ reporter activity in notochord lineage in T-shRNA;RosaLacZ;ShhCre and control RosaLacZ;ShhCre sibling embryos (A and D whole mount; B and E transverse tail sections). Notochord progenitors in T-knockdown embryos survive and expand (bracketed area in D) to form large epithelial tubular structures (E) as well as loose mesenchymal cells (arrow in E). In A and D normal limb bud LacZ activity (Shh-expressing) is also seen. (C, F, and G-I) Neural and gut endoderm marker analysis in T-knockdown embryos. (C and F) Early panneural marker Sox2 RNA is expressed in ectopic tubes of T-knockdown embryos as well as in neural tube compared with WT sibling control. (G–I) Immunofluorescence staining in T-knockdown for (G) panneural (Nestin) and (I) gut endoderm (EpCAM) markers compared with (H) LacZ reporter activity in serial sections. LacZ-positive ectopic tubular structures express neural but not hindgut marker. (J–R) Immunofluorescence for (K, N, and Q) the EMT marker Twist-1 (red) and (J, M, and P) visualization of notochord lineage cells (green) on the same section of T-shRNA;RosaEYFP;ShhCre or control RosaEYFP;ShhCre sibling embryos. Mesenchymal-appearing notochord lineage cells (arrows in R) are Twist-1–positive in T-knockdown embryos, whereas WT notochord (arrows in J–L) is Twist-1–negative. (L) Enlargement of merged image from boxed region in J and K. (P–R) Enlargements and merged image of boxed region in M and N. DAPI staining is shown in O. Note that background fluorescence from capillary endothelium is seen both within and around neural tube in M (confirmed by CD31 immunostaining). drg, dorsal root ganglia; hg, hindgut; LB, limb bud; no, notochord; no*, ectopic tubular structures; nt, neural tube.
This fate switch is consistent with the model that notochord and ventral neural tube both arise from a common pluripotent progenitor in the anterior node and within the “chordoneural” hinge region in the tail bud (28). Because the ShhCre knock-in allele is expressed early in both the node and chordoneural hinge Shh domains (16, 28), loss of T function in this progenitor population may divert cell fate toward the neural lineage. Timed activation of T knockdown by tamoxifen in T-shRNA;ShhCreER embryos suggests that sustained T function is also required to maintain a functional notochord and notochord cell fate. Tamoxifen treatment at E8.5 still resulted in conversion of notochord to a neural fate and subsequent caudal vertebral loss/malformations (Fig. S3), but effects after E8.5 could not be assessed owing to T-protein perdurance after tamoxifen activation at later stages.
T Is Dispensable for both Notochord Progenitor Proliferation and Ability to Undergo EMT.
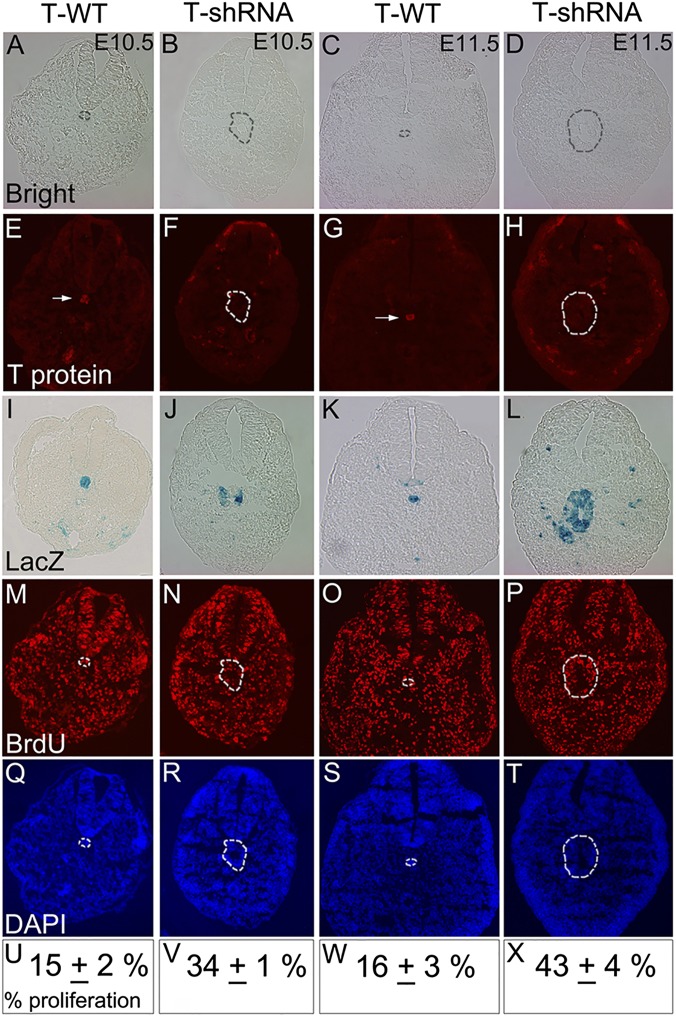
Because notochord progenitors persist and form large tubular epithelial structures in T-knockdown embryos, their proliferation was analyzed. Notably, the proliferation rate in notochord progenitors of T-knockdown embryos was increased by more than twofold at two different stages compared with that in control notochord (Fig. 5 M–X and Table S2). Evaluation of T protein by immunofluorescence on sections (Fig. 5 E–H and Fig. S4) and flow cytometric analysis of dissociated axial structures (Fig. S5) confirmed the absence of any detectable T protein in these proliferating neural structures of notochord lineage. Several previous studies have suggested that T is essential for EMT in tumor cells (reviewed in ref. 8), and in chimeric embryos, T−/− primitive streak cells fail to undergo EMT (12). However, in T-knockdown embryos, mesenchymal morphologies were also observed (Fig. 4E, arrow), suggesting that loss of T does not block EMT in notochord progenitors. To confirm this impression, the presence of Twist-1, a nuclear regulator of EMT that is highly expressed in early trunk mesenchyme (29, 30), was evaluated (Fig. 4 J–R). As expected, normal notochord and neural tube, both epithelial-type structures, do not express Twist-1 (Fig. 4 J–L). T-knockdown notochord progenitors (RosaEYFP reporter-positive cells) that formed ectopic neural tubes did not express Twist-1. However, the adjacent RosaEYFP-positive loose mesenchymal cells (also of notochord lineage) showed clear nuclear Twist-1 expression (Fig. 4 M–R, arrows), consistent with their morphology. These results indicate that T is important for maintaining notochord fate but dispensable for cell survival, proliferation, and mesenchymal transition (ability to undergo EMT) in notochord progenitors. In the early embryo, T is essential to specify nascent mesoderm and necessary for EMT during egress from the primitive streak (12). However, the role of T in regulating EMT may be very indirect and context-dependent. Indeed, ongoing T expression occurs in normal notochord and descendant cells in the nucleus pulposus of intervertebral discs into adulthood (4, 5), tissues that normally do not undergo EMT.
Fig. 5.
Proliferation rates in notochord lineage of T-knockdown embryos relative to control notochord. (A–D and M–X) BrdU immunofluorescence analysis of tail sections from T-shRNA;RosaLacZ;ShhCre (T-shRNA) or RosaLacZ;ShhCre (T-WT) sibling control embryos at E10.5 and E11.5. (A–D) Bright-field images, (M–P) BrdU immunofluorescence and (Q–T) DAPI nuclear staining shown for the same sections. (E–L) LacZ reporter staining and T-protein immunofluorescence in adjacent serial sections identify ectopic tubular structures derived from notochord progenitors in T-shRNA;ShhCre embryos and normal notochord in controls (demarcated by dotted lines in A–H and M–T). Immunofluorescence reveals T protein (arrows in E and G) present in notochord of controls but absent from ectopic tubular structures in T-knockdown embryos. Immuofluorescence and flow cytometric analyses quantitating T expression in notochord lineage are shown in Figs. S4 and S5. (U–X) Average proliferation rates in notochord lineage in T knockdown are more than twofold higher than T-WT notochord (determined from percentage of BrdU+ cells in areas outlined by dotted lines in A–H and M–T). Average proliferation rates and SDs were derived from counting multiple sections of three independent embryos for each stage and genotype (data are in Table S2).
Table S2.
BrdU incorporation in notochord lineage in T-shRNA;RosaLacZ;ShhCre and control sibling RosaLacZ;ShhCre embryos
| Sections analyzed | No. of BrdU+ cells | Total cell no. | BrdU+ fraction | Average BrdU+ fraction | Age-average BrdU+ fraction | SD* |
| E10.5 T-shRNA(−);ShhCre (control) | ||||||
| Litter 1 | ||||||
| Section 1 | 1 | 9 | 0.11 | 0.18 | 0.15 | 0.02 |
| Section 2 | 1 | 7 | 0.14 | |||
| Section 3 | 3 | 11 | 0.27 | |||
| Litter 2 | ||||||
| Section 1 | 2 | 12 | 0.17 | 0.14 | ||
| Section 2 | 1 | 10 | 0.10 | |||
| Section 3 | 2 | 13 | 0.15 | |||
| Litter 3 | ||||||
| Section 1 | 2 | 11 | 0.18 | 0.14 | ||
| Section 2 | 1 | 12 | 0.08 | |||
| Section 3 | 1 | 6 | 0.17 | |||
| E10.5 T-shRNA(+);ShhCre | ||||||
| Litter 1 | ||||||
| Section 1 | 9 | 24 | 0.38 | 0.35 | 0.34 | 0.01 |
| Section 2 | 11 | 30 | 0.37 | |||
| Section 3 | 11 | 37 | 0.30 | |||
| Litter 2 | ||||||
| Section 1 | 10 | 34 | 0.29 | 0.34 | ||
| Section 2 | 5 | 14 | 0.36 | |||
| Section 3 | 11 | 29 | 0.38 | |||
| Litter 3 | ||||||
| Section 1 | 7 | 21 | 0.33 | 0.33 | ||
| Section 2 | 10 | 34 | 0.29 | |||
| Section 3 | 13 | 37 | 0.35 | |||
| E11.5 T-shRNA(−);ShhCre (control) | ||||||
| Litter 1 | ||||||
| Section 1 | 1 | 9 | 0.11 | 0.13 | 0.16 | 0.03 |
| Section 2 | 2 | 10 | 0.20 | |||
| Section 3 | 1 | 13 | 0.08 | |||
| Litter 2 | ||||||
| Section 1 | 4 | 16 | 0.25 | 0.19 | ||
| Section 2 | 2 | 16 | 0.13 | |||
| Litter 3 | ||||||
| Section 1 | 2 | 13 | 0.15 | 0.15 | ||
| Section 2 | 2 | 14 | 0.14 | |||
| Section 3 | 2 | 13 | 0.15 | |||
| E11.5 T-shRNA(+);ShhCre | ||||||
| Litter 1 | ||||||
| Section 1 | 17 | 50 | 0.34 | 0.46 | 0.43 | 0.04 |
| Section 2 | 40 | 76 | 0.53 | |||
| Section 3 | 29 | 55 | 0.53 | |||
| Litter 2 | ||||||
| Section 1 | 33 | 76 | 0.43 | 0.39 | ||
| Section 2 | 20 | 67 | 0.30 | |||
| Section 3 | 29 | 70 | 0.41 | |||
| Section 4 | 34 | 86 | 0.40 | |||
| Section 5 | 33 | 82 | 0.40 | |||
| Litter 3 | ||||||
| Section 1 | 12 | 28 | 0.43 | 0.42 | ||
| Section 2 | 34 | 80 | 0.43 | |||
| Section 3 | 15 | 40 | 0.38 | |||
| Section 4 | 28 | 60 | 0.47 |
Standard deviation.
Fig. S4.
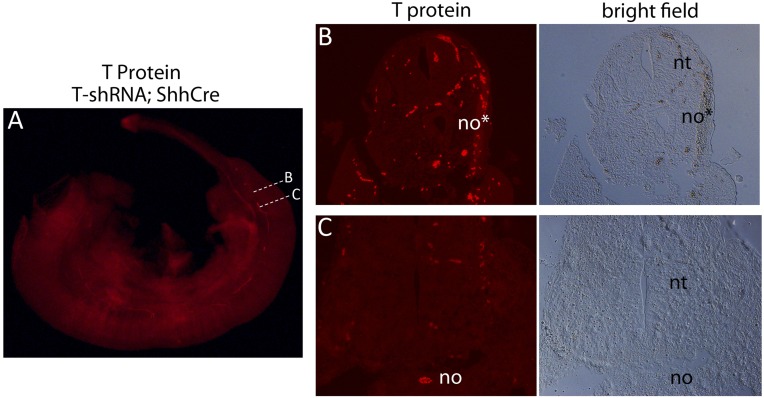
Comparison of notochord morphology in T6-shRNA;ShhCre embryos in regions with or without detectable residual T protein. (A) Whole-mount T immunofluorescence in notochord of an E11.5 T6-shRNA;ShhCre embryo showing areas with (B) undetectable or (C) residual T protein. Dotted lines mark levels of transverse histological sections shown in B and C. (B) Fluorescence and bright field images of transverse section at level B with no detectable T protein shows expanded neural tube-like morphology in position of notochord. (Note that intense autofluorescence is seen in red blood cells.) (C) Fluorescence and bright field images of transverse section at level C with residual detectable T protein shows a normal notochord morphology. no, notochord; no*, T-knockdown notochord; nt, neural tube.
Fig. S5.
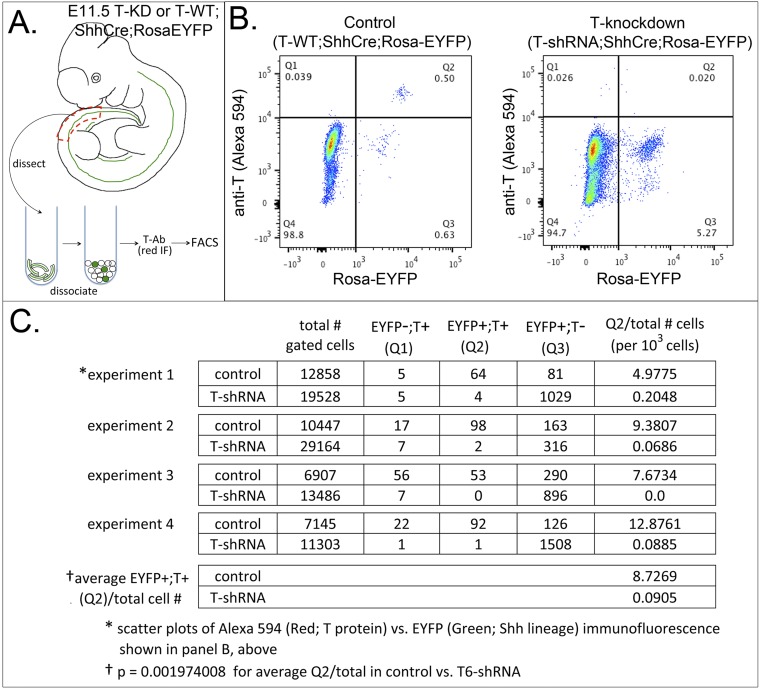
Flow cytometric analysis of T-protein levels in notochord lineage cells of T-knockdown embryos. (A) Schematic diagram shows tissue dissection for FACS from T6-shRNA;ShhCre;RosaEYFP or T-WT;ShhCre;RosaEYFP embryos. The caudal axial trunk region (red dashed line) was dissected and pooled from several embryos of the same genotype in the same litter, dissociated, stained for T protein by immunofluorescence (IF) with anti-T primary antibody and Alexa 594-conjugated secondary antibody (Materials and Methods), and analyzed for EYFP (Shh lineages: notochord/floorplate) and Alexa 594 Red (T protein) levels by FACS. (B) Scatterplots of EYFP/green (ShhCre-lineage) and red fluorescence (T protein) intensities. In T-WT;ShhCre;RosaEYFP controls, 0.50% of total gated cells (64 of 12,858) are both EYFP+ and T+ (notochord cells). In T6-shRNA;ShhCre;RosaEYFP embryos, only 0.02% (4 of 19,528) are double positive, indicating that only rare cells in the notochord lineage retain T protein in T-knockdown embryos, whereas Shh-lineage+ cells lacking T are greatly expanded (1,029 of 19,528; ectopic neural tubes) compared with sibling control (81 of 12,858; floorplate cells). (C) Table summarizing results from four independent sorting experiments. Q2 (EYFP+;T+) population percentage (column 6) is drastically reduced in T-knockdown embryos compared with control siblings (0.09 vs. 8.73 per 1,000 cells), with a P value of 0.002 (Student’s t test). Additional control tissues for flow cytometric analysis included dissociated limb buds (Shh lineage-EYFP+; T-Alexa 594-negative controls) and tail buds (T-Alexa 594+; Shh lineage-negative controls) to establish background and positive signal levels.
T expression is reactivated in several cancer types, including lung, colorectal, and prostate cancer (reviewed in ref. 8), a finding that has led to the proposal that, as in primitive streak, T drives EMT in tumors, contributing to aggressiveness and progression; and which has sparked interest in evaluating T as a potential therapeutic target for cancer treatment. Several studies have reported that targeting T expression decreases proliferation and inhibits EMT in cultured cancer cells (8, 31). However, Huang et al. (32) found lower proliferation in human lung carcinoma cells with higher levels of T, suggestive of stem cell behavior. In the current report, cell lineage marking to definitively identify T-knockdown notochord cells revealed a high proliferation rate compared with WT notochord cells, which are relatively quiescent (4). Loss of T function also did not prevent these cells from adopting a mesenchymal morphology. Our results raise concern that targeting T may not be effective in curtailing aggressive tumor behavior, particularly in chordomas, despite their notochordal origin. Although T may play an important role in maintaining “stem cell” characteristics, particularly in the primitive streak, this role may not be essential in all progenitor pools as suggested by the extensive proliferation of notochord progenitors in T-knockdown embryos. Notably, this expansion of progenitors typically occurs in the caudal trunk notochord (sacral region), despite having the most complete T loss in knockdown embryos. It is in this same region, which is also the most common site for occurrence of chordomas (7), that the transition to a distinct “tail” notochord progenitor population occurs (18). Although a large body of evidence indicates that T plays a key role in the genesis of chordoma, the nature of that role and the mechanism by which T duplication predisposes to these sarcomas are poorly understood. Normal T expression in both notochord and notochord lineage through adulthood (nucleus pulposus) (5) is associated with relatively quiescent states. However, it is also possible that altered, nonphysiologic T function (for example, caused by missense mutations) occurs in the context of these tumors, as seen for p53 (33) and chromatin remodeling complex (BAF) components (34) in the context of oncogenesis. In fact, certain T-sequence variants are associated with increased chordoma risk, but the functional consequences of these changes are unknown (35). Our results highlight that the role of T in the pathogenesis of chordoma demands additional investigation to guide rational intervention.
Materials and Methods
In Vitro Screening of shRNAs.
Palindromic DNA sequences targeting mouse T mRNA, designed using both Dharmacon and Invitrogen software (sequences are listed in Table S1), were screened for efficacy in cell culture using a chimeric luciferase reporter with full-length mouse T-cDNA fused downstream of the luciferase coding region. A 2.2-kb cDNA corresponding to full-length mouse T mRNA was inserted at the 3′ end of the renilla luciferase gene in the phRL-CMV vector (Promega) to generate a chimeric T luciferase. Chimeric T luciferase was cotransfected with different T-shRNA vectors and pGL4 firefly luciferase for normalization, and dual-luciferase assay (Promega) was performed to determine the knockdown efficiency of different T-shRNAs, which ranged from 50% to 90%. Transgenic lines were generated using the two most efficient T-shRNAs (T6 and T7) (Fig. S1).
T-shRNA Transgenic Mice and Other Mouse Lines Used.
T6- and T7-shRNAs were inserted into the pSico lentiviral vector (15) and cotransfected with VSV-G envelope glycoprotein gene vector and Δ8.9 packaging vector into 293 cells using Superfect Reagent (Qiagen). Supernatants were collected 48 h posttransfection, filtered (0.45 μm), and centrifuged at 25,000 rpm in an SW28 Rotor for 90 min at 4 °C. The viral pellet was resuspended, titered, and microinjected into the perivitelline space of single-cell mouse embryos, which were implanted into pseudopregnant female recipients (36). T6- and T7-transgenic lines were established from founders with strong ubiquitous EGFP expression (Fig. 1, Figs. S1 and S2, and Table S1). A LacZ/GFP knock-in into the endogenous T gene that generates an easily genotyped T-KO allele (B6.129TEGFP) was generously provided by Richard Behringer, University Texas MD Anderson Cancer Center, Houston. Other mouse lines, including Foxa2CreER (21) (Foxa2nEGFP-CreERT2/1; Riken CDB0601K; www.clst.riken.jp/arg/), ShhCre and ShhCreER (16) [Shhtm1(EGFP/cre)Cjt and Shhtm2(cre/ERT2)Cjt, respectively], β-ActinCre (37) [Tg-(β-ActinCre)], RosaLacZ (38) [Gt(ROSA)26Sortm1Sor], and RosaEYFP (39) [Gt(ROSA)26Sortm1(EYFP)Cos], have all been described. All mouse experiments were approved by the Animal Care and Use Committee of the NCI.
Embryo Preparation and Analyses.
Twelve hundred hour (noon) on the day of the postcoital plug was considered to be E0.5. Collection and processing of embryos for in situ hybridization, flow cytometry (FACS), immunofluorescence, BrdU incorporation, and for LacZ, lysotracker or skeletal staining, were all performed as previously described (27, 40). For immunofluorescence, anti-T from R&D Systems (AF2085), anti-EpCAM (Rat-G8.8) and anti-Nestin (Rat-401) from the Developmental Studies Hybridoma Bank, and anti–Twist-1 from Millipore (ABD29) were used. Lysotracker Red was used to visualize apoptosis in whole-mount embryos and frozen sections (40). For proliferation assays, 1 mg BrdU was injected i.p. 60 min before embryo collection, and BrdU+ per total DAPI-stained nuclei (anti-BrdU; 555627; BD Pharmagen) present in LacZ+ notochord or ectopic tubular structures were counted on three to five stained sections for T-shRNA–expressing and control sibling embryos from three independent litters each at stages E10.5 and E11.5 (Fig. 5 and Table S2). For FACS analysis of notochord lineage (Fig. S5), dissociated cells from caudal axial trunk tissue (excluding ventral hindgut and hind limb buds) of E11.5 T-shRNA;RosaEYFP;ShhCre or RosaEYFP;ShhCre controls were permeabilized with 0.2% Triton and treated with anti-T at 1 μg/mL and Alexa 594-conjugated secondary antibody. For analysis of timed T-knockdown activation in T-shRNA;ShhCreER embryos (Fig. S3), tamoxifen was administered by i.p. injection (2 mg) as previously described (40).
Acknowledgments
We thank CDBL members for discussions and comments on the manuscript; Richard Behringer for providing the T-KO mice; Hiroshi Sasaki and the Riken CDB Animal Resources and Genetic Engineering for Foxa2CreER knock-in mice; Brian Harfe, Bernhard Herrmann, Andrew McMahon, and Mark Udey for probes and antibody; and Lionel Feigenbaum for generating transgenic mice. This research was supported by the intramural program of the CCR, NCI.
Footnotes
The authors declare no conflict of interest.
This article is a PNAS Direct Submission. V.E.P. is a guest editor invited by the Editorial Board.
This article contains supporting information online at www.pnas.org/lookup/suppl/doi:10.1073/pnas.1601252113/-/DCSupplemental.
References
- 1.Stemple DL. Structure and function of the notochord: An essential organ for chordate development. Development. 2005;132(11):2503–2512. doi: 10.1242/dev.01812. [DOI] [PubMed] [Google Scholar]
- 2.Chiang C, et al. Cyclopia and defective axial patterning in mice lacking Sonic hedgehog gene function. Nature. 1996;383(6599):407–413. doi: 10.1038/383407a0. [DOI] [PubMed] [Google Scholar]
- 3.Choi KS, Cohn MJ, Harfe BD. Identification of nucleus pulposus precursor cells and notochordal remnants in the mouse: Implications for disk degeneration and chordoma formation. Dev Dyn. 2008;237(12):3953–3958. doi: 10.1002/dvdy.21805. [DOI] [PMC free article] [PubMed] [Google Scholar]
- 4.Choi KS, Harfe BD. Hedgehog signaling is required for formation of the notochord sheath and patterning of nuclei pulposi within the intervertebral discs. Proc Natl Acad Sci USA. 2011;108(23):9484–9489. doi: 10.1073/pnas.1007566108. [DOI] [PMC free article] [PubMed] [Google Scholar]
- 5.Risbud MV, Schaer TP, Shapiro IM. Toward an understanding of the role of notochordal cells in the adult intervertebral disc: From discord to accord. Dev Dyn. 2010;239(8):2141–2148. doi: 10.1002/dvdy.22350. [DOI] [PMC free article] [PubMed] [Google Scholar]
- 6.Yang XR, et al. T (brachyury) gene duplication confers major susceptibility to familial chordoma. Nat Genet. 2009;41(11):1176–1178. doi: 10.1038/ng.454. [DOI] [PMC free article] [PubMed] [Google Scholar]
- 7.Nibu Y, José-Edwards DS, Di Gregorio A. From notochord formation to hereditary chordoma: The many roles of Brachyury. BioMed Res Int. 2013;2013:826435. doi: 10.1155/2013/826435. [DOI] [PMC free article] [PubMed] [Google Scholar]
- 8.Palena C, et al. Strategies to target molecules that control the acquisition of a mesenchymal-like phenotype by carcinoma cells. Exp Biol Med (Maywood) 2011;236(5):537–545. doi: 10.1258/ebm.2011.010367. [DOI] [PMC free article] [PubMed] [Google Scholar]
- 9.Herrmann BG, Labeit S, Poustka A, King TR, Lehrach H. Cloning of the T gene required in mesoderm formation in the mouse. Nature. 1990;343(6259):617–622. doi: 10.1038/343617a0. [DOI] [PubMed] [Google Scholar]
- 10.Naiche LA, Harrelson Z, Kelly RG, Papaioannou VE. T-box genes in vertebrate development. Annu Rev Genet. 2005;39:219–239. doi: 10.1146/annurev.genet.39.073003.105925. [DOI] [PubMed] [Google Scholar]
- 11.Herrmann BG. Expression pattern of the Brachyury gene in whole-mount TWis/TWis mutant embryos. Development. 1991;113(3):913–917. doi: 10.1242/dev.113.3.913. [DOI] [PubMed] [Google Scholar]
- 12.Wilson V, Manson L, Skarnes WC, Beddington RS. The T gene is necessary for normal mesodermal morphogenetic cell movements during gastrulation. Development. 1995;121(3):877–886. doi: 10.1242/dev.121.3.877. [DOI] [PubMed] [Google Scholar]
- 13.Yamaguchi TP, Takada S, Yoshikawa Y, Wu N, McMahon AP. T (Brachyury) is a direct target of Wnt3a during paraxial mesoderm specification. Genes Dev. 1999;13(24):3185–3190. doi: 10.1101/gad.13.24.3185. [DOI] [PMC free article] [PubMed] [Google Scholar]
- 14.Pennimpede T, et al. In vivo knockdown of Brachyury results in skeletal defects and urorectal malformations resembling caudal regression syndrome. Dev Biol. 2012;372(1):55–67. doi: 10.1016/j.ydbio.2012.09.003. [DOI] [PubMed] [Google Scholar]
- 15.Ventura A, et al. Cre-lox-regulated conditional RNA interference from transgenes. Proc Natl Acad Sci USA. 2004;101(28):10380–10385. doi: 10.1073/pnas.0403954101. [DOI] [PMC free article] [PubMed] [Google Scholar]
- 16.Harfe BD, et al. Evidence for an expansion-based temporal Shh gradient in specifying vertebrate digit identities. Cell. 2004;118(4):517–528. doi: 10.1016/j.cell.2004.07.024. [DOI] [PubMed] [Google Scholar]
- 17.Conlon FL, Wright CVE, Robertson EJ. Effects of the TWis mutation on notochord formation and mesodermal patterning. Mech Dev. 1995;49(3):201–209. doi: 10.1016/0925-4773(94)00318-h. [DOI] [PubMed] [Google Scholar]
- 18.Yamanaka Y, Tamplin OJ, Beckers A, Gossler A, Rossant J. Live imaging and genetic analysis of mouse notochord formation reveals regional morphogenetic mechanisms. Dev Cell. 2007;13(6):884–896. doi: 10.1016/j.devcel.2007.10.016. [DOI] [PubMed] [Google Scholar]
- 19.Uetzmann L, Burtscher I, Lickert H. A mouse line expressing Foxa2-driven Cre recombinase in node, notochord, floorplate, and endoderm. Genesis. 2008;46(10):515–522. doi: 10.1002/dvg.20410. [DOI] [PubMed] [Google Scholar]
- 20.Kumar A, Yamaguchi T, Sharma P, Kuehn MR. Transgenic mouse lines expressing Cre recombinase specifically in posterior notochord and notochord. Genesis. 2007;45(12):729–736. doi: 10.1002/dvg.20346. [DOI] [PubMed] [Google Scholar]
- 21.Imuta Y, Kiyonari H, Jang CW, Behringer RR, Sasaki H. Generation of knock-in mice that express nuclear enhanced green fluorescent protein and tamoxifen-inducible Cre recombinase in the notochord from Foxa2 and T loci. Genesis. 2013;51(3):210–218. doi: 10.1002/dvg.22376. [DOI] [PMC free article] [PubMed] [Google Scholar]
- 22.Concepcion D, Papaioannou VE. Nature and extent of left/right axis defects in T(Wis) /T(Wis) mutant mouse embryos. Dev Dyn. 2014;243(8):1046–1053. doi: 10.1002/dvdy.24144. [DOI] [PMC free article] [PubMed] [Google Scholar]
- 23.Cogliatti SB. Diplomyelia: Caudal duplication of the neural tube in mice. Teratology. 1986;34(3):343–352. doi: 10.1002/tera.1420340314. [DOI] [PubMed] [Google Scholar]
- 24.Maier JA, Lo Y, Harfe BD. Foxa1 and Foxa2 are required for formation of the intervertebral discs. PLoS One. 2013;8(1):e55528. doi: 10.1371/journal.pone.0055528. [DOI] [PMC free article] [PubMed] [Google Scholar]
- 25.Avilion AA, et al. Multipotent cell lineages in early mouse development depend on SOX2 function. Genes Dev. 2003;17(1):126–140. doi: 10.1101/gad.224503. [DOI] [PMC free article] [PubMed] [Google Scholar]
- 26.Hockfield S, McKay RD. Identification of major cell classes in the developing mammalian nervous system. J Neurosci. 1985;5(12):3310–3328. doi: 10.1523/JNEUROSCI.05-12-03310.1985. [DOI] [PMC free article] [PubMed] [Google Scholar]
- 27.Nagao K, et al. Abnormal placental development and early embryonic lethality in EpCAM-null mice. PLoS One. 2009;4(12):e8543. doi: 10.1371/journal.pone.0008543. [DOI] [PMC free article] [PubMed] [Google Scholar]
- 28.Teillet MA, Lapointe F, Le Douarin NM. The relationships between notochord and floor plate in vertebrate development revisited. Proc Natl Acad Sci USA. 1998;95(20):11733–11738. doi: 10.1073/pnas.95.20.11733. [DOI] [PMC free article] [PubMed] [Google Scholar]
- 29.Hamilton DH, Litzinger MT, Fernando RI, Huang B, Palena C. Cancer vaccines targeting the epithelial-mesenchymal transition: Tissue distribution of brachyury and other drivers of the mesenchymal-like phenotype of carcinomas. Semin Oncol. 2012;39(3):358–366. doi: 10.1053/j.seminoncol.2012.02.005. [DOI] [PMC free article] [PubMed] [Google Scholar]
- 30.Wolf C, et al. The M-twist gene of Mus is expressed in subsets of mesodermal cells and is closely related to the Xenopus X-twi and the Drosophila twist genes. Dev Biol. 1991;143(2):363–373. doi: 10.1016/0012-1606(91)90086-i. [DOI] [PubMed] [Google Scholar]
- 31.Fernando RI, et al. The T-box transcription factor Brachyury promotes epithelial-mesenchymal transition in human tumor cells. J Clin Invest. 2010;120(2):533–544. doi: 10.1172/JCI38379. [DOI] [PMC free article] [PubMed] [Google Scholar]
- 32.Huang B, et al. The embryonic transcription factor Brachyury blocks cell cycle progression and mediates tumor resistance to conventional antitumor therapies. Cell Death Dis. 2013;4:e682. doi: 10.1038/cddis.2013.208. [DOI] [PMC free article] [PubMed] [Google Scholar]
- 33.Muller PA, Vousden KH. p53 mutations in cancer. Nat Cell Biol. 2013;15(1):2–8. doi: 10.1038/ncb2641. [DOI] [PubMed] [Google Scholar]
- 34.Kadoch C, Crabtree GR. Mammalian SWI/SNF chromatin remodeling complexes and cancer: Mechanistic insights gained from human genomics. Sci Adv. 2015;1(5):e1500447. doi: 10.1126/sciadv.1500447. [DOI] [PMC free article] [PubMed] [Google Scholar]
- 35.Kelley MJ, et al. Characterization of T gene sequence variants and germline duplications in familial and sporadic chordoma. Hum Genet. 2014;133(10):1289–1297. doi: 10.1007/s00439-014-1463-z. [DOI] [PMC free article] [PubMed] [Google Scholar]
- 36.Behringer R. 4th Ed Cold Spring Harbor Lab Press; Plainview, NY: 2014. Manipulating the Mouse Embryo: A Laboratory Manual. [Google Scholar]
- 37.Lewandoski M, Meyers EN, Martin GR. Analysis of Fgf8 gene function in vertebrate development. Cold Spring Harb Symp Quant Biol. 1997;62:159–168. [PubMed] [Google Scholar]
- 38.Soriano P. Generalized lacZ expression with the ROSA26 Cre reporter strain. Nat Genet. 1999;21(1):70–71. doi: 10.1038/5007. [DOI] [PubMed] [Google Scholar]
- 39.Srinivas S, et al. Cre reporter strains produced by targeted insertion of EYFP and ECFP into the ROSA26 locus. BMC Dev Biol. 2001;1:4. doi: 10.1186/1471-213X-1-4. [DOI] [PMC free article] [PubMed] [Google Scholar]
- 40.Zhu J, et al. Uncoupling Sonic hedgehog control of pattern and expansion of the developing limb bud. Dev Cell. 2008;14(4):624–632. doi: 10.1016/j.devcel.2008.01.008. [DOI] [PMC free article] [PubMed] [Google Scholar]


