

Abstract
The R2R3-MYB proteins comprise one of the largest families of transcription factors in plants. Although genome-wide analysis of this family has been carried out in some plant species, little is known about R2R3-MYB genes in canola (Brassica napus L.). In this study, we have identified 76 R2R3-MYB genes in the canola genome through mining of expressed sequence tags (ESTs). The cDNA sequences of 44 MYB genes were successfully cloned. The transcriptional activities of BnaMYB proteins encoded by these genes were assayed in yeast. The subcellular localizations of representative R2R3-MYB proteins were investigated through GFP fusion. Besides, the transcript abundance level analysis during abiotic conditions and ABA treatment identified a group of R2R3-MYB genes that responded to one or more treatments. Furthermore, we identified a previously functionally unknown MYB gene-BnaMYB78, which modulates reactive oxygen species (ROS)-dependent cell death in Nicotiana benthamiana, through regulating the transcription of a few ROS- and defence-related genes. Taken together, this study has provided a solid foundation for understanding the roles and regulatory mechanism of canola R2R3-MYB genes.
Keywords: abiotic stress, Brassica napus, MYB, ROS, cell death
1. Introduction
The MYB (myeloblastosis) transcription factors (TF) are widely distributed in all eukaryotic organisms and comprise one of the largest TF families in the plant kingdom.1 MYB proteins are characterized by a highly conserved MYB-DNA-binding domain located near the N-terminus. The MYB domain consists of 1–4 imperfect tandem repeats (designated R0, R1, R2, and R3) with each repeat containing ∼50 amino acids and encoding three α-helices.2 Typically, the MYB repeat contains three regularly spaced tryptophan (or phenylalanine) residues, which can form a hydrophobic core, and therefore stabilizes the structure of the DNA-binding domain. The MYB gene family is usually divided into four different subfamilies according to the number of MYB repeat in the MYB domain, namely R1R2R3-MYB (3R-MYB), R2R3-MYB (2R-MYB), and 4R-MYB containing three, two, and four MYB repeats, respectively; as well as the MYB-related subfamily usually, but not always has a single repeat.2 Compared with animal MYB proteins, which generally referred to as 3R-MYB proteins, the majority of MYB TFs in plants are either R2R3-MYB or R1-MYB types.2,3 For example, the Arabidopsis thaliana genome contains only five 3R-MYB genes, compared with up to 126 R2R3-MYB and 64 MYB-related genes.2,3 Meanwhile, the rice genome contains 109 R2R3-MYB genes, 70 MYB-related genes, five 3R-MYB genes, and only one 4R-MYB gene.2,4 The expansion of the R2R3-MYB gene family in plants fits well with the observation that many (if not all) R2R3-MYB TF play central roles in plant-specific processes.2 It is proposed that the plant R2R3-MYB genes probably evolved from an R1R2R3-MYB gene progenitor through loss of R1 repeat or from an R1-MYB gene through duplication of R1 repeat.5
The first cloned plant MYB gene, C1, was identified from maize (Zea mays) and encodes a c-myb-like transcription factor involved in anthocyanin biosynthesis.6 Since then, an increasing number of MYB genes have been identified and characterized in numerous plants, including several crop plants.3,7 It has been demonstrated that MYB TF play a key role in many aspects of plant growth, development, and response to abiotic and biotic stresses.1,2
Extensive studies of MYB gene family in model plant species have provided a better understanding of roles and underlining mechanisms of this gene family. However, little is known about this gene family in canola or oilseed rape (Brassica napus L.). So far, there are only two reports on MYB genes in canola, in which two MYB genes were cloned and studied in the context of phosphate starvation and proanthocyanidin biosynthesis.8,9 Canola is a very important oil crop worldwide, and its yield is frequently limited by environmental factors including drought, salinity, cold, and fungal pathogens. However, the identity and role of MYB genes in canola responses to abiotic and biotic stresses are largely unknown. It is therefore necessary to characterize the MYB gene family in canola to help to develop stress- or disease-tolerant cultivars. In our previous transcriptomic profiling studies in canola seedlings treated with a fungal pathogen Sclerotinia sclerotiorum and drought stress, we identified several MYB genes induced by S. sclerotiorum and/or drought stress.10 Hence, to explore the role of MYB genes in canola, we mined the available expressed sequence tags (ESTs) deposited in the public database to identify expressed R2R3-MYB genes in canola. We further cloned the cDNA sequences of 44 R2R3-MYB genes from canola. After analyzing the transcriptional activity of these MYB proteins in yeast, we also examined the responses of selected genes under a range of abiotic stress and hormone treatment conditions. Interestingly, we successfully identified one novel BnaMYB gene that could elicit cell death when expressed in Nicotiana benthamiana leaves. Our data presented here will lay a solid foundation for further characterization of this important MYB gene family in canola responses to abiotic and biotic stresses.
2. Materials and methods
2.1. Identification of ESTs for R2R3-MYB genes in canola
The seed sequences of MYB domain (Pf00249) from Pfam (http://pfam.sanger.ac.uk/family/MYB#tabview=tab0) and the cDNA sequences of R2R3-MYB genes of Arabidopsis were used to search the B. napus ESTs in the NCBI dbEST (http://www.ncbi.nlm.nih.gov/dbEST/index.html, release 01012013), with an e-value cut-off lower than 10−4. After manual curation, these ESTs were clustered and assembled by sequence alignment program of DNASTAR (DNASTAR Inc.). Subsequently, contigs and singletons were run in a reciprocal BLAST search against the Arabidopsis database to assign a putative orthologue based on the best hit (Supplementary Table S1).
2.2. Plant growth condition, RNA extraction, and RT–PCR
Canola plants were grown in Pindstrup soil mix (Denmark) in a growth chamber at 22°C with 16 h light/8 h dark. Eighteen-day-old leaves were harvested for RNA isolation using the Plant RNA kit (Omega, USA). First-strand cDNA synthesis and high-fidelity PCR amplification using PrimeSTAR HS DNA polymerase (TaKaRa, Japan) were performed as previously described.11 Primers used were listed in Supplementary Table S2. PCR products were purified and cloned into pJET1.2 vector (Fermentas, USA). At least two clones for each gene were sequenced. The cDNA sequences of genes cloned in this study were deposited in GenBank database under the accession numbers of KC966733–KC966744, KF738279–KF738288, KF974750–KF974754, KJ670116–KJ670120, KM975652–KM975666, KR076547–KR076552, and KT350982.
2.3. Phylogenetic tree reconstruction and bioinformatic analysis
The MYB genes of representative species were identified using a previously constructed domain alignment (from the Pfam database version 27.0) to query the proteome of representative species in Phytozome (http://www.phytozome.com/, v9.0). To investigate the evolutionary relationship among MYBs, the predicted amino acid sequences of MYBs of canola and other species were aligned using ClustalX1.83 and then a phylogenetic tree was reconstructed using the maximum parsimony (MP) algorithm implemented in MEGA6.06 (release 6140226). Motif analysis of BnaMYBs was determined by using Prosite program (http://prosite.expasy.org/prosite.html) and SMART tool (http://smart.embl-heidelberg.de). The respective domains of MYB proteins were aligned using ClutsalX1.83 and illustrated by Boxshade (http://www.ch.embnet.org/software/BOX_form.html). The putative orthologue of each BnaMYB was identified by the InParanoid server v. 8.0 (http://inparanoid.sbc.su.se/cgi-bin/blast_search.cgi).
2.4. Transactivation assay
The coding regions of canola MYB genes were cloned in-frame downstream of GAL4 binding domain of the pGBKT7 vector (Clontech, USA), using the primers listed in Supplementary Table S2. Then the recombinant plasmids were transformed individually into yeast (Saccharomyces cerevisiae) AH109 competent cells according to the Yeast Protocols Handbook (Clontech, USA). The transcriptional activity of BnaMYBs was tested as described previously.12
2.5. Quantitative RT–PCR assay
Eighteen-day-old canola grown in a greenhouse with photoperiod of 16 h light/8 h dark with a relative humidity of 60% were treated with different stress conditions including 200 mM NaCl, 50 µM abscisic acid (±ABA, Invitrogen, USA), 10 µM methyl viologen (MV, Sigma-Aldrich), 4°C (cold), 37°C (heat), or drought as described previously.11 Three independent biological replicates of each sample were prepared at different times.
Quantitative reverse transcription–PCR (qRT–PCR) was performed using 10-fold diluted cDNA and SYBR Green I kit (CWBIO, China) on the CFX96 real-time PCR machine (Bio-Rad, USA). Primers used for qRT–PCR were designed using PrimerSelect program (DNASTAR Inc., USA), which targeted mainly at 3′UTR with an amplicon size of 75–250 bp (Supplementary Table S2). The specificity and amplification efficiency of each pair of primers were examined through both BLASTn search in NCBI database and by running standard curves with melting curves. Three independent biological replicates and two technical replicates for each biological replicate were run, and the significance was determined through t-test of SPSS statistic software (P ≤ 0.05).
2.6. Subcellular localization and confocal microscopy
To examine the localization of selected BnaMYBs, the coding regions were amplified using Pfu polymerase (Bioer, China) with primers listed in the Supplementary Table S2. After purification, PCR products were restricted and then cloned upstream of a synthetic green fluorescent protein gene (sGFP) in the pYJGFP binary vector. These constructs and p19 protein of tomato bushy stunt virus were transformed into Agrobacterium tumefaciens GV3101 individually through a freeze-thaw method, and overnight cell cultures were resuspended in infiltration media before infiltration into 30-day-old leaves of N. benthamiana.11 Two days later, leaf discs were observed of GFP under FV1000MPE confocal microscopy (Olympus, Japan).
2.7. Transient expression and physiological assay
The coding regions of respective genes were amplified by high-fidelity Pfu polymerase and primers containing corresponding restriction sites as listed in Supplementary Table S2. After digestion, the PCR products were inserted downstream of the CaMV 35S promoter in the binary vector pYJHA, which was modified from the pYJGFP vector. Recombinant plasmids were transformed into A. tumefaciens GV3101 and overnight cell cultures were resuspended in infiltration media containing 10 mM MES-KOH (pH 5.6), 10 mM MgCl2 and 0.15 mM acetosyringon, which was adjusted to an OD600 of 0.5 before a mixture of equal volumes of each cell culture harbouring p19, and BnaMYB gene were infiltrated into the lower epidermal side of 30-day-old leaves of N. benthamiana plants. For each construct, 15 independent leaves of five independent plants (three leaves per plant) were used for each time point tested. After that, infiltrated plants were kept under normal growth condition with the phenotype observed and recorded daily beginning 2 days after infiltration and continuing until Day 7.
Electrolyte leakage was measured according to Ref. 13. Distribution of hydrogen peroxide (H2O2) was detected by 3,3′-diaminobenzidine (DAB) staining according to the previously described protocol.13 Total chlorophyll was extracted in absolute ethanol in the dark at 4°C. Relative chlorophyll levels were determined by fluorescence using a spectrometer (Thermo Scientific, USA). Anthocyanins were extracted in methanol supplemented with 1% HCl overnight at 4°C with absorbance at 530 and 657 nm measured using a spectrophotometer (Thermo Scientific, USA). By subtracting the A657 from the A530, the relative amount of anthocyanin per milligram of tissue was calculated. For malondialdehyde (MDA) content determination, ∼100 mg of leaf discs were homogenized in 4 ml of 0.1% trichloroacetic acid (TCA), with the concentration measured as described previously.14
2.8. Terminal deoxynucleotidyl transferase-mediated dUTP nick end labeling assays
Firstly, a β-glucuronidase (GUS) gene fragment (2.053 kb) was amplified from pCAMBIA1391Z through high-fidelity Pfu and subcloned into Nco I-Sal I sites of pYJHA plasmid using the same restriction sites, with the resultant transient vector called pYJHA-GUS. An agrobacterial GV3101-mediated infiltration of N. benthamiana leaves was performed as described previously. Leaves from control (GUS) and BnaMYB78 plants were fixed in 3.7% paraformaldehyde in 1× PBS buffer and treated with DNase-free RNase A (30 µg/ml; Promega) and Proteinase K (20 µg/ml; Sigma-Aldrich) for 5 min before the terminal deoxynucleotidyl transferase-mediated dUTP nick end labeling (TUNEL) assay according to the manufacturer's manual (Promega). Tissue was then counterstained with Vectashield and DAPI solution (Vector Labs, USA) for 5–10 min and examined with an FV1000MPE confocal microscopy (Olympus, Japan).
2.9. Promoter cloning and dual luciferase assay
Young leaves of N. benthamiana or canola seedlings were harvested for DNA isolation through the 2% CTAB method.14 Primers for amplification of promoter regions were designed through a BLAST search against the SOL Genomics Network database (http://solgenomics.net/tools/blast) based on orthologous published sequences of Nicotiana tabacum and/or Arabidopsis. Promoter regions of canola genes were retrieved from B. napus database (http://www.genoscope.cns.fr/brassicanapus/). High-fidelity PCR amplification was performed using PrimeSTAR HS DNA polymerase (TaKaRa, Japan). Primers were designed to amplify the 1 kb regions upstream of the translational start codon (ATG) and were listed in Supplementary Table S2. PCR products were purified, sequenced and fused upstream of firefly luciferase (fLUC) gene in the pGreenII0800-LUC vector, in which renilla luciferase (rLUC) under the control of the 35S promoter was the endogenous control. The effector plasmid is pYJHA-BnaMYB78 and the control plasmid is pYJGFP. Dual LUC assay was performed as described previously.15 Briefly, agrobacterium cultures transformed with the effector plasmid and reporter plasmid (9 : 1, v/v) were co-infiltrated into the lower epidermal side of 30-day-old N. benthamiana leaves. At specific time points, 1 cm leaf discs were harvested and ground in liquid nitrogen and extracted in 200 µl of lysis buffer, with supernatant used to assay fLUC and rLUC activity using a kit according to the manufacturer's instructions (Promega), with a 5 s delay and 15 s integrated measurements. The binding ability of BnaMYB78 to various promoter regions was indicated by the ratio of fLUC to rLUC. Triplicate measurements were performed for each pair. The promoter sequences cloned in this study were deposited in GenBank database under the accession numbers of KP747643, KP747648, KT257630 and KT907304–KT907305, KT907307–KT907308.
2.10. Statistical analysis
All experiments were repeated three times (three biological replicates). All data were statistically analysed by using t-test or Duncana analysis of the SPSS 16.0 software.
3. Results and discussion
3.1. Identification and cloning of R2R3-MYB genes from canola
To identify and characterize R2R3-MYB genes from canola, we utilized the large number of public ESTs and identified 527 unique ESTs representing putative R2R3-MYB genes in canola (Supplementary Table S1). We followed the united nomenclature for Brassica genus genes and used BnaMYB (for B. napus MYB, to differentiate it from Brassica nigra) to represent MYB genes from canola.16 To facilitate comparisons between species, we followed the established nomenclature of Arabidopsis MYBs when naming the canola MYB genes.1 As a result, we identified 76 R2R3-MYB genes from canola. We noticed that, among all the BnaMYB genes identified, BnaMYB44 had the largest number (50) of ESTs, followed by BnaMYB77 and -91 with a total of 37 and 34 ESTs, respectively; while 16 BnaMYB genes have only one EST each (Table 1 and Supplementary Table S1). To facilitate functional study of BnaMYB genes, we employed RT–PCR to obtain full-length cDNA sequences from canola, at least for the coding regions. As a result, we succeeded in cloning the cDNA sequences of 44 BnaMYB genes and deposited them into GenBank, among which we identified two to three different alleles for nine BnaMYB genes (Table 1). Conceptual translation of these cDNA sequences and domain analysis indicated that they harbour domains and motifs that are typical of R2R3-MYB proteins (Supplementary Figure S1). Further analysis showed that only the R2 and R3 repeats are highly conserved among the 54 BnaMYB protein sequences, whereas the C-terminal sequences are highly variable and no conserved motif could be detected (Supplementary Figure S1). The numbers of amino acids in BnaMYB proteins range from 236 (BnaMYB59) to 439 (BnaMYB88), with a pI of 4.82 (BnaMYB58) to 9.4 (BnaMYB123). Using the program InParanoid, we also identified putative orthologues of these BnaMYB genes in monocot model plant rice (Table 1).
Table 1.
R2R3-MYB transcription factor genes identified and cloned from canola (Brassica napus L.)
| Gene | GenBank Acc No.a | EST countb | Protein M.W. (kDa) | Arabidopsis homologue/AGI No. | Rice top hit locus/genec | Subgroupd | Transactivatione | Putative repression domain | Subcellular localization (experimental) | Availability of full-length cDNA clones |
|---|---|---|---|---|---|---|---|---|---|---|
| BnaMYB1 | KF974750 | 13 | 42.6 | AtMYB1/At3g09230 | LOC_Os01g63160/OsMYB25 | S23 | Activator | Yes | ||
| BnaMYB3 | KC966736 | 15 | 31.6 | AtMYB3/At1g22640 | LOC_Os09g36730 | S4 | Repressor | LNLEL | Yes | |
| BnaMYB4 | KR076549 | 12 | 31.5 | AtMYB4/At4g38620 | LOC_Os09g36730 | S4 | Repressor* | LNLEL | Yes | |
| KR076550 | 31.6 | LNLEL | Yes | |||||||
| KR076551 | 33.1 | LNLEL | Yes | |||||||
| BnaMYB7 | KM975652 | 11 | 33.0 | AtMYB7/At2g16720 | LOC_Os08g43550/OsMYB7 | S4 | Repressor | LNLEL | Yes | |
| BnaMYB12 | KC966744 | 6 | 42.2 | AtMYB12/At2g47460 | LOC_Os01g19970/OsMYB12 | S7 | Activator | Yes | ||
| BnaMYB13 | KF738279 | 2 | 28.5 | AtMYB13/At1g06180 | LOC_Os02g41510 | S2 | Activator | Yes | ||
| BnaMYB15 | KF738280 | 6 | 32.0 | AtMYB15/At3g23250 | LOC_Os02g41510 | S2 | Activator | Yes | ||
| BnaMYB16 | KC966734 | 6 | 34.6 | AtMYB16/At5g15310 | LOC_Os08g33660/OsMYB16 | S9 | Activator | Nucleus | Yes | |
| BnaMYB28 | KJ670116 | 3 | 37.9 | AtMYB28/At5g61420 | S12 | Not assayed | Yes | |||
| BnaMYB30 | KC966735 | 16 | 36.6 | AtMYB30/At3g28910 | LOC_Os07g43580/OsMYB30 | S1 | Activator | Yes | ||
| BnaMYB31 | KM975653 | 6 | 37.8 | AtMYB31/At1g74650 | LOC_Os09g24800 | S1 | Activator | Yes | ||
| BnaMYB32 | KF738281 | 21 | 30.9 | AtMYB32/At4g34990 | LOC_Os08g43550/OsMYB7 | S4 | Repressor* | LDLNLEL | Yes | |
| KF738282 | 31.0 | LDLNLEL | Yes | |||||||
| BnaMYB34 | KJ670117 | 11 | 34.9 | AtMYB34/At5g60890 | LOC_Os08g33660/OsMYB16 | S12 | Activator | Nucleus | Yes | |
| BnaMYB38 | KJ670118 | 3 | 32.8 | AtMYB38/At2g36890 | LOC_Os03g56090 | S14 | Repressor | Nucleus | Yes | |
| BnaMYB41 | KR076548 | 1 | 32.7 | AtMYB41/At4g28110 | LOC_Os07g37210/OsMYB102 | S25 | Not assayed | Yes | ||
| BnaMYB43 | KF974751 | 1 | 35.8 | AtMYB43/At5g16600 | LOC_Os09g23620 | Activator | Yes | |||
| KF974752 | 35.8 | Yes | ||||||||
| BnaMYB44 | KC966737 | 50 | 32.6 | AtMYB44/At5g67300 | LOC_Os09g01960 | S22 | Repressor | LSLSL | Yes | |
| BnaMYB46 | KF738283 | 3 | 31.7 | AtMYB46/At5g12870 | LOC_Os12g33070/OsMYB83 | S13 | Activator | Yes | ||
| BnaMYB47 | KF974753 | 2 | 29.6 | AtMYB47/At1g18710 | LOC_Os04g38740 | S25 | Activator | Yes | ||
| BnaMYB48 | KC966738 | 6 | 29.2 | AtMYB48/At3g46130 | LOC_Os11g47460 | Not assayed | Yes | |||
| BnaMYB51 | KJ670119 | 5 | 37.3 | AtMYB51/At1g18570 | LOC_Os02g36890 | S12 | Activator | Yes | ||
| BnaMYB56 | KC966739 | 14 | 36.4 | AtMYB56/At5g17800 | LOC_Os01g16810 | S23 | Repressor | Yes | ||
| BnaMYB58 | KM975654 | 3 | 32.2 | AtMYB58/At1g16490 | LOC_Os02g46780 | S3 | Not assayed | Yes | ||
| BnaMYB59 | KC966740 | 11 | 27.4 | AtMYB59/At5g59780 | LOC_Os11g47460 | Not assayed | Yes | |||
| BnaMYB61 | KC966741 | 15 | 37.5 | AtMYB61/At1g09540 | LOC_Os01g18240 | S13 | Activator | Yes | ||
| BnaMYB62 | KM975655 | 2 | 33.2 | AtMYB62/At1g68320 | LOC_Os01g03720/OsMYB116 | S20 | Not assayed | Nucleus | Yes | |
| BnaMYB73 | KC966742 | 27 | 35.3 | AtMYB73/At4g37260 | LOC_Os09g01960 | Repressor | LSLSL | Nucleus | Yes | |
| BnaMYB77 | KC966743 | 37 | 29.5 | AtMYB77/At3g50060 | LOC_Os09g01960 | S22 | Repressor* | LSLSL | Nucleus | Yes |
| BnaMYB78 | KM975656 | 1 | 36.6 | AtMYB78/At5g49620 | LOC_Os03g20090/OsMYB112 | S20 | Activator* | Nucleus | Yes | |
| KM975657 | 36.7 | Activator | Yes | |||||||
| BnaMYB81 | KR076547 | 2 | 48.1 | AtMYB81/At2g26960 | LOC_Os01g59660/OsGAMYB | S18 | Activator | Yes | ||
| KR076552 | 44.8 | Yes | ||||||||
| BnaMYB88 | KM975658 | 4 | 49.8 | AtMYB88/At2g02820 | LOC_Os07g43420/OsMYB88 | S25 | Activator | Yes | ||
| BnaMYB90 | KF738284 | 4 | 27.7 | AtMYB90/At1g66390 | LOC_Os03g29614 | S6 | Activator | Yes | ||
| BnaMYB91 | KM975659 | 34 | 42.4 | AtMYB91/At2g37630 | LOC_Os12g38400.2 | Repressor* | LELQL | Yes | ||
| KT350982 | 41.4 | Yes | ||||||||
| BnaMYB92 | KM975660 | 1 | 37.8 | AtMYB92/At5g10280 | LOC_Os08g37970 | S25 | Not assayed | Yes | ||
| BnaMYB95 | KF738285 | 17 | 31.3 | AtMYB95/At1g74430 | LOC_Os04g38740 | S25 | Activator | Yes | ||
| BnaMYB96 | KM975661 | 10 | 38.4 | AtMYB96/At5g62470 | LOC_Os08g33940 | S1 | Activator | Yes | ||
| KM975662 | 37.4 | Yes | ||||||||
| BnaMYB106 | KC966733 | 9 | 37.8 | AtMYB106/At3g01140 | LOC_Os04g38740 | S9 | Activator | Yes | ||
| BnaMYB108 | KF738286 | 1 | 35.4 | AtMYB108/At3g06490 | LOC_Os05g04210 | S20 | Activator | Nucleus | Yes | |
| KF738287 | 35.3 | Yes | ||||||||
| BnaMYB109 | KF974754 | 3 | 40.4 | AtMYB109/At3g55730 | LOC_Os01g63160/OsMYB25 | S23 | Activator | Yes | ||
| BnaMYB111 | KF738288 | 6 | 38.8 | AtMYB111/At5g49330 | LOC_Os01g19970/OsMYB12 | S7 | Activator | Yes | ||
| BnaMYB116 | KM975663 | 1 | 33.2 | AtMYB116/At1g25340 | LOC_Os01g03720/OsMYB116 | S20 | Activator | Yes | ||
| BnaMYB122 | KJ670120 | 1 | 37.6 | AtMYB122/At1g74080 | LOC_Os08g33660/OsMYB16 | S12 | Activator | Yes | ||
| BnaMYB123 | KM975664 | 9 | 32.4 | AtMYB123/At5g35550 | LOC_Os03g29614 | S5 | Not assayed | Yes | ||
| KM975665 | 29.6 | Yes | ||||||||
| BnaMYB124 | KM975666 | 2 | 49.5 | AtMYB124/At1g14350 | LOC_Os07g43420/OsMYB88 | S25 | Activator | Yes |
acDNA sequences cloned and deposited in the GenBank.
bNumbers of ESTs identified from the dbEST database (http://www.ncbi.nlm.nih.gov/dbEST/index.html).
cDetected by InParanoid, http://inparanoid.sbc.su.se/cgi-bin/index.cgi.
dPhylogenetic subgroups are assigned according to Dubos et al.2
eTranscriptional activity assayed in yeast system, while those confirmed in Arabidopsis protoplast assay system are labelled with asterisks.
3.2. Domain analysis of BnaMYB proteins and phylogenetic tree reconstruction
R2R3-MYBs are characterized with two repeats, known as R2 and R3. Consistently, the MYB domain of canola R2R3-MYBs contains 107 amino acid residues, of which 56 form R2, while the other 51 constitute R3 (Supplementary Fig. S2). To examine the sequence features of MYB domains and the degree of conservation of each residue, we performed multiple sequence alignment with sequence logos created for R2 and R3 of R2R3-MYBs from canola (Supplementary Fig. S2). The results showed that the R2 repeat of canola R2R3-MYBs contains three highly conserved tryptophan residues (W) at positions 6, 27 and 49, which may form a tryptophan cluster in the 3-dimensional helix-turn-helix (HTH) structure and play significant roles in MYB-DNA interaction.1 In contrast, only two regularly spaced and highly conserved tryptophan residues exist at positions 25 and 44 of R3 (Supplementary Fig. S2). As known from orthologues in other plant species, we also identified that the first tryptophan residue in the R3 repeat (position 6) is not conserved at all, instead it could be replaced by phenylalanine (F) or less frequently by isoleucine (I) or leucine (L), which was also reported in other plants.17–19 Interestingly, the last of the conserved tryptophan residues at the position 44 of the R3 repeat is not completely conserved in the canola R2R3-MYBs (Supplementary Fig. S1 and Fig. S2). Instead, a phenylalanine (F) residue was found in BnaMYB88 and BnaMYB124, and this phenomenon was ever reported in other plants as well.19,20 However, the functional significance of phenylalanine at position 44 of R3 repeat remains to be elucidated. Overall, the highly conserved amino acid residues are mainly located in the third helix (Helix 3) and the turn of the helix-turn-helix (HTH) motif (Supplementary Fig. S2). Besides, the residues forming the first helix in each repeat are apparently less conserved (Supplementary Fig. S2). In addition, the 3′ region of R2 in canola R2R3-MYBs contains a highly conserved LRPD motif, which was also observed in R2R3-MYBs from Populus trichocarpa21 and sugar beet.19
To infer the evolutionary relationship of canola R2R3-MYBs to those of other representative crops and model plants and trace the origin and expansion of R2R3-MYB genes, we searched putative MYB genes in representative, lower species using Pfam seed sequences in Phytozome (http://www.phytozome.net). The species queried included the lycophyte Selaginella moellendorffii (Sm), Chlamydomonas reinhardtii (Cr) and Ostreococcus lucimarinus (Ot). Among these, the marine green alga Ostreococcus tauri (Ot) is the world's smallest free-living eukaryote known to date.22 As a result, three, three and six R2R3-type MYB genes were identified from O. tauri, C. reinhardtii and S. moellendorffii, respectively (Supplementary Table S3). This suggests that R2R3-type MYB genes have an ancient origin. In addition, the presence of a smaller set of R2R3-type MYB members in primitive land plants including S. moellendorffii compared with eudicots (Arabidopsis) and monocots (rice) indicated significant expansion of the R2R3-MYB genes during the evolution of the angiosperms.
Further, a maximum parsimony (MP) phylogenetic tree was reconstructed using MEGA6.0 based on the full-length protein sequences of R2R3-MYBs from canola, Arabidopsis, rice, wheat, maize, P. trichocarpa, Vitis vinifera as well as a few from published references (Fig. 1). In two previous studies of Arabidopsis R2R3-MYBs, 90 of the 126 R2R3-MYBs were grouped into 25 subfamilies (S1-S25). However, the remaining 36 genes were not clustered into any subgroups.1,2 To better compare our results with these previous studies, we labelled the subgroups as previously defined (Fig. 1). It can be seen that most canola R2R3-MYB can be classified into 19 subgroups and a few BnaMYBs do not belong to any subgroup. Moreover, most of the subgroups were supported by high bootstrapping values.
Figure 1.

Phylogenetic analysis of canola R2R3-MYB proteins. Reconstruction of the phylogenetic tree through maximum parsimony method with BnaMYBs denoted by diamond. The numbers on the nodes are percentages from a bootstrap analysis of 1,000 replicates. At, Arabidopsis thaliana; Bna, Brassica napus; Gb, Gossypium barbadense; Hv, Hordeum vulgare; Md, Malus × domestica; Os, Oryza sativa; Ot, Ostreococcus tauri; Zm, Zea mays; Pt, Populus trichocarpa; Ta, Triticum aestivum; Vv, vitis vinifera.
3.3. Transcriptional activity of BnaMYB TF
To explore the function of MYB genes in canola, it is necessary to identify whether they are transcriptional activators or repressors. Therefore, we analysed the ability of 36 selected BnaMYB TFs to activate three reporter genes LacZ, His1 and ADE2 in budding yeast. Firstly, the coding regions of BnaMYB genes were fused to the GAL4 DNA-binding domain (BD) to examine their ability to activate transcription from the GAL4 upstream activation sequence (UAS) and thereby promote yeast growth. The yeast cells containing individual BnaMYB plasmids or control plasmid pGBKT7 all grew well on the non-selective SD-LW medium, while on selective SD-LWHA medium, only yeast cells transformed with pGBKT7-BnaMYB1, -12, -13, -15, -16, -30, -31, -34, -43, -46, -47, -51, -61, -78, -81, -88, -90, -95, -96, -106, -108, -109, -111, -116, -122 and -124 plasmids could grow (Fig. 2), suggesting that these BnaMYB TFs are likely transcriptional activators. This conclusion was further supported by the β-galactosidase activity assay, in which blue staining indicates the activation of another reporter gene LacZ. In contrast, yeast cells transformed with BnaMYB3, -4, -7, -32, -38, -44, -56, -73, -77 and -91 plasmids did not show any growth on the selective medium, suggesting that they are transcriptional repressors (Fig. 2). In addition, the pink to red colour of colonies transformed with putative transcriptional repressor plasmids also indicated that ADE2 reporter gene was not expressed.
Figure 2.

Analysis of transactivational activity of BnaMYB in budding yeast. The yeast cells of strain AH109 harbouring the indicated plasmid were grown on either the non-selective (SD-LW) or selective (SD-LWHA) media, followed by β-galactosidase assay (X-Gal staining). Decreasing cell densities in the dilution series are illustrated by narrowing triangles. BD at the last row represents empty pGBKT7 vector.
Previous reports have identified two groups of repression motif in plant TF.23,24 The first group is the ethylene-responsive element binding factor-associated amphiphilic repression (EAR) motif, which is a small yet distinct regulatory motif that is conserved in many plant TF associated with diverse biological functions. A genome-wide analysis enabled refining EAR motifs as comprising either LxLxL or DLNxxP (where x represents any amino acid).25 We found that protein sequences of BnaMYB3, -4, -7, -32, -44, -73, -77 and -91 have such an LxLxL motif (Supplementary Fig. S1). The second group of repression motif was firstly identified in B3 family TF in Arabidopsis and has conserved R/KLFGV motif.24 However, a thorough examination of all our BnaMYBs indicates that this second group of repression motif does not exist in any of the BnaMYBs reported here. In addition, neither BnaMYB38 nor BnaMYB56 has any of the two groups of reported repressor motifs, indicative of novel unidentified repression motif. This phenomenon was also observed with a few WRKY and NAC TF from canola and Arabidopsis, which showed transcriptional repression activity both in yeast and in protoplast assays (manuscript in preparation).
We further examined the repression function of representative BnaMYB TFs using the Arabidopsis protoplast assay system. Firefly luciferase (fLUC) gene driven by CaMV 35S promoter with five copies of GAL4-binding element in front of TATA box was used as reporter, and Renilla luciferase (rLUC) gene driven by 35S promoter was used as the internal control. Viral protein (VP) 16 transcriptional activation domain was used as a positive control (Supplementary Fig. S3A). The results showed that VP16 had higher relative luciferase activity compared with control GAL4-BD as expected (Supplementary Fig. S3B). However, expression of BnaMYB4, -32, -77 and -91 caused significant lower luciferase activity compared with the vector control GAL4-BD (Supplementary Fig. S3B).These results indicate that these BnaMYB TFs can function as repressors in Arabidopsis protoplast assay system, consistent with the results obtained in the yeast assay system. In contrast, we also tested the transcriptional activity of BnaMYB78 in Arabidopsis protoplasts, and the result showed that it had higher relative luciferase activity compared with control GAL4-BD (Supplementary Fig. S3C). However, compared with the positive control VP16, BnaMYB78 showed lower relative luciferase activity, indicating that BnaMYB78 is a transcriptional activator, but not as strong as the well-known transcriptional activator VP16.
3.4. Expression analysis of BnaMYB genes in response to abiotic stress and hormone treatments
To elucidate the functions of BnaMYB genes in the context of abiotic and hormone stimuli, the expression patterns of 15 selected BnaMYB genes, representing 10 subgroups in the phylogenetic tree, were studied in response to a variety of stress conditions including ABA, Paraquat (methyl viologen, MV), salinity, cold, heat and drought, using quantitative reverse transcription-PCR (qRT–PCR). Data of three independent biological replicates were analysed to identify BnaMYB genes responsive to one or a combination of stress conditions (Fig. 3). The results showed that ABA induced expression of BnaMYB44 and -73, while down-regulated that of BnaMYB3, -12 and -16 at either 6 h or 24 h or both time points. MV treatment up-regulated the transcript abundance of BnaMYB3, while down-regulating BnaMYB12, -13, -32 and -95. Salt stress induced transcript accumulation of BnaMYB16, -44 and -90, whereas it repressed BnaMYB61 transcription at either the early or late time point. Cold stress induced the transcript accumulation of BnaMYB3, -44 and -108, while down-regulating that of BnaMYB12 and -16. Heat stress induced the expression of BnaMYB3, -12 and -56 at the 24 h time point; however, it repressed BnaMYB13 and -95 expression 6 h after treatment. Lastly, drought stress induced BnaMYB95 expression at both time points but repressed BnaMYB108 expression at the 6 h time point. It is also noted that BnaMYB3 was induced by both cold and heat stresses, suggesting its potential role in signal transduction under extreme temperatures. The co-induction of plant genes by opposite stress conditions, for instance, cold and heat, has been reported in both Arabidopsis and crop plants.26–28 Taken together, these data indicate that on one hand, some BnaMYB genes participate in transduction of multiple stresses; and on the other hand, a specific stress activates transcription of more than one BnaMYB, providing evidence that BnaMYBs play a role in the cross-talk of multiple stresses, including both abiotic stresses and ABA signalling.
Figure 3.

Expression analyses of BnaMYB genes in response to various treatments, including 50 µM ABA, 10 µM Paraquat (MV), 200 mM NaCl, cold (4°C), heat (37°C) and drought. Data are the mean of three biological replicates ± S.E. Asterisks denote significant differences (compared with 1) by Student's t-test analysis (P ≤ 0.05).
3.5. Subcellular localization of canola R2R3-MYB proteins
To investigate the subcellular localization of canola MYB proteins, selected genes were fused in-frame with green fluorescent protein (GFP) reporter gene and expressed in leaves of N. benthamiana, with the GFP signal observed 2 days later. We found that in leaf cells expressing the fusion proteins of BnaMYB16, -34, -38, -62, -73, -77, -78 and -108, the GFP signals were present only in the nucleus (Fig. 4), which is in agreement with their role of TF. As a control, we also examined the subcellular localization of the GFP protein in leaf cells, and green signals were present obviously both in cytosol and in nuclei (Fig. 4). Besides, we used two different programs, NucPrep and PredictNLS, to predict the putative nuclear localization sequence (NLS) of all the canola R2R3-MYB TFs and found that except BnaMYB62, all other BnaMYBs have NLS in their amino acid sequences (Supplementary Fig. S1).
Figure 4.
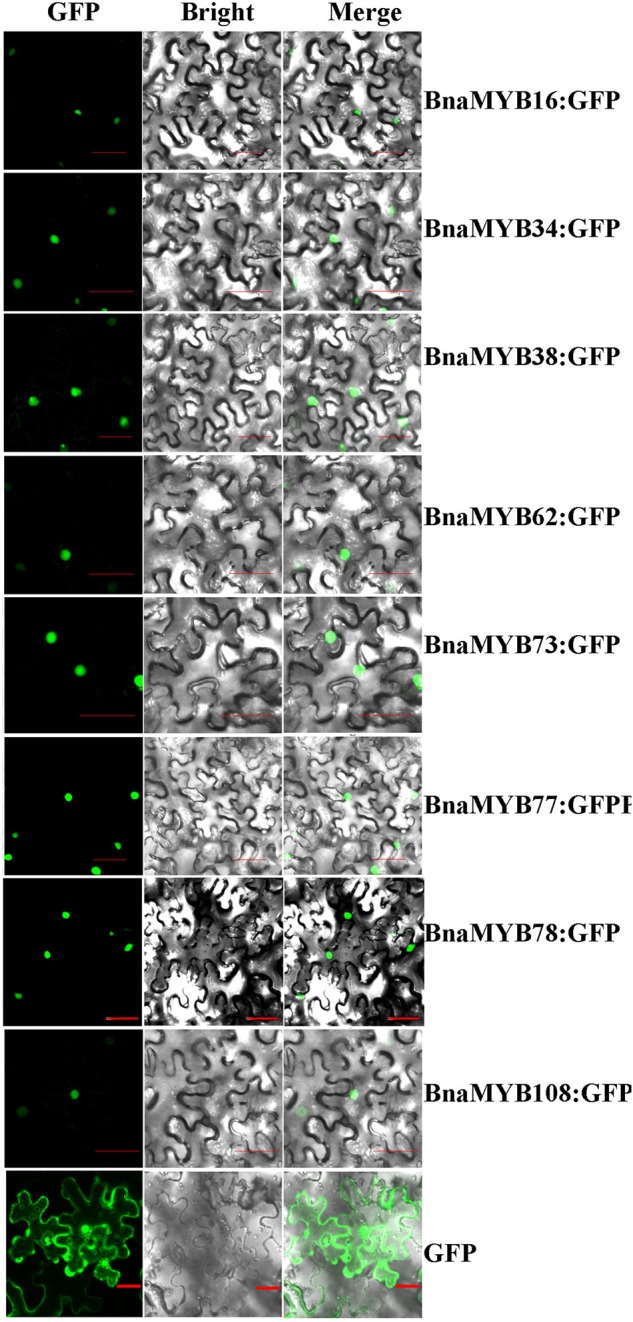
Subcellular localization of BnaMYB proteins in Nicotiana benthamiana cells using green fluorescence protein (GFP). In each panel, the extreme left is GFP field, the middle bright field and the right an overlay of the two images as indicated on the top of the picture. Bar = 50 µm. This figure is available in black and white in print and in colour at DNA Research online.
3.6. Expression of BnaMYB78 gene promoted ROS accumulation and hypersensitive response-like cell death
In the aforementioned GFP subcellular assay using N. benthamiana, we observed that expression of BnaMYB78 in leaves led to hypersensitive response (HR) symptoms within 2 days after infiltration. HR is a common feature of plant immune responses and a type of programmed cell death (PCD). Activation of cell death is one of the aspects of plant defence responses where ROS play a crucial role.29 Sequence analysis indicates that BnaMYB78 and AtMYB78(At5g49620) show an identity of 74.1and 64.3% at the nucleotide and amino acid level, respectively. A literature search demonstrated that function of MYB78 gene in ROS and cell death has not been investigated yet, even in the model plant Arabidopsis. To further explore the role of BnaMYB78 gene in inducing ROS accumulation and cell death, we constructed the coding region of it into another binary vector pYJHA under the driving of the constitutive CaMV 35S promoter. Then we performed agroinfiltration of target gene plasmid and GFP control plasmid individually into N. benthamiana leaves and evaluated the phenotype daily for a total of 7 days. Interestingly, expression of BnaMYB78 indeed caused pathogen-independent cell death compared with GFP vector control, beginning 2 days post-infiltration (dpi) and proceeded as expected (Fig. 5A). To explore the role of ROS during cell death, we performed DAB staining and the results showed that there was staining in sites expressing BnaMYB78 beginning at 2 dpi, and this staining was enhanced as time went by. However, insignificant or very weak staining was detected in sites expressing the GFP gene alone (Fig. 5A). To further confirm the accumulation of hydrogen peroxide (H2O2), we measured the content of it using an improved method to more accurately reflect H2O2 concentration. Indeed, significantly higher content of H2O2 was accumulated in leaf discs expressing BnaMYB78 than that of GFP at the three time points examined (Fig. 5B). Moreover, we examined the electrolyte leakage of leaf discs taken from leaves expressing BnaMYB78 and GFP. The results showed that a significant increase (2.5-folds) in ion leakage was visible 4 days after agroinfiltration of BnaMYB78 in contrast to that of leaves expressing the GFP gene alone (Fig. 6C).
Figure 5.
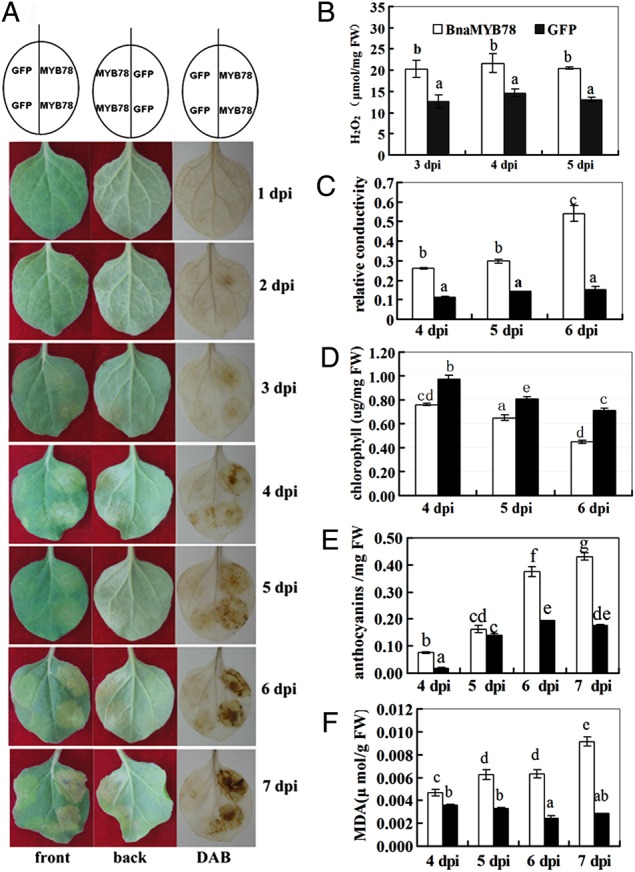
Expression of BnaMYB78 induced ROS accumulation and pathogen-independent cell death in Nicotiana benthamiana leaves. (A) Symptoms of N. benthamiana leaf areas expressing BnaMYB78 or GFP from 1 to 7 days post-infiltration (dpi). The left, middle and right panels represent the front, back sides and DAB staining, respectively. (B) Quantification of hydrogen peroxide contents in leaf discs expressing BnaMYB78 and GFP at 3, 4 and 5 dpi. (C) Comparison of relative conductivity in leaf discs expressing BnaMYB78 and GFP at 4, 5 and 6 dpi. (D) Quantification of chlorophyll contents in leaf discs expressing BnaMYB78 and GFP at 4, 5 and 6 dpi. (E) Quantification of anthocyanin accumulation in leaf tissues expressing BnaMYB78 or GFP gene. (F) Quantification of MDA contents in leaf discs expressing BnaMYB78 and GFP at 4, 5, 6 and 7 dpi. Values represent the means of three independent assays for each time-point ± S.E. Identical and different letters represent non-significant and significant differences (P ≤ 0.05). This figure is available in black and white in print and in colour at DNA Research online.
Figure 6.

Confocal images of the TUNEL assay. (A) Images of leave tissues of BnaMYB78-expressing plants at 3 dpi. (B) Image of leaves of GUS control at 3 dpi. FITC is the fluorescein channel, and DAPI staining indicates nuclei with an overlay at the rightmost. Scale bars = 50 µm. This figure is available in black and white in print and in colour at DNA Research online.
We then examined the concentration of chlorophyll and anthocyanins in leaf discs expressing BnaMYB78 or GFP. The results showed that in leaf discs expressing BnaMYB78, the concentration of chlorophyll decreased significantly compared with GFP control at the three time points (Fig. 6D). In addition, this decrease in total chlorophyll in leaf tissues expressing BnaMYB78 proceeded as the symptoms developed more seriously, although a slight decrease in the control leaf tissues was also observed, possibly as result of agrobacterium infiltration. Anthocyanins are important antioxidants that can help protect plants from damage by ROS.30 Anthocyanins are present in a wide range of plant species and are responsible for the purple colouration of plant parts. We also quantified the anthocyanin concentration in different leaf tissues and the results showed that expressing BnaMYB78 significantly increased anthocyanin accumulation (Fig. 6E).
As intracellular ROS accumulation usually causes lipid peroxidation, which damages cell membranes and therefore the cells, we monitored the content of MDA formed by the decomposition of polyunsaturated fatty acids as a result of attack from ROS. The data showed that in leaf discs expression BnaMYB78, the MDA concentration was significantly higher than that in the GFP control at 4, 5, 6 and 7 dpi (Fig. 6F). This further indicates that the aforementioned cell death is associated with ROS-induced cell membrane breakage.
Since chromatin condensation and DNA fragmentation occur in naturally senescent tissues or during cell death, we further examined the change in nuclear DNA in leaf discs expressing BnaMYB78 or GFP using the TUNEL assay. For this assay, a bacterial source GUS gene was used as the control, because the excitation wavelength (488 nm) of GFP and fluorescein (FITC) overlaps and so GFP interferes with TUNEL assay (data not shown). We also confirmed that expression of GUS, like GFP, did not cause any symptom of HR-like cell death (data not shown). Not surprisingly, leaf discs expressing BnaMYB78 exhibited strong fluorescent signals of fluorescein in the epidermal nuclei based on confocal microscopy, suggesting single- or double-stranded DNA breaks in the nuclei (Fig. 6A). As expected, the signal was not detectable in control leaf cells expressing GUS gene (Fig. 6B). Overall, the above assays support that BnaMYB78 expression led to evident ROS accumulation and cell death in leaf tissues.
Previous studies have shown that in Arabidopsis, MYB30 is a positive regulator of pathogen-induced PCD and has an important role in disease resistance.31,32 Silencing of AtMYB30 strongly inhibits HR-like cell death in response to avirulent pathogens, which corresponds with decreased defence gene expression and decreased resistance to virulent pathogens. Further, targets of MYB30 are genes from the acyl-CoA elongase complex and the action of MYB30 seems to modulate very-long-chain fatty acid content.33 As AtMYB30 belongs to Subgroup 1 while BnaMYB78 Subgroup 20, this means MYB78 is a novel TF modulating hypersensitive-like cell death.
3.7. BnaMYB78 modulates ROS- and defence-related gene transcription
Previous reports have demonstrated that ROS play dual roles in plants. On one hand, being toxic molecules, they are capable of injuring cells. On the other hand, they control many different processes such as growth, development and stress adaptation in plants.34 Therefore, it is clear that the steady-state level of ROS in cells needs to be tightly regulated. In the model plant Arabidopsis, a network of at least 152 genes, encoding ROS-scavenging and ROS-producing proteins, is involved in managing the level of ROS.34 ROS can be generated by various enzymatic activities, of which the best studied are NADPH oxidases (NOX). In plants, NOX homologues are also called respiratory burst oxidase homologues (Rbohs), which are associated with plasma membrane and constitute a small gene family and play versatile roles in plant growth, development and stress responses.35 ROS could also be removed by an array of ROS-scavenging enzymes including superoxide dismutase (SOD), ascorbate peroxidase (APX), catalase (CAT), glutathione peroxidase (GPX) and glutathione S-transferase (GST). However, how these enzymes implicated in ROS homeostasis are transcriptionally regulated in plant cells is largely unknown.
To determine how BnaMYB78 regulates ROS level in plant cells, we used qRT–PCR to examine the expression of an array of downstream marker genes, which are reported to regulate ROS production and scavenging in Arabidopsis and tobacco.34 A previous study has demonstrated that NbRbohA and NbRbohB, homologues of AtRbohD and AtRbohF, mediate H2O2 accumulation.36 qRT–PCR assays of three biological replicates showed that the transcript level of NbRbohB was ∼6-fold higher in leaf discs expressing BnaMYB78 than that in the GFP control, whereas NbRbohA did not show significant change (Fig. 7A).
Figure 7.

qRT–PCR analysis of changes at the transcript level of ROS- and defence-related marker genes. Real-time quantitative RT–PCR analyses were performed to determine transcript levels of marker genes in control and BnaMYB78 leaves at 3 and 5 dpi. Each value represents the mean ± S.E. of three biological replicates. The PP2A, L23 and F-box mRNA levels were used as the endogenous control. Asterisks denote significant differences (compared with 1) by Student's t-test analysis (*P ≤ 0.05).
Next, the transcript levels of plant-specific genes encoding vacuolar processing enzymes (VPE) functioning as executors of cell death37 were also investigated. Besides, two metacaspase genes MC4 (MCP2d) and MC8 (MCP2e), which encode cysteine proteases structurally related to animal caspases, were also included in our analysis. In Arabidopsis, MC4 is the predominant and constitutively expressed member of type II metacaspases and plays a positive regulatory role in biotic and abiotic stress-induced PCD,38,39 while MC8 modulates PCD induced by ultraviolet light and H2O2.40 Our data demonstrated that although transcript levels of MC4, MC8 and VPE3 genes were increased at 3 dpi, the changes are not significant (Fig. 7A).
Thirdly, we examined the transcript changes of a variety of genes encoding antioxidant metabolic enzymes, such as APX, CAT, GPX, GST and SOD as well as alternative oxidase (AOX) lowering mitochondrial ROS production in plant cells.41 The results demonstrated that transcript levels of NbtAPX, NbCAT3 and NbGST were most prominently increased with an average of 3- to over 10-folds higher in leaf discs expressing BnaMYB78 compared with the GFP control, at one or two time points (Fig. 7A and B). The transcription of NbAPX1, NbCAT1, NbGPX2 and NbSOD was also up-regulated, though the values were not very significant.
Fourthly, expression of a subset of marker genes of leaf senescence and ROS-induced cell death was also monitored. These include homologues of Arabidopsis senescence-associated gene (SAG) 12, SAG101 and ZAT12.42 We found that expression of these three genes showed only slight increase as a result of BnaMYB78 expression at one or two time points tested (Fig. 7B).
Since accumulation of ROS is involved in plant defence response and HR-like cell death is a common feature of defence response,43 we further examined the expression of a set of genes implicated in plant defence response and marker genes of HR-like cell death. Three marker genes that are rapidly and transiently up-regulated upon pathogen-associated molecular pattern (PAMP) treatment in N. benthamiana, namely NbACRE31, NbACRE132 and NbCYP71D20,44 were examined. qRT–PCR data showed that transcript abundance of NbACRE31 and NbCYP71D20 was significantly induced by BnaMYB78 expression at 3 dpi, with an average of 10.4- and 3.2-folds, respectively (Fig. 7B). Lastly, four marker genes, including cysteine protease (CP)23, hairpin inducing (HIN)1, pathogenesis-related (PR)2 and PR5, which are all highly induced during HR-like cell death,45 were analysed. The results showed that NbCP23, NbHIN1, NbPR2 and NbPR5 genes were all transcriptionally induced in BnaMYB78-expressing leaf discs at one or two time points (Fig. 7B).
The next question is whether transcriptional activator BnaMYB78 could directly positively regulate the transcription of the above marker genes that showed significant changes. For this end, we used the dual LUC assay system. We firstly used PCR to clone the ca. 1 kb upstream regions (relative to the translational start codon ATG, containing promoter and 5′UTR) of a few up-regulated genes using high-fidelity polymerase and fused before the fLUC genes. Then, the different combinations of reporter vectors and an effector vector pYJHA-BnaMYB78 were individually co-infiltrated into the leaf epidermis of N. benthamiana, with pCsGFPBT used as the control. The rLUC driven by the constitutive CaMV 35S promoter was included to monitor transformation efficiency and normalize these data.15 To better monitor the transcriptional regulation, the two time points (3 and 5 dpi) for the above qRT–PCR assay were included in this assay. The results demonstrated that expression of the BnaMYB78 could slightly increase PNbRbohB-driving fLUC gene expression 4.5-folds at 5 dpi, compared with the GFP control (Fig. 8A). Similarly, the ability of upstream region of NbGST to activate fLUC expression was increased by BnaMYB78 to 2.2- and 12.2-folds at the 3 and 5 dpi, respectively (Fig. 8B). Besides, co-expression of BnaMYB78 and PNbHIN1-driving fLUC caused a 6.2- and 4.8-fold increase in fLUC activity at 3 and 5 dpi, respectively (Fig. 8C).
Figure 8.

BnaMYB78 activates the transcription of ROS- and defence-related marker genes in a dual luciferase (LUC) assay. (A) Schematic representation of the double-reporter and effector plasmids used in the dual LUC assay. The double-reporter plasmid contains the respective promoter regions fused to fLUC and Renilla luciferase (rLUC) driven by CaMV35S promoter. The effector plasmid contains the BnaMYB78 driven by the CaMV35S. Ter, NOS terminator. TL, translational leader. (B) BnaMYB78 activates the promoter regions of respective genes in Nicotiana benthamiana leaves. The ability of BnaMYB78 TF to activate the reporter fLUC gene was indicated by the ratio of fLUC to rLUC. Error bars indicate the S.E. of three biological replicates. Identical and different letters represent non-significant and significant differences.
Furthermore, to investigate whether canola MYB78 TF could regulate the expression of ROS- and defence-related genes of canola, we cloned the promoter regions of four orthologous canola genes involved in ROS generation, scavenging or defence response. Similarly, we performed a dual LUC assay and the results showed that BnaMYB78 did up-regulate the expression of fLUC driven by promoters of both BnaGST and BnaHIN1, compared with the GFP control (Supplementary Fig. S4). However, expression of BnaMYB78 down-regulated expression of PBnaRbohA- and PBnaRbohB-driving fLUC at both 3 and 5 dpi (Supplementary Fig. S4). The slight difference between orthologous pairs has been reported previously.12 Whether there are other canola MYB genes mediating cell death or ROS signalling awaits to be investigated further.
4. Conclusion
MYB TFs are very important in plant development, abiotic stress and defence responses. So far, function of only a small number MYB genes in Arabidopsis, rice, wheat and tomato has been reported.1,2 In the present study, we described the identification, cloning and analysis of R2R3-MYB genes in the important oilseed crop, canola, through mining of EST databases. We successfully identified 76 R2R3-MYB genes from canola and cloned the cDNA sequences of 44 R2R3-MYB genes (Table 1). An analysis of the phylogenetic relationship of R2R3-MYB proteins from representative plant species indicated an evident increasing numbers of R2R3-MYB genes from lower to higher plants. This also suggests that different types of duplications of R2R3-MYB genes may occur during the evolutionary history. Further, we studied the transcriptional activity of 36 BnaMYB TFs in yeast and found that 26 of them may function as transcriptional activators in cells while the other 10 BnaMYBs may act as transcriptional repressors (Fig. 2). The responses of 15 BnaMYB genes under abiotic stress and hormone treatments were analysed through qRT–PCR, and we found that 12 BnaMYB genes could be significantly regulated by at least one treatment, suggesting MYB TFs may participate in the cross-talk of different signalling pathways under stress conditions. More importantly, we identified expression of a novel MYB, BnaMYB78, led to cell death in leaves of N. benthamiana, which is dependent on ROS accumulation (Fig. 5). A further investigation of transcription of ROS- and defence-related marker genes supported that BnaMYB78 might exert its function through modulating the expression of a few ROS- and defence-related genes including RbohB, GST and HIN1. A bioinformatic analysis and literature search indicated that MYB78 is a novel cell death-mediating member of MYB TF family. Overall, this study of R2R3-MYB genes in canola has laid a solid foundation for further exploration of their roles in abiotic stress and ABA signalling. It also provides important information for genetic manipulation of the abundance and/or activity of related MYBs to improve stress tolerance of canola.
Supplementary data
Supplementary data are available at www.dnaresearch.oxfordjournals.org.
Funding
This work was supported by the Young Talent funding (No. K318009902-1425 to Y.-Q. J.) provided by the Institute of Soil and Water Conservation. Funding to pay the Open Access publication charges for this article was provided by the Young Talent funding [No. K318009902-1425 to Y-Q.J.] provided by the Institute of Soil and Water Conservation, NWAFU.
Supplementary Material
Acknowledgements
We thank Prof. Jin-Song Zhang (Chinese Academy of Sciences) for providing the vectors used in protoplast transfection assay and Prof. Jian-Ye Chen (South China Agricultural University) for technical help.
References
- 1.Stracke R., Werber M., Weisshaar B.. 2001, The R2R3-MYB gene family in Arabidopsis thaliana, Curr. Opin. Plant Biol., 4, 447–56. [DOI] [PubMed] [Google Scholar]
- 2.Dubos C., Stracke R., Grotewold E., Weisshaar B., Martin C., Lepiniec L.. 2010, MYB transcription factors in Arabidopsis, Trends Plant Sci., 15, 573–81. [DOI] [PubMed] [Google Scholar]
- 3.Chen Y., et al. 2006, The MYB transcription factor superfamily of Arabidopsis: expression analysis and phylogenetic comparison with the rice MYB family, Plant Mol. Biol., 60, 107–24. [DOI] [PubMed] [Google Scholar]
- 4.Katiyar A., et al. 2012, Genome-wide classification and expression analysis of MYB transcription factor families in rice and Arabidopsis, BMC Genomics, 13, 544. [DOI] [PMC free article] [PubMed] [Google Scholar]
- 5.Jiang C., Gu J., Chopra S., Gu X., Peterson T.. 2004, Ordered origin of the typical two- and three-repeat Myb genes, Gene, 326, 13–22. [DOI] [PubMed] [Google Scholar]
- 6.Paz-Ares J., Ghosal D., Wienand U., Peterson P., Saedler H.. 1987, The regulatory c1 locus of Zea mays encodes a protein with homology to myb proto-oncogene products and with structural similarities to transcriptional activators, EMBO J., 6, 3553–8. [DOI] [PMC free article] [PubMed] [Google Scholar]
- 7.Zhang L., Zhao G., Jia J., Liu X., Kong X.. 2012, Molecular characterization of 60 isolated wheat MYB genes and analysis of their expression during abiotic stress, J. Exp. Bot., 63, 203–14. [DOI] [PMC free article] [PubMed] [Google Scholar]
- 8.Ren F., et al. 2012, Brassica napus PHR1 gene encoding a MYB-like protein functions in response to phosphate starvation, PLoS ONE, 7, e44005. [DOI] [PMC free article] [PubMed] [Google Scholar]
- 9.Wei Y.L., et al. 2007, Molecular cloning of Brassica napus TRANSPARENT TESTA 2 gene family encoding potential MYB regulatory proteins of proanthocyanidin biosynthesis, Mol. Biol. Rep., 34, 105–20. [DOI] [PubMed] [Google Scholar]
- 10.Yang B., Srivastava S., Deyholos M.K., Kav N.N.V.. 2007, Transcriptional profiling of canola (Brassica napus L.) responses to the fungal pathogen Sclerotinia sclerotiorum, Plant Sci., 173, 156–71. [Google Scholar]
- 11.Liang W.-W., et al. 2013, Identification and analysis of MKK and MPK gene families in Canola (Brassica napus L.), BMC Genomics, 14, 392. [DOI] [PMC free article] [PubMed] [Google Scholar]
- 12.Wang B., et al. 2015, Identification and characterization of plant-specific NAC gene family in canola (Brassica napus L.) reveal novel members involved in cell death, Plant Mol. Biol., 87, 395–411. [DOI] [PubMed] [Google Scholar]
- 13.Sun Y., et al. 2014, Identification and functional analysis of mitogen-activated protein kinase kinase kinase (MAPKKK) genes in canola (Brassica napus L.), J. Exp. Bot., 65, 2171–88. [DOI] [PMC free article] [PubMed] [Google Scholar]
- 14.Niu F., et al. 2014, Canola (Brassica napus L.) NAC103 transcription factor gene is a novel player inducing reactive oxygen species accumulation and cell death in plants, Biochem. Biophys. Res. Commun., 454, 30–5. [DOI] [PubMed] [Google Scholar]
- 15.Hellens R.P., et al. 2005, Transient expression vectors for functional genomics, quantification of promoter activity and RNA silencing in plants, Plant Methods, 1, 13. [DOI] [PMC free article] [PubMed] [Google Scholar]
- 16.Ostergaard L., King G.J.. 2008, Standardized gene nomenclature for the Brassica genus, Plant Methods, 4, 10. [DOI] [PMC free article] [PubMed] [Google Scholar]
- 17.Du H., et al. 2012, Genome-wide analysis of the MYB transcription factor superfamily in soybean, BMC Plant Biol., 12, 106. [DOI] [PMC free article] [PubMed] [Google Scholar]
- 18.Li Q., Zhang C., Li J., Wang L., Ren Z.. 2012, Genome-wide identification and characterization of R2R3MYB family in Cucumis sativus, PLoS ONE, 7, e47576. [DOI] [PMC free article] [PubMed] [Google Scholar]
- 19.Stracke R., et al. 2014, Genome-wide identification and characterisation of R2R3-MYB genes in sugar beet (Beta vulgaris), BMC Plant Biol., 14, 249. [DOI] [PMC free article] [PubMed] [Google Scholar]
- 20.Du H., Feng B.R., Yang S.S., Huang Y.B., Tang Y.X.. 2012, The R2R3-MYB transcription factor gene family in maize, PLoS ONE, 7, e37463. [DOI] [PMC free article] [PubMed] [Google Scholar]
- 21.Wilkins O., Nahal H., Foong J., Provart N.J., Campbell M.M.. 2009, Expansion and diversification of the Populus R2R3-MYB family of transcription factors, Plant Physiol., 149, 981–93. [DOI] [PMC free article] [PubMed] [Google Scholar]
- 22.Derelle E., et al. 2006, Genome analysis of the smallest free-living eukaryote Ostreococcus tauri unveils many unique features, Proc. Natl Acad. Sci. USA, 103, 11647–52. [DOI] [PMC free article] [PubMed] [Google Scholar]
- 23.Fujimoto S.Y., Ohta M., Usui A., Shinshi H., Ohme-Takagi M.. 2000, Arabidopsis ethylene-responsive element binding factors act as transcriptional activators or repressors of GCC box-mediated gene expression, Plant Cell, 12, 393–404. [DOI] [PMC free article] [PubMed] [Google Scholar]
- 24.Ikeda M., Ohme-Takagi M.. 2009, A novel group of transcriptional repressors in Arabidopsis, Plant Cell Physiol., 50, 970–5. [DOI] [PubMed] [Google Scholar]
- 25.Kagale S., Links M.G., Rozwadowski K.. 2010, Genome-wide analysis of ethylene-responsive element binding factor-associated amphiphilic repression motif-containing transcriptional regulators in Arabidopsis, Plant Physiol., 152, 1109–34. [DOI] [PMC free article] [PubMed] [Google Scholar]
- 26.Jung C.G., et al. 2015, Molecular characterization of the cold- and heat-induced Arabidopsis PXL1 gene and its potential role in transduction pathways under temperature fluctuations, J. Plant Physiol., 176, 138–46. [DOI] [PubMed] [Google Scholar]
- 27.Kidokoro S., et al. 2015, Soybean DREB1/CBF-type transcription factors function in heat and drought as well as cold stress-responsive gene expression, Plant J., 81, 505–18. [DOI] [PubMed] [Google Scholar]
- 28.Kilian J., et al. 2007, The AtGenExpress global stress expression data set: protocols, evaluation and model data analysis of UV-B light, drought and cold stress responses, Plant J., 50, 347–63. [DOI] [PubMed] [Google Scholar]
- 29.Coll N.S., Epple P., Dangl J.L.. 2011, Programmed cell death in the plant immune system, Cell Death Differ., 18, 1247–56. [DOI] [PMC free article] [PubMed] [Google Scholar]
- 30.Nagata T., et al. 2003, Levels of active oxygen species are controlled by ascorbic acid and anthocyanin in Arabidopsis, J. Agric. Food Chem., 51, 2992–9. [DOI] [PubMed] [Google Scholar]
- 31.Daniel X., Lacomme C., Morel J.B., Roby D.. 1999, A novel myb oncogene homologue in Arabidopsis thaliana related to hypersensitive cell death, Plant J., 20, 57–66. [DOI] [PubMed] [Google Scholar]
- 32.Vailleau F., et al. 2002, A R2R3-MYB gene, AtMYB30, acts as a positive regulator of the hypersensitive cell death program in plants in response to pathogen attack, Proc. Natl Acad. Sci. USA, 99, 10179–84. [DOI] [PMC free article] [PubMed] [Google Scholar]
- 33.Raffaele S., et al. 2008, A MYB transcription factor regulates very-long-chain fatty acid biosynthesis for activation of the hypersensitive cell death response in Arabidopsis, Plant Cell., 20, 752–67. [DOI] [PMC free article] [PubMed] [Google Scholar]
- 34.Mittler R., Vanderauwera S., Gollery M., Van Breusegem F.. 2004, Reactive oxygen gene network of plants, Trends Plant Sci., 9, 490–8. [DOI] [PubMed] [Google Scholar]
- 35.Kaur G., Sharma A., Guruprasad K., Pati P.K.. 2014, Versatile roles of plant NADPH oxidases and emerging concepts, Biotechnol. Adv., 32, 551–63. [DOI] [PubMed] [Google Scholar]
- 36.Yoshioka H., et al. 2003, Nicotiana benthamiana gp91phox homologs NbrbohA and NbrbohB participate in H2O2 accumulation and resistance to Phytophthora infestans, Plant Cell, 15, 706–18. [DOI] [PMC free article] [PubMed] [Google Scholar]
- 37.Hara-Nishimura I., Hatsugai N., Nakaune S., Kuroyanagi M., Nishimura M.. 2005, Vacuolar processing enzyme: an executor of plant cell death, Curr. Opin. Plant Biol., 8, 404–8. [DOI] [PubMed] [Google Scholar]
- 38.Watanabe N., Lam E.. 2011, Arabidopsis metacaspase 2d is a positive mediator of cell death induced during biotic and abiotic stresses, Plant J., 66, 969–82. [DOI] [PubMed] [Google Scholar]
- 39.Vercammen D., et al. 2004, Type II metacaspases Atmc4 and Atmc9 of Arabidopsis thaliana cleave substrates after arginine and lysine, J. Biol. Chem., 279, 45329–36. [DOI] [PubMed] [Google Scholar]
- 40.He R., et al. 2008, Metacaspase-8 modulates programmed cell death induced by ultraviolet light and H2O2 in Arabidopsis, J. Biol. Chem., 283, 774–83. [DOI] [PubMed] [Google Scholar]
- 41.Maxwell D.P., Wang Y., McIntosh L.. 1999, The alternative oxidase lowers mitochondrial reactive oxygen production in plant cells, Proc. Natl Acad. Sci. USA, 96, 8271–6. [DOI] [PMC free article] [PubMed] [Google Scholar]
- 42.Davletova S., Schlauch K., Coutu J., Mittler R.. 2005, The zinc-finger protein Zat12 plays a central role in reactive oxygen and abiotic stress signaling in Arabidopsis, Plant Physiol., 139, 847–56. [DOI] [PMC free article] [PubMed] [Google Scholar]
- 43.Heller J., Tudzynski P.. 2011, Reactive oxygen species in phytopathogenic fungi: signaling, development, and disease, Annu. Rev. Phytopathol., 49, 369–90. [DOI] [PubMed] [Google Scholar]
- 44.Heese A., et al. 2007, The receptor-like kinase SERK3/BAK1 is a central regulator of innate immunity in plants, Proc. Natl Acad. Sci. USA, 104, 12217–22. [DOI] [PMC free article] [PubMed] [Google Scholar]
- 45.Pontier D., Gan S., Amasino R.M., Roby D., Lam E.. 1999, Markers for hypersensitive response and senescence show distinct patterns of expression, Plant Mol. Biol., 39, 1243–55. [DOI] [PubMed] [Google Scholar]
Associated Data
This section collects any data citations, data availability statements, or supplementary materials included in this article.