

Abstract
Background
The dorsolateral prefrontal cortex (DLPFC) is a common target for repetitive transcranial magnetic stimulation (rTMS) in major depression, but the conventional “5 cm rule” misses DLPFC in > 1/3 cases. Another heuristic, BeamF3, locates the F3 EEG site from scalp measurements. MRI-guided neuronavigation is more onerous, but can target a specific DLPFC stereotaxic coordinate directly. The concordance between these two approaches has not previously been assessed.
Objective
To quantify the discrepancy in scalp site between BeamF3 versus MRI-guided neuronavigation for left DLPFC.
Methods
Using 100 pre-treatment MRIs from subjects undergoing left DLPFC-rTMS, we localized the scalp site at minimum Euclidean distance from a target MNI coordinate (X − 38 Y + 44 Z + 26) derived from our previous work. We performed nasion-inion, tragus–tragus, and head-circumference measurements on the same subjects’ MRIs, and applied the BeamF3 heuristic. We then compared the distance between BeamF3 and MRI-guided scalp sites.
Results
BeamF3-to-MRI-guided discrepancies were <0.65 cm in 50% of subjects, <0.99 cm in 75% of subjects, and <1.36 cm in 95% of subjects. The angle from midline to the scalp site did not differ significantly using MRI-guided versus BeamF3 methods. However, the length of the radial arc from vertex to target site was slightly but significantly longer (mean 0.35 cm) with MRI-guidance versus BeamF3.
Conclusions
The BeamF3 heuristic may provide a reasonable approximation to MRI-guided neuronavigation for locating left DLPFC in a majority of subjects. A minor optimization of the heuristic may yield additional concordance.
Keywords: Neuronavigation, Prefrontal cortex, Transcranial magnetic stimulation, Magnetic resonance imaging, Scalp
Introduction
Repetitive transcranial magnetic stimulation (rTMS) is a non-invasive brain stimulation technique that uses powerful, focused magnetic pulses to induce durable changes in the activity of target brain regions. In addition to its research applications, rTMS is being studied as a treatment for a wide variety of neurological and psychiatric conditions [1], ranging from Parkinson’s disease [2] and chronic pain [3] to obsessive-compulsive disorder [4], post-traumatic stress disorder [5], and eating disorders [6,7]. However, its most common application at present is in the treatment of medication-resistant major depressive episodes, with efficacy now demonstrated in dozens of randomized sham-controlled trials [8–11] and reviewed in several large meta-analyses [12,13]. rTMS is currently approved for this indication in a number of jurisdictions including the USA, Canada, the European Union, Australia, New Zealand, and Israel, with hundreds of clinics currently in operation and treating tens of thousands of patients annually.
As a focal brain stimulation technique, rTMS differs from conventional antidepressant treatments such as medications or psychotherapy, in being rather more anatomically specific in its mechanism of action. For this reason, the efficacy of rTMS depends critically upon both the choice of stimulation target and upon the accuracy of the methods used to locate this target for stimulation [14,15]. In the case of major depression, a variety of potentially useful rTMS targets have been considered [16]. However, with a few exceptions [17,18], the vast majority of clinical trials and therapeutic centers have targeted the dorsolateral prefrontal cortex (DLPFC), most commonly on the left (e.g., Ref. [10]), but in some cases on the right [19], or bilaterally [20,21]. The DLPFC is also a common choice of target in a variety of other neurological and psychiatric conditions, including Alzheimer’s disease [22], fibromyalgia [23], PTSD [24], OCD [25], anorexia nervosa [7], and alcohol abuse [26].
A significant technical challenge in performing rTMS of the DLPFC lies in accurately locating the appropriate scalp site for coil placement during treatment. Stimulation of some brain regions, such as primary motor cortex, elicits direct and measurable responses such as motor evoked potentials (MEPs), which can then be used to locate an optimal “motor hotspot” for coil placement. However, stimulation of DLPFC does not elicit MEPs directly; as a result, analogous methods cannot readily be applied for locating the optimal scalp site for DLPFC-rTMS. Instead, alternative heuristics based on scalp measurements or neuroimaging techniques are required.
One of the earliest and most widely used heuristics for locating the DLPFC is the so-called “5 cm rule”, in which the motor hotspot for the contralateral abductor pollicis brevis muscle is first identified during motor threshold testing, and then a target site is defined 5 cm anteriorly to this site for DLPFC stimulation [8]. While relatively simple to perform, the 5 cm method suffers somewhat in accuracy, and when assessed against MRI, often proves to have located a site that is outside the DLPFC proper. For example, one large trial found that this approach missed the DLPFC in as many as 1/3 of patients undergoing treatment [11]. Likewise, another group [27] found that the 5 cm rule correctly located the DLPFC in only 7 of 22 subjects. A more recent study [28] found an average discrepancy of 2 cm between the site identified with the 5 cm rule and the MRI-guided site. In response to such findings, some studies have adopted a modified “6 cm rule” or “7 cm rule”, although these heuristics likewise appears less reliable than stereotaxic localization [29].
Notwithstanding such adjustments, the application of any rule requiring “anterior” measurement upon a curved surface has the potential to introduce significant variability across subjects of different cranial sizes and geometries; this variability in turn has the potential to impact upon treatment efficacy. For example, one study found that the 5 cm rule led to considerable scatter of target site across the left lateral prefrontal cortex in 54 individuals undergoing rTMS for major depression; moreover, subjects with more anterior and more lateral stimulation sites were more likely to respond to treatment [15]. Likewise, in a randomized comparison in 51 patients, Fitzgerald et al. found significantly better outcomes with DLPFC targeted using MRI-based neuronavigation rather than the 5 cm rule [30].
An alternative approach to the 5 cm rule uses targets defined with respect to the international 10–20 electroencephalograhy (EEG) electrode placement system in an attempt to achieve more consistent coil placement across individuals. The F3 and F4 EEG electrodes, for example, have been used as approximations of the scalp sites for left and right DLPFC-rTMS in several studies [31,32]. As an aid for localizing these sites, a recently developed algorithm known as BeamF3 aims to provide accurate localization of the F3 electrode site from just three measurements: head circumference, nasion-inion distance, and left tragus-right tragus distance [33]. An online calculator then provides a polar-coordinate approximation of the F3 site with respect to the scalp vertex.
The BeamF3 method proposes to circumvent the need for costly, limited-capacity neuroimaging resources, and offers the additional advantages of speed and simplicity. However, it remains questionable how accurately the F3 location actually represents the DLPFC as identified using MRI-based neuronavigation. One comparative study using MRI neuronavigation found that the DLPFC corresponded more closely to F5, or to an intermediate location between F3 and F5 [34]. Another recent study [35], comparing BeamF3 to MRI-based navigation in 12 healthy controls, found inter-individual site variability of approximately ±10 mm (standard deviation) in Euclidean distance across the three axes of measurement, suggesting significant residual variability in the stereotaxic site of stimulation.
One additional confounding factor in such studies is that the DLPFC itself is a large region, heterogenous in both its cytoarchitecture and anatomical connectivity to other regions [36–38]. As such, the optimal site within the DLPFC itself bears some defining before the accuracy of BeamF3, the 5 cm rule, or any other heuristic can be meaningfully assessed. In the setting of depression, a recent study [14] compared the patterns of whole-brain resting-state functional connectivity (rsFC) on functional MRI (fMRI) associated with a variety of DLPFC targets used in previous rTMS studies. The best clinical efficacy was found in DLPFC targets with a stronger pattern of rsFC negative correlation to the subgenual cingulate cortex, previously shown to be an effective target for deep brain stimulation in the same condition [39]. The study then identified stereotaxic coordinates for an ‘optimized’ DLPFC-rTMS target (at Montreal Neurological Institute coordinates X − 38 Y + 44 Z + 26) based on negative correlation of its rsFC to a seed region in the subgenual cingulate target.
In ideal terms, MRI-guided (or ideally, functional MRI-guided), individualized neuronavigation could eventually prove to be the gold standard technique for targeting DLPFC-rTMS in major depression. In practical terms, with the prevalence of treatment-resistant depression at approximately 2% of the population [40], universal implementation of structural or functional MRI-based neuronavigation could place a prohibitive strain on MRI capacities and costs, even in relatively wealthy industrialized economies. It is therefore of interest to quantify how much additional accuracy is gained by using MRI-guided neuronavigation as opposed to scalp-based heuristics. It is also of interest to determine whether existing heuristics might be optimized in order to increase their agreement with MRI-guided approaches.
In the present study, we aimed to address these questions by comparing the scalp site for DLPFC stimulation obtained using the BeamF3 heuristic to that obtained using MRI-guided neuronavigation to the target MNI coordinate [X − 38 Y + 44 Z + 26] recently identified as optimal based on clinical efficacy and rsFC. For the sake of verisimilitude, we performed both types of localization in a sample of 100 MRIs obtained from patients with unipolar major depression who had enrolled in an ongoing randomized clinical treatment trial of rTMS applied to the left DLPFC site under MRI guidance. We then measured the geodesic distance between the BeamF3 and the MRI-guided scalp site in each patient to create a distribution of discrepancy across the entire sample. Finally, in order to assess whether the BeamF3 approach might be further optimized, we performed a statistical comparison to identify any significant, systematic differences in the radial or angular measurements from the vertex to the scalp site under the BeamF3 versus the MRI-guided techniques.
Methods
Participants
Participants’ MRIs were obtained from a series of the first 100 individuals enrolled in an ongoing randomized clinical trial of rTMS in unipolar major depressive disorder (ClinicalTrials.gov ID: NCT01887782). This group consisted of 57 female and 43 male patients, ages 18–62 (mean 42.1 ± SD 12.3), 88 right handed, 9 left-handed, and 3 of mixed handedness based on the Edinburgh Handedness Inventory. At the time they underwent MRI, all participants met DSM-IV diagnostic criteria for a major depressive disorder, with a score ≥18 on the 17-item Hamilton Rating Scale for Depression, having failed at least 1 adequate trial of medication in the current episode, and with no change in medication regimen in the 4 weeks prior to scanning. In order to meet eligibility criteria for the rTMS trial, all patients were also free of any contraindications to rTMS or MRI, had no history of neurological injury or illness, and no history of bipolar or psychotic illness. All patients gave written informed consent for study participation, and the study was approved by the Research Ethics Boards of the University Health Network and the Centre for Addiction and Mental Health.
MRI acquisition
All participants underwent MRI on a 3T GE Signa HDx scanner equipped with an 8-channel phased-array coil. The MRI sequence used for this study was a T1-weighted fast spoiled gradient echo anatomical series (TE 12 ms, TI 300 ms, flip angle 20°) comprising 116 sagittal slices of 1.5 mm thickness with no gap, a 256 × 256 matrix and a 240 mm field of view, yielding a voxel-wise resolution of 0.9375 × 0.9375 × 1.5 mm. These MRIs were performed in the week prior to randomization into the trial, to be used for neuronavigation; at the time of scanning, participants had not yet undergone any rTMS sessions or other changes in treatment regimen.
Determination of BeamF3 scalp site
The BeamF3 algorithm takes as input 3 scalp measurements: NI, the nasion-inion distance, TrTr, the left tragus-right tragus distance through the scalp vertex (at 50% of the nasion-inion distance), and HC, the head circumference measured through the FPz-Oz plane in the international 10–20 EEG system in this study, as a more systematic implementation of the “eyebrow level” HC measurement recommended in the original description of BeamF3 [33]. From these 3 measurements, the algorithm returns two values: X, a value for the length of an arc to be marked leftwards along the head circumference from the midline, and Y, a value for the radial distance along a line from the vertex to the point defined at X (see Fig. 1C for illustration).
Figure 1.

Comparison of scalp sites for BeamF3 versus MRI-guided methods. Using the cardinal scalp measurements (obtained as in Fig. 3), the BeamF3 algorithm returned values for circumferential arc X and radial arc Y, thereby indicating a scalp location for F3, to be used in stimulating left DLPFC. The BeamF3-generated measurement for Arc X was first traced along the head circumference (A) and the image volume then resliced through the vertical plane from the vertex through point X. The BeamF3-generated measurement for Arc Y was then traced along the scalp in this plane (B) to locate the BeamF3 point. The distance between the BeamF3 scalp site and the scalp site at minimum distance from the MRI-guided coordinate was then measured (C) to quantify the discrepancy. Finally, the image volume was again resliced in the vertical plane from the vertex through the MRI-guided scalp site rather than the BeamF3 site, in order to measure empirical MRI-guided values for parameters X and Y for comparison to the BeamF3-generated values.
In order to perform these measurements as accurately as possible, so as to facilitate comparison of distances between the neuronavigated and BeamF3 scalp sites, the MRIs were loaded into Osirix 5.9 software (Pixmeo, Geneva, Switzerland). Next, the standard scalp landmarks (nasion, inion, left and right tragus) were manually identified and landmarked on the images. Next, using the curvilinear distance measurement tool, distances for NI, TrTr, and HC were determined in each participant (Fig. 2). These values were then entered into the freely available BeamF3 desktop application (clinicalresearcher.org/software.htm) to generate values for distances X and Y. Point X was then marked along the head circumference plane in Osirix, and the MRI volume was then resliced along the plane from the vertex to point X. In this plane, distance Y was then traced along the scalp to locate F3 according to the BeamF3 method (Fig. 1A and B).
Figure 2.

Determination of cardinal scalp measurements for BeamF3 localization of site for left DLPFC stimulation. Using the curvilinear measurement tool in Osirix 5.9 software, measurements were performed in each subject to determine (A) the length of the nasion-inion scalp surface line along the midline, as well as the positions for the vertex (Cz) at the midpoint of this line, and the points FPz and Oz at 10% of the nasion-inion distance from each end; (B) the head circumference in the horizontal plane passing through FPz and Oz; and (C) the length of the left tragus-right tragus scalp line along a plane through the vertex. These measurements served as inputs for the BeamF3 method for locating the scalp point for left DLPFC stimulation.
Determination of MRI-guided scalp site
In order to identify the scalp site for MRI-guided rTMS of the left DLPFC as faithfully as possible, the Visor 2.0 neuronavigation system (ANT Neuro, Enschede, Netherlands) itself was used to identify the stimulation target and associated scalp site that was actually used during MRI-guided rTMS in each individual (Fig. 3). After loading each subject’s raw MRI images into the Visor software, standard neuroanatomical landmarks were first identified, including the anterior commissure, posterior commissure, inter-hemispheric plane, and extrema of the cortex, to allow definition of standard stereotaxic space. Next, the left DLPFC target site was identified using the MNI coordinate [X − 38 Y + 44 Z + 26], previously identified as optimal based on functional connectivity and clinical efficacy [14]. Finally, the most proximate point on the scalp surface to this site was localized, by identifying the voxel on the scalp surface at minimum Euclidean distance from the target MNI coordinate via manual exploration, followed by a survey of all adjacent voxels to confirm the identified voxel as most proximal to the target coordinate (Fig. 3). This voxel was then marked in the Visor 2.0 software, and the entire image volume and marker were then exported in DICOM format for comparison to the BeamF3 site in Osirix software, as below.
Figure 3.

Approach for MRI-based localization of scalp site for left DLPFC stimulation. In each subject, the site of the MNI stereotaxic coordinate [X − 38 Y + 44 Z + 26] was first localized using the Visor 2.0 neuronavigation system (indicated as DLPFC in this figure). Next, the scalp site at minimum Euclidean distance from this coordinate was located in each subject (shown here in coronal, axial, sagittal, and surface-rendered views). Finally, this scalp site was marked and the image volume and marker exported in DICOM format for comparison to scalp-based localization methods as illustrated in Fig. 1.
Comparison of BeamF3 and neuronavigated scalp sites
In order to derive empirical values for X and Y for the neuro-navigated scalp sites across the 100 subjects, the centre of the exported marker from the Visor neuronavigation was located in Osirix, and the MRI volume was again resliced along the plane from the vertex to this marker (Fig. 1). The point of intersection between this plane and the head circumference was then marked as the neuronavigated, empirical point X, and the length of the arc along the head circumference from the midline to this neuronavigated point X was measured using the curvilinear measurement tool to define neuronavigated arc length X in each participant. Likewise, the length of the arc from the vertex to the neuronavigated scalp target was measured as neuronavigated length Y.
Finally, in order to determine the absolute values of the discrepancy between the BeamF3 and the neuronavigated scalp site in each participant, the curvilinear tool was once again used in Osirix to measure the distance from the BeamF3 site marked in the previous step, and the center of the exported marker on the scalp from the Visor neuronavigation system (Fig. 1C). The absolute magnitude of this distance was recorded as the neuronavigated-BeamF3 discrepancy.
Results
Scalp-based measurements
The distribution of scalp-based measurements is summarized in Table 1. Head circumference through FPz-Oz ranged from 52.62 to 62.44 cm (mean 57.31 ± SD 2.34 cm). Nasion-inion distance ranged from 32.48 to 41.49 cm (mean 36.32 ± SD 1.74 cm). Tragus–tragus distance ranged from 33.31 to 40.52 cm (mean 36.51 ± SD 1.53 cm).
Table 1.
Summary of measurements for DLPFC site localization using BeamF3 and MRI-guided approaches.
| Mean | SD | Minimum | Maximum | |
|---|---|---|---|---|
| Cardinal scalp measurements | ||||
| Nasion-inion (cm) | 36.32 | 1.74 | 32.48 | 41.49 |
| Left tragus-right tragus (cm) | 36.51 | 1.53 | 33.31 | 40.52 |
| Head circumference FPz-Oz (cm) | 57.31 | 2.34 | 52.62 | 62.44 |
| X parameter measurements | ||||
| BeamF3 X parameter (cm) | 6.62 | 0.27 | 6.05 | 7.12 |
| MRI-guided X parameter (cm) | 6.64 | 0.53 | 5.25 | 8.34 |
| BeamF3 X parameter | ||||
| (% head circumference) | 11.54% | 0.02% | 11.47% | 11.62% |
| MRI-guided X parameter | ||||
| (% head circumference) | 11.58% | 0.82% | 9.41% | 13.83% |
| Y parameter measurements | ||||
| BeamF3 Y parameter (cm) | 9.60 | 0.39 | 8.84 | 10.68 |
| MRI-guided Y parameter (cm) | 9.95 | 0.80 | 8.13 | 11.63 |
| BeamF3 Y parameter | ||||
| (% nasion-inion) | 26.44% | 0.43% | 25.40% | 27.70% |
| (% tragus–tragus) | 26.31% | 0.56% | 24.61% | 27.64% |
| (% avg HC and TrTr) | 26.37% | 0.08% | 26.05% | 26.49% |
| MRI-guided Y parameter | ||||
| (% nasion-inion) | ||||
| (% tragus–tragus) | ||||
| (% avg HC and TrTr) | 27.32% | 1.80% | 23.19% | 32.15% |
| Discrepancy measurement | ||||
| BeamF3 to MRI-guided F3 (cm) | 0.70 | 0.45 | 0.00 | 2.06 |
HC, head circumference; TrTr, tragus–tragus distance; SD, standard deviation.
Applying the BeamF3 algorithm, lengths for the circumferential arc X ranged from 6.05 to 7.12 cm (mean 6.62 ± SD 0.27 cm). Expressed as a percentage of the head circumference through FPz-Oz in each subject, X ranged from 11.47 to 11.62% (mean 11.54% ± SD 0.02%), with 95 of 100 subjects having a value for X in the range 11.49–11.60% of head circumference (Fig. 4A).
Figure 4.

Cumulative distributions for X and Y parameters using BeamF3 and MRI-guided approaches. Values for the X and Y localization parameters, expressed in terms relative to cardinal scalp measurements, are depicted here as cumulative distributions across the entire patient sample for the BeamF3 (A, B) versus the MRI-guided (C, D) scalp sites for left DLPFC stimulation.
Lengths for the radial arc Y from the vertex to F3 using BeamF3 ranged from 8.84 to 10.68 cm (mean 9.60 ± SD 0.39 cm). Expressed as a percentage of the nasion-inion distance in each subject, Y ranged from 25.40 to 27.70% (mean 26.44% ± SD 0.43%). Expressed as a percentage of the tragus–tragus distance in each subject, Y ranged from 24.61 to 27.64% (mean 26.31% ± SD 0.56%). Expressed as a percentage of the average of the nasion-inion and tragus–tragus distances in each subject, Y ranged from 26.05 to 26.49% (mean 26.37% ± SD 0.08%), with 95 of 100 subjects having a value for Y in the range 26.18–26.48% of this average value (Fig. 4B).
Neuronavigated measurements
The distribution of empirically-derived, neuronavigated measurements is summarized in Table 1. Lengths for the MRI-guided circumferential arc X (i.e., the arc from the midline to the point of intersection between the head circumference and the plane through the vertex and MRI-guided scalp target) ranged from 5.25 to 8.34 cm (mean 6.64 ± SD 0.53 cm). MRI-guided and BeamF3-determined values for X showed a significant correlation across individuals (r98 = 0.440, P < 0.00001), although the variance of the MRI-guided values for X was significantly higher (F1,99 = 3.67, P = 2.98 × 10⁻¹⁰). Expressed as a percentage of the head circumference through FPz-Oz in each subject, MRI-guided X ranged from 9.41 to 13.83% (mean 11.58% ± SD 0.82%), with 90 of 100 individuals having a value for X in the range 10.08–12.68% of their head circumference (Fig. 4C). Notably, the within-subjects comparison using paired t-tests yielded no significant difference in the value of X as determined via BeamF3 versus MRI-guided methods, whether on absolute measurements (BeamF3 6.62 ± SD 0.27 cm versus MRI-guided 6.64 ± SD 0.53 cm, paired t99 = 0.354, P = 0.724) or using percentages of head circumference (BeamF3 11.54% ± SD 0.02% versus 11.58% ± SD 0.82%, paired t99 = 0.384, P = 0.702).
Lengths for the MRI-guided radial arc Y from the vertex ranged from 8.13 to 11.63 cm (mean 9.95 ± SD 0.80 cm). MRI-guided and BeamF3-determined values for Y showed a significant correlation across individuals (r98 = 0.588, P = 1.23 × 10⁻¹⁰), although the variance of the MRI-guided values for Y was significantly higher (F1,99 = 3.97, P = 1.97 × 10⁻¹¹). Expressed as a percentage of the average of nasion-inion and tragus–tragus distance in each subject, MRI-guided Y ranged from 23.19 to 32.15% (mean 27.32% ± SD 1.80%), with 90 of 100 individuals having a value for Y in the range 24.48%–29.94% of their averaged nasion-inion and tragus–tragus distance (Fig. 4D). On within-subjects comparison using paired t-tests, the value for Y was significantly longer when determined by MRI-guided versus BeamF3 methods, both in absolute terms (MRI-guided 9.95 ± SD 0.80 cm versus BeamF3 9.60 ± SD 0.39 cm, t99 = 5.342, P < 0.000001) and using percentages of the averaged nasion-inion and tragus–tragus distance (MRI-guided 27.32% ± SD 1.80% versus BeamF3 26.37% ± SD 0.08%, t99 = 5.300, P < 0.000001). The MRI-guided Y value was, on average, 3.63% larger than the BeamF3 Y value. Across individual subjects, MRI-guided Y values ranged between 2.01 cm longer to 1.13 cm shorter than BeamF3 Y values (mean 0.35 cm longer ± SD 0.65 cm), with 90 of 100 individuals falling in the range −0.63 cm to + 1.39 cm from the BeamF3 Y value.
Directly measured discrepancies between BeamF3 and MRI-guided sites
In addition to the statistical comparisons above, we also performed a direct measurement in each subject of the distance between the scalp site identified by the BeamF3 method versus the scalp site identified by MRI-guided methods (at minimum Euclidean distance from the MNI coordinate [X − 38 Y + 44 Z + 26], as described above in the Methods section). The discrepancy between BeamF3 and MRI-guided sites ranged from nil to 2.06 cm (mean 0.70 cm ± SD 0.45 cm), with 95 of 100 individuals having a discrepancy of less than 1.36 cm, 90 of 100 individuals with a discrepancy of less than 1.30 cm, and 75 of 100 individuals having a discrepancy of less than 1.00 cm (Fig. 5).
Figure 5.
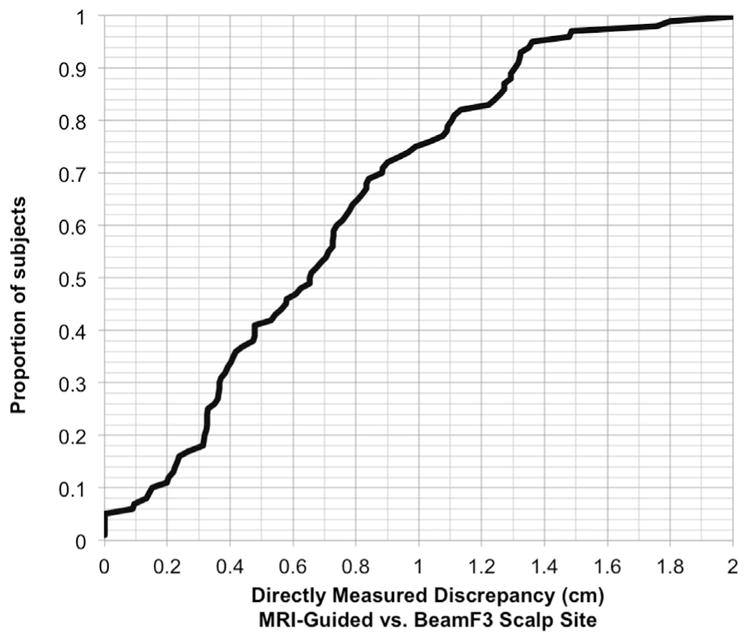
Cumulative distribution for the absolute values of the distance between BeamF3 and MRI-guided scalp sites. Values for the distance between the scalp site localized using the BeamF3 approach versus the scalp site localized using the MRI-guided approach to left DLPFC stimulation, depicted here as a cumulative distribution across the entire patient sample.
Discussion
To our knowledge, this is the first direct comparison of BeamF3 versus MRI-guided targeting methods in a sample of this size in patients actually about to undergo a course of neuronavigated rTMS for major depression [41]. A number of salient observations emerge from the results of the present study. First, the values for X and Y generated by the BeamF3 heuristic were consistently and accurately approximated by simple percentages of cardinal scalp measurements. X was well approximated as 11.54% of the head circumference through the FPz-Oz plane, and Y was well approximated as 26.3–4% of the nasion-inion or tragus–tragus distance, and still more consistently approximated as 26.37% of the average of these two measurements. These findings suggest that a simple set of percentage calculations might reasonably be applied to the three cardinal scalp measurements, if access to the algorithm were unavailable. They also suggest that, in the event of small refinements to the BeamF3 algorithm, slightly adjusted percentage calculations might be able to locate the intended site with reasonable consistency.
Second, a direct measurement of the distance between the BeamF3 site with the scalp site closest to the optimized coordinate [X − 38 Y + 44 Z + 26] revealed a surprisingly close concordance in the majority of subjects. The average discrepancy was only 0.70 cm, with 75% of subjects falling within 1.0 cm and 90% of subjects within 1.3 cm of the MRI-guided scalp site, using the BeamF3 method.
Third, although there was no significant within-subject difference in the X measurement using either method, the Y measurement did show a consistent and strongly significant within-subject discrepancy between BeamF3 and MRI-guided methods. This discrepancy could be annulled by increasing the BeamF3 Y value by 0.35 cm (or 3.63% in relative terms). Thus, even in the absence of a structural MRI, it appears that the concordance of BeamF3 with the optimal MRI-guided site may be improved by adjusting the Y but not the X value.
In order to address the question of whether a modified BeamF3 method might achieve acceptable concordance with MRI-guided methods, one must consider the degree of precision that can reasonably be expected from a neuronavigation suite. Calibration tolerances for most navigation systems are typically 2–3 mm, and an experienced technician may reasonably be expected to achieve targeting tolerances on the order of 1–2 mm during treatment, based on local clinical experience. Additional error may accrue due to imperfect identification of fiduciary landmarks or coregistration to the MRI at each session, or subtle migration of the head-tracking markers subsequent to coregistration during the session. All of these sources of error have the potential to degrade the accuracy of neuronavigated treatment sessions below 5–6 mm, even under ideal conditions.
One must also consider that there is as yet no accepted consensus on the ideal stereotaxic coordinates for DLPFC stimulation, either across groups or in individuals. The stimulation coordinate used in the present study was identified as optimal based on analyses of averaged datasets comprising > 100 individuals [14,15,42]. However, there is considerable heterogeneity in the gross morphology and stereotaxic position of the DLPFC across individuals [43]. Furthermore, this structural-anatomical variability may be compounded by functional-anatomical variability in the precise location of the DLPFC region showing peak negative correlation with the subgenual cingulate cortex [44]. All of these sources of variability may themselves contribute in excess of 10 mm of heterogeneity, if not more, regarding the optimal stimulation target.
In this context, individualized site selection, based on both structural and functional neuroimaging, may be required for truly optimal targeting of rTMS within the DLPFC, or many other brain areas [45,46]. However, at this stage, techniques for individualized tailoring of the stimulation site and the stimulation pattern are still relatively new, have relatively few trials assessing their efficacy over non-individualized regimens [47,48], and have not yet entered routine use in most therapeutic rTMS facilities. The question therefore remains whether, for a fixed stereotaxic coordinate in the DLPFC, the additional logistical burdens and expenses of MRI-guided neuronavigation are required for precise targeting, or whether comparable accuracy might also be achieved through faster, simpler, and much less expensive scalp-based heuristics in a majority of individuals.
The results of the present study do suggest that an optimized heuristic, using simple percentages of the three cardinal scalp measures, can achieve localization accuracies of <1.0 cm with respect to a fixed stereotaxic coordinate, in the majority of subjects. In light of the significant anatomical variability of the DLPFC itself, and in light of the 2–3 cm radii of the fields commonly employed in therapeutic rTMS at para-threshold intensities, and in light of the residual sources of imprecision that hamper even MRI-guided methods, an average discrepancy of 6.5 mm may be acceptably close to the precision of neuronavigation for many therapeutic applications.
Several limitations of the present study require acknowledgment. First, it is possible that the software-based methods used for the cardinal scalp measurements obtained substantially more precise or consistent measurements than would be reasonably achieved using in vivo techniques. Thus, it could be argued that the real-life precision of in vivo scalp measurement may be less than observed in the present study. Indeed, to our knowledge, the test-retest reliability of BeamF3 localization has not yet been systematically assessed in vivo. A definitive assessment of the precision and consistency of in vivo scalp measurements across several sessions by a given technician, or across several technicians, is beyond the scope of the present study. However, it should be noted that inter-session and inter-technician variability are not eliminated by neuronavigation methods either, as discussed above. Thus the present study should be understood as limited to comparing the two methods within the more controlled framework of image-based analysis. The impact of various sources of in vivo variability, such as hair density, skull asymmetry, or inter-session or inter-operator variability, may bear investigation in a future study.
Another potential concern is whether the observed degree of concordance applies equally across various ethnicities. The present sample derived from a highly ethnically diverse population in the downtown Toronto area; due to a high proportion of individuals with multi-ethnic ancestry, it was felt to be neither possible nor meaningful to categorize the sample arbitrarily into distinct ethnic groups. While the ethnic diversity of the sample does allow it to represent a broader range of human ancestries, the results may still need to be applied with caution in settings where the patient population is more homogenous.
Finally, the present study does not directly address the question of whether scalp-based heuristics such as BeamF3 do indeed match the clinical efficacy of neuronavigation methods in treating clinical disorders, such as major depression. The randomized controlled trial from which the present sample derives employed neuronavigated methods for all subjects, and thus is not designed to address this question. To date, a relatively small number of trials have directly addressed this issue (e.g., Ref. [30]), and to our knowledge none have directly compared the BeamF3 method to the stereotaxic coordinate used here. The results of the present study suggest that the spatial separation between these two scalp sites is relatively small, in the context of other sources of variation in target location and coil placement. Further improvements in treatment efficacy may therefore require individualized functional-anatomical mapping and optimization of the stimulation pattern itself, rather than further adjustments to the position of some fixed coordinate on either the MRI or the scalp.
Conclusions
The present study suggests that the BeamF3 heuristic can achieve a close approximation of the scalp site used for MRI-guided stimulation of an optimized, functional-connectivity-based stereotaxic coordinate in the left DLPFC. Minor modifications to the radial measurement Y may further improve the concordance. While truly individually optimized rTMS may eventually be achieved via functional mapping and tailored stimulation patterns, such techniques are currently still in development, complex to implement, and prohibitively expensive when considering the tremendously large number of cases of treatment-resistant major depression requiring treatment. Thus, for the time being, in the many settings where neuronavigation is unavailable or prohibitively expensive, a modified BeamF3 heuristic may be an acceptable alternative for large numbers of patients worldwide.
Acknowledgments
The authors acknowledge support for this research from the Canadian Institutes of Health Research (MOP136801), Brain Canada, the Temerty Family through the Centre for Addiction and Mental Health (CAMH) Foundation, and the Edgestone Foundation through the Toronto General and Western Hospital Foundation.
Footnotes
Conflict of interest statement
MDF was supported in part by grants from the National Institutes of Health (K23NS083741), AAN/American Brain Foundation, and the Sidney R. Baer Foundation. He is listed as inventor in issued patents or patent applications on functional connectivity and guidance of TMS. PG is a consultant for St. Jude Medical and has received personal fees from Eli Lilly Canada, Bristol-Myers Squibb, AstraZeneca, and Pfizer. He has also received research support from the Canadian Institutes of Health Research, Michael J. Fox Foundation for Parkinson’s Research, the Brain and Behavior Research Foundation (formerly National Alliance for Research on Schizophrenia and Depression), and the National Institutes of Health. ZJD has in the last 5 years received research and equipment in-kind support for an investigator-initiated study through Brainsway Inc. ZJD has also served on the advisory board for Hoffmann-La Roche Limited and Merck and received speaker support from Sepracor and Eli Lilly. This work was supported by the Ontario Mental Health Foundation (OMHF), the Canadian Institutes of Health Research (CIHR), the Brain and Behaviour Research Foundation and the Temerty Family and Grant Family and through the Centre for Addiction and Mental Health (CAMH) Foundation and the Campbell Institute. DMB receives research support from the Canadian Institutes of Health Research (CIHR), Brain and Behavior Research Foundation (formerly NARSAD), National Institutes of Health (NIH), Temerty Family through the Centre for Addiction and Mental Health (CAMH) Foundation and the Campbell Family Research Institute. He receives non-salary operating funds and in-kind equipment support from Brainsway Ltd. for an investigator-initiated study. He is the site principal investigator for several sponsor-initiated clinical trials from Brainsway Ltd. He receives in-kind equipment support from Tonika/Magventure for an investigator-initiated study. JD has received research support from the Canadian Institutes of Health Research, Brain Canada, the National Institutes of Health, the Klarman Family Foundation, the Edgestone Foundation, and the Toronto General and Western Hospital Foundation, as well as travel stipends from Lundbeck and ANT Neuro, and in-kind equipment support for an investigator-initiated study from MagVenture. AM-M, RC, PF, and KL report no conflicts of interest. This work was supported by the Ontario Mental Health Foundation (OMHF), the Canadian Institutes of Health Research (CIHR) (MOP136801), the Brain and Behaviour Research Foundation and the Temerty Family and Grant Family and through the Centre for Addiction and Mental Health (CAMH) Foundation and the Campbell Institute.
References
- 1.Lefaucheur J-P, André-Obadia N, Antal A, et al. Evidence-based guidelines on the therapeutic use of repetitive transcranial magnetic stimulation (rTMS) Clin Neurophysiol. 2014 Nov;125(11):2150–206. doi: 10.1016/j.clinph.2014.05.021. [DOI] [PubMed] [Google Scholar]
- 2.Eggers C, Günther M, Rothwell J, Timmermann L, Ruge D. Theta burst stimulation over the supplementary motor area in Parkinson’s disease. J Neurol. 2015 Feb;262(2):357–64. doi: 10.1007/s00415-014-7572-8. [DOI] [PubMed] [Google Scholar]
- 3.O’Connell NE, Wand BM, Marston L, Spencer S, Desouza LH. Non-invasive brain stimulation techniques for chronic pain. Cochrane Database Syst Rev. 2014;4:CD008208. doi: 10.1002/14651858.CD008208.pub3. [DOI] [PubMed] [Google Scholar]
- 4.Mantovani A, Simpson HB, Fallon BA, Rossi S, Lisanby SH. Randomized sham-controlled trial of repetitive transcranial magnetic stimulation in treatment-resistant obsessive-compulsive disorder. Int J Neuropsychopharmacol. 2010;13:217–27. doi: 10.1017/S1461145709990435. [DOI] [PubMed] [Google Scholar]
- 5.Isserles M, Shalev AY, Roth Y, et al. Effectiveness of deep transcranial magnetic stimulation combined with a brief exposure procedure in post-traumatic stress disorder –a pilot study. Brain Stimul. 2013;6:377–83. doi: 10.1016/j.brs.2012.07.008. [DOI] [PubMed] [Google Scholar]
- 6.Downar J, Sankar A, Giacobbe P, Woodside B, Colton P. Unanticipated rapid remission of refractory bulimia nervosa, during high-dose repetitive transcranial magnetic stimulation of the dorsomedial prefrontal cortex: a case report. Front Psychiatry. 2012;3:30. doi: 10.3389/fpsyt.2012.00030. [DOI] [PMC free article] [PubMed] [Google Scholar]
- 7.Van den Eynde F, Guillaume S, Broadbent H, Campbell IC, Schmidt U. Repetitive transcranial magnetic stimulation in anorexia nervosa: a pilot study. Eur Psychiatry. 2013;28:98–101. doi: 10.1016/j.eurpsy.2011.06.002. [DOI] [PubMed] [Google Scholar]
- 8.Pascual-Leone A, Rubio B, Pallardó F, Catalá M. Rapid-rate transcranial magnetic stimulation of left dorsolateral prefrontal cortex in drug-resistant depression. Lancet. 1996;348:233237. doi: 10.1016/s0140-6736(96)01219-6. [DOI] [PubMed] [Google Scholar]
- 9.Fitzgerald PB, Hoy K, Gunewardene R, et al. A randomized trial of unilateral and bilateral prefrontal cortex transcranial magnetic stimulation in treatment-resistant major depression. Psychol Med. 2011;41:1187–96. doi: 10.1017/S0033291710001923. [DOI] [PubMed] [Google Scholar]
- 10.O’Reardon J, Solvason H, Janicak P, et al. Efficacy and safety of transcranial magnetic stimulation in the acute treatment of major depression: a multisite randomized controlled trial. Biol Psychiatry. 2007;62:1208–16. doi: 10.1016/j.biopsych.2007.01.018. [DOI] [PubMed] [Google Scholar]
- 11.George M, Lisanby S, Avery D, et al. Daily left prefrontal transcranial magnetic stimulation therapy for major depressive disorder: a sham-controlled randomized trial. Arch Gen Psychiatry. 2010;67:507–16. doi: 10.1001/archgenpsychiatry.2010.46. [DOI] [PubMed] [Google Scholar]
- 12.Berlim MT, van den Eynde F, Tovar-Perdomo S, Daskalakis ZJ. Response, remission and drop-out rates following high-frequency repetitive transcranial magnetic stimulation (rTMS) for treating major depression: a systematic review and meta-analysis of randomized, double-blind and sham-controlled trials. Psychol Med. 2014;44:225–39. doi: 10.1017/S0033291713000512. [DOI] [PubMed] [Google Scholar]
- 13.Lam RW, Chan P, Wilkins-Ho M, Yatham LN. Repetitive transcranial magnetic stimulation for treatment-resistant depression: a systematic review and metaanalysis. Can J Psychiatry. 2008;53:621–31. doi: 10.1177/070674370805300909. [DOI] [PubMed] [Google Scholar]
- 14.Fox MD, Buckner RL, White MP, Greicius MD, Pascual-Leone A. Efficacy of transcranial magnetic stimulation targets for depression is related to intrinsic functional connectivity with the subgenual cingulate. Biol Psychiatry. 2012;72:595–603. doi: 10.1016/j.biopsych.2012.04.028. [DOI] [PMC free article] [PubMed] [Google Scholar]
- 15.Herbsman T, Avery D, Ramsey D, et al. More lateral and anterior prefrontal coil location is associated with better repetitive transcranial magnetic stimulation antidepressant response. Biol Psychiatry. 2009;66:509–15. doi: 10.1016/j.biopsych.2009.04.034. [DOI] [PubMed] [Google Scholar]
- 16.Downar J, Daskalakis ZJ. New targets for rTMS in depression: a review of convergent evidence. Brain Stimul. 2013;6:231–40. doi: 10.1016/j.brs.2012.08.006. [DOI] [PubMed] [Google Scholar]
- 17.Bakker N, Shahab S, Giacobbe P, et al. rTMS of the dorsomedial prefrontal cortex for major depression: safety, tolerability, effectiveness, and outcome predictors for 10 Hz versus intermittent theta-burst stimulation. Brain Stimul. 2015 Mar-Apr;8(2):208–15. doi: 10.1016/j.brs.2014.11.002. [DOI] [PubMed] [Google Scholar]
- 18.Schutter DJ, Laman DM, van Honk J, Vergouwen AC, Koerselman GF. Partial clinical response to 2 weeks of 2 Hz repetitive transcranial magnetic stimulation to the right parietal cortex in depression. Int J Neuropsychopharmacol. 2009;12:643–50. doi: 10.1017/S1461145708009553. [DOI] [PubMed] [Google Scholar]
- 19.Isenberg K, Downs D, Pierce K, et al. Low frequency rTMS stimulation of the right frontal cortex is as effective as high frequency rTMS stimulation of the left frontal cortex for antidepressant-free, treatment-resistant depressed patients. Ann Clin Psychiatry. 2005;17:153–9. doi: 10.1080/10401230591002110. [DOI] [PubMed] [Google Scholar]
- 20.Blumberger DM, Mulsant BH, Fitzgerald PB, et al. A randomized double-blind sham-controlled comparison of unilateral and bilateral repetitive transcranial magnetic stimulation for treatment-resistant major depression. World J Biol Psychiatry. 2012;13:423–35. doi: 10.3109/15622975.2011.579163. [DOI] [PubMed] [Google Scholar]
- 21.Berlim MT, Van den Eynde F, Daskalakis ZJ. A systematic review and meta-analysis on the efficacy and acceptability of bilateral repetitive transcranial magnetic stimulation (rTMS) for treating major depression. Psychol Med. 2013;43:2245–54. doi: 10.1017/S0033291712002802. [DOI] [PubMed] [Google Scholar]
- 22.Ahmed MA, Darwish ES, Khedr EM, El Serogy YM, Ali AM. Effects of low versus high frequencies of repetitive transcranial magnetic stimulation on cognitive function and cortical excitability in Alzheimer’s dementia. J Neurol. 2012;259:83–92. doi: 10.1007/s00415-011-6128-4. [DOI] [PubMed] [Google Scholar]
- 23.Lee SJ, Kim DY, Chun MH, Kim YG. The effect of repetitive transcranial magnetic stimulation on fibromyalgia: a randomized sham-controlled trial with 1-mo follow-up. Am J Phys Med Rehabil. 2012;91:1077–85. doi: 10.1097/PHM.0b013e3182745a04. [DOI] [PubMed] [Google Scholar]
- 24.Karsen EF, Watts BV, Holtzheimer PE. Review of the effectiveness of transcranial magnetic stimulation for post-traumatic stress disorder. Brain Stimul. 2014;7:151–7. doi: 10.1016/j.brs.2013.10.006. [DOI] [PubMed] [Google Scholar]
- 25.Sachdev P, Loo C, Mitchell P, McFarquhar T, Malhi G. Repetitive transcranial magnetic stimulation for the treatment of obsessive compulsive disorder: a double-blind controlled investigation. Psychol Med. 2007;37:1645–9. doi: 10.1017/S0033291707001092. [DOI] [PubMed] [Google Scholar]
- 26.Höppner J, Broese T, Wendler L, Berger C, Thome J. Repetitive transcranial magnetic stimulation (rTMS) for treatment of alcohol dependence. World J Biol Psychiatry. 2011;12(Suppl 1):57–62. doi: 10.3109/15622975.2011.598383. [DOI] [PubMed] [Google Scholar]
- 27.Herwig U, Padberg F, Unger J, Spitzer M, Schönfeldt-Lecuona C. Transcranial magnetic stimulation in therapy studies: examination of the reliability of “standard” coil positioning by neuronavigation. Biol Psychiatry. 2001;50:58–61. doi: 10.1016/s0006-3223(01)01153-2. [DOI] [PubMed] [Google Scholar]
- 28.Ahdab R, Ayache SS, Brugières P, Goujon C, Lefaucheur J-PP. Comparison of “standard” and “navigated” procedures of TMS coil positioning over motor, premotor and prefrontal targets in patients with chronic pain and depression. Neurophysiol Clin. 2010;40:27–36. doi: 10.1016/j.neucli.2010.01.001. [DOI] [PubMed] [Google Scholar]
- 29.Bradfield N, Reutens D, Chen J, Wood A. Stereotaxic localisation of the dorsolateral prefrontal cortex for transcranial magnetic stimulation is superior to the standard reference position. Aust N Z J Psychiatry. 2012;46:232–9. doi: 10.1177/0004867411430602. [DOI] [PubMed] [Google Scholar]
- 30.Fitzgerald PB, Hoy K, McQueen S, et al. A randomized trial of rTMS targeted with MRI based neuronavigation in treatment-resistant depression. Neuropsychopharmacology. 2009;34:1255–62. doi: 10.1038/npp.2008.233. [DOI] [PubMed] [Google Scholar]
- 31.Herwig U, Satrapi P, Schönfeldt-Lecuona C. Using the international 10–20 EEG system for positioning of transcranial magnetic stimulation. Brain Topogr. 2003;16:95–9. doi: 10.1023/b:brat.0000006333.93597.9d. [DOI] [PubMed] [Google Scholar]
- 32.Guse B, Falkai P, Gruber O, et al. The effect of long-term high frequency repetitive transcranial magnetic stimulation on working memory in schizophrenia and healthy controls –a randomized placebo-controlled, double-blind fMRI study. Behav Brain Res. 2013;237:300–7. doi: 10.1016/j.bbr.2012.09.034. [DOI] [PubMed] [Google Scholar]
- 33.Beam W, Borckardt J, Reeves S, George M. An efficient and accurate new method for locating the F3 position for prefrontal TMS applications. Brain Stimul. 2009;2:50–4. doi: 10.1016/j.brs.2008.09.006. [DOI] [PMC free article] [PubMed] [Google Scholar]
- 34.Rusjan PM, Barr MS, Farzan F, et al. Optimal transcranial magnetic stimulation coil placement for targeting the dorsolateral prefrontal cortex using novel magnetic resonance image-guided neuronavigation. Hum Brain Mapp. 2010;31:1643–52. doi: 10.1002/hbm.20964. [DOI] [PMC free article] [PubMed] [Google Scholar]
- 35.Fried P, Rushmore R, Moss M, Valero-Cabré A, Pascual-Leone A. Causal evidence supporting functional dissociation of verbal and spatial working memory in the human dorsolateral prefrontal cortex. Eur J Neurosci. 2014;39:1973–81. doi: 10.1111/ejn.12584. [DOI] [PMC free article] [PubMed] [Google Scholar]
- 36.Petrides M. Lateral prefrontal cortex: architectonic and functional organization. Philos Trans R Soc Lond B Biol Sci. 2005;360:781–95. doi: 10.1098/rstb.2005.1631. [DOI] [PMC free article] [PubMed] [Google Scholar]
- 37.Petrides M, Pandya DN. Dorsolateral prefrontal cortex: comparative cytoarchitectonic analysis in the human and the macaque brain and cortico-cortical connection patterns. Eur J Neurosci. 1999;11:1011–36. doi: 10.1046/j.1460-9568.1999.00518.x. [DOI] [PubMed] [Google Scholar]
- 38.Pandya DN, Yeterian EH. Comparison of prefrontal architecture and connections. Philos Trans R Soc Lond B Biol Sci. 1996;351:1423–32. doi: 10.1098/rstb.1996.0127. [DOI] [PubMed] [Google Scholar]
- 39.Lozano A, Mayberg H, Giacobbe P, Hamani C, Craddock R, Kennedy S. Sub-callosal cingulate gyrus deep brain stimulation for treatment-resistant depression. Biol Psychiatry. 2008;64:461–7. doi: 10.1016/j.biopsych.2008.05.034. [DOI] [PubMed] [Google Scholar]
- 40.Nemeroff CB. Prevalence and management of treatment-resistant depression. J Clin Psychiatry. 2007;68(Suppl 8):17–25. [PubMed] [Google Scholar]
- 41.Lipsman N, Sankar T, Downar J, Kennedy SH, Lozano AM, Giacobbe P. Neuromodulation for treatment-refractory major depressive disorder. CMAJ. 2014;186:33–9. doi: 10.1503/cmaj.121317. [DOI] [PMC free article] [PubMed] [Google Scholar]
- 42.Fitzgerald P, McQueen S, Herring S, et al. A study of the effectiveness of high-frequency left prefrontal cortex transcranial magnetic stimulation in major depression in patients who have not responded to right-sided stimulation. Psychiatry Res. 2009;169:12–5. doi: 10.1016/j.psychres.2008.06.017. [DOI] [PubMed] [Google Scholar]
- 43.Rajkowska G, Goldman-Rakic PS. Cytoarchitectonic definition of prefrontal areas in the normal human cortex: II. Variability in locations of areas 9 and 46 and relationship to the Talairach Coordinate System. Cereb Cortex. 1995;5:323–37. doi: 10.1093/cercor/5.4.323. [DOI] [PubMed] [Google Scholar]
- 44.Fox MD, Liu H, Pascual-Leone A. Identification of reproducible individualized targets for treatment of depression with TMS based on intrinsic connectivity. Neuroimage. 2013;66:151–60. doi: 10.1016/j.neuroimage.2012.10.082. [DOI] [PMC free article] [PubMed] [Google Scholar]
- 45.Sack AT, Cohen Kadosh R, Schuhmann T, Moerel M, Walsh V, Goebel R. Optimizing functional accuracy of TMS in cognitive studies: a comparison of methods. J Cogn Neurosci. 2009;21:207–21. doi: 10.1162/jocn.2009.21126. [DOI] [PubMed] [Google Scholar]
- 46.Mueller S, Wang D, Fox MD, et al. Individual variability in functional connectivity architecture of the human brain. Neuron. 2013;77:586–95. doi: 10.1016/j.neuron.2012.12.028. [DOI] [PMC free article] [PubMed] [Google Scholar]
- 47.Speer A, Benson B, Kimbrell T, et al. Opposite effects of high and low frequency rTMS on mood in depressed patients: relationship to baseline cerebral activity on PET. J Affect Disord. 2009;115:386–94. doi: 10.1016/j.jad.2008.10.006. [DOI] [PMC free article] [PubMed] [Google Scholar]
- 48.Paillère Martinot ML, Galinowski A, Ringuenet D, et al. Influence of prefrontal target region on the efficacy of repetitive transcranial magnetic stimulation in patients with medication-resistant depression: a [(18)F]-fluorodeoxyglucose PET and MRI study. Int J Neuropsychopharmacol. 2010;13:45–59. doi: 10.1017/S146114570900008X. [DOI] [PubMed] [Google Scholar]