

Abstract
The efficacy of biological therapies on intervertebral disc repair was quantitatively studied using a three-dimensional finite element model based on a cell-activity coupled multiphasic mixture theory. In this model, cell metabolism and matrix synthesis and degradation were considered. Three types of biological therapies-increasing the cell density (Case I), increasing the glycosaminoglycan (GAG) synthesis rate (Case II), and decreasing the GAG degradation rate (Case III)-to the nucleus pulposus (NP) of each of two degenerated discs [one mildly degenerated (e.g., 80% viable cells in the NP) and one severely degenerated (e.g., 30% viable cells in the NP)] were simulated. Degenerated discs without treatment were also simulated as a control. The cell number needed, nutrition level demanded, time required for the repair, and the long-term outcomes of these therapies were analyzed. For Case I, the repair process was predicted to be dependent on the cell density implanted and the nutrition level at disc boundaries. With sufficient nutrition supply, this method was predicted to be effective for treating both mildly and severely degenerated discs. For Case II, the therapy was predicted to be effective for repairing the mildly degenerated disc, but not for the severely degenerated disc. Similar results were predicted for Case III. No change in cell density for Cases II and III were predicted under normal nutrition level. This study provides a quantitative guide for choosing proper strategies of biological therapies for different degenerated discs.
Keywords: disc repair, finite element model, biomechanics
Introduction
Low back pain is a prevalent health problem which affects more than 600 million people worldwide.1-3 The cause of the low back pain is still not definitive, however, the intervertebral disc (IVD) degeneration is strongly associated with it.4; 5 IVD degeneration is generally described as a cascade of progressive changes in biological, chemical, electrical, and mechanical events, which eventually leads to disc failure.4; 6-11 Traditional treatment methods for IVD degeneration involve conservative treatments (e.g., physiotherapy, core strengthening and other exercise modalities) and surgical interventions (such as spinal fusion or prosthetic disc replacement).7 Although these treatments alleviate some symptoms, they cannot stop the degenerative progression, nor restore the structure or function of the IVD.7 The long-term efficacy of these treatments is not promising either, as many treated patients experience recurrent pain, reduced spinal mobility, and/or adjacent segment degeneration.7 New therapies aiming to halt and/or regenerate the IVD degeneration are of crucial significance in treating the IVD degeneration-related spinal disorders. Regenerative therapies such as the biological therapy have been intensively studied in recent years. The idea of the biological therapy is to restore disc structure and function through implanting functional cells, stimulating the matrix synthesis, and/or inhibiting the matrix degradation activities in the disc.12; 13
Cell implantation has been applied to a few clinical trials (a detailed review can be found in Benneker et al13 and Sakai and Andersson12). These clinical trials showed positive treatment outcomes; including increases in tissue water content and disc height in the patients under therapy,14-18 except one study in which no improvement in pain relief after one-year follow-up was reported.19 These studies showed a great potential of the cell therapy in retarding and/or reversing disc degeneration. Nonetheless, many critical issues in relation to the therapies are unaddressed, such as the number of cells needed, the time required for repair, the nutrients demanded by the implanted cells, and the long-term (such as 5, 10, or more years) efficacy of biological therapies. These issues are challenging and costly to address experimentally. Numerical simulations are an alternative means to investigate the process of disc degeneration or regeneration quantitatively and can provide insights into the complicated biological, chemical, electrical, and mechanical events in discs under pathophysiological conditions, which might be difficult to measure directly or simultaneously. Recently, a numerical model for human discs has been developed based on the finite element method and cell-activity-coupled mechano-electrochemical theory.20; 21 This model can be used to predict not only the distributions of cell density, water content, glycosaminoglycan (GAG) content, glucose concentration, oxygen concentration, lactate concentration, pH value, mechanical stresses and strains in the disc, but also the variations of disc height, GAG content, and water content with the progression of disc degeneration.20-22 This model is unique in the sense that not only the transport of nutrients and metabolic wastes as well as fluid flow are coupled with tissue deformation (or hydration), but also the tissue deformation, GAG content, and water content are coupled with cell density.20-22 This model was validated by simulating the degenerative progression in the IVD with initial GAG and water distributions from a 27-year old healthy lumbar disc.20; 23 The predicted distributions of GAG and water contents in the disc with reduced nutrition supply for 27 years (i.e., at age of 54 years) were calculated and compared with the experimental data measured in human cadaveric discs of average age of 54 years, reported in the literature.24 It was found that the model predictions were consistent with the results in the literature.20
In this study, we attempt to use this model to numerically investigate the repair processes in the degenerated discs treated with biological therapies and to analyze the long-term efficacy of these therapies.
Methods
The details of the finite element model for human lumbar discs used in the current study can be found in our previous studies.20-22 Briefly, the model took into account the cell viability and metabolism, transport of interstitial fluid, ions, glucose, oxygen and lactate, GAG synthesis/degradation, tissue swelling, and mechanical stresses and strains in the disc. The coupling of transport properties of fluid and solutes with tissue deformation (or hydration) was considered. The cell viability was assumed to depend on the local glucose concentration only and the cells were assumed not to proliferate in the disc. The cell metabolisms (consumptions of glucose and oxygen, and production of lactate) were related to local glucose, oxygen, and lactate (or pH value) concentrations in the tissue according to Bibby et al.25 The rate of GAG content change (QGAG) was related to the GAG synthesis rate (Qsyn) and the GAG degradation rate (Qdeg) by: QGAG = Qsyn - Qdeg, where Qsyn was a function of local cell density (ρGAG) with Qsyn = λ1 ρcell, and Qdeg was assumed to be proportional to the value of local GAG content (CGAG) by Qdeg = λ2 CGAG. In the current study, the value for GAG synthesis rate per cell (i.e., λ1) was assumed to be an invariant with time (its value may vary from region to region20) and it does not directly correlated with the cell metabolism. The value of λ1 at the healthy state was used in this study,20 see below. The value of λ2 was assumed to be constant, and calculated from the half-life time of GAG turnover in the disc.20; 26 More information on the model can be found in Table 1.
Table 1.
List of Variables and Assumptions used in the Model
| Constituent | Variable | Diffusion/ Convection* |
Bio- reaction |
Comment |
|---|---|---|---|---|
| Solid matrix | Displacement vector |
No | No (excluding proteoglycan) |
Deformation is coupled with swelling pressure (or fixed charge density) and fluid flow.42; 43 |
| Cell | Cell density | No | Yes | Cells start to die when local glucose concentration is below the threshold (0.5 mM).44 No proliferation is assumed. Cells are fixed to solid matrix. |
| Proteoglycan (GAG) |
GAG content | No | Yes | It depends on cell density, GAG synthesis rate per cell, and GAG degradation rate. GAG content is assumed to be proportional to fixed charge density.20 Proteoglycan is part of solid matrix. |
| Water | Chemical potential of water |
Yes | No | Hydraulic permeability is tissue deformation (or hydration) dependent.45 |
| Cation (Na+) | Electrochemical potential of cation |
Yes | See comment |
Its concentration depends on GAG content (or fixed charge density).20 Diffusivity is tissue deformation (or hydration) dependent.46 |
| Anion (Cl−) | Electrochemical potential of anion |
Yes | See comment |
Its concentration depends on GAG content (or fixed charge density).20 Its Diffusivity is tissue deformation (or hydration) dependent.46 |
| Glucose | Chemical potential of glucose |
Yes | Yes | The rate of consumption by cells is a function of local glucose and oxygen concentrations and pH.25 Its diffusivity is tissue deformation (or hydration) dependent.46 |
| Oxygen | Chemical potential of oxygen |
Yes | Yes | The rate of consumption by cells is a function of local oxygen concentration and pH.25 Its diffusivity is tissue deformation (or hydration) dependent.46 |
| Lactate | Chemical potential of lactate |
Yes | Yes | The rate of production by cells is a function of local glucose and oxygen concentrations and pH.25 Its concentration is related to pH value.25 Its diffusivity is tissue deformation (or hydration) dependent.46 |
All fluxes are relative to solid matrix
The geometry of the disc was generated based on a human L2-3 disc27 (see Fig. 1A). Two regions were considered: nucleus pulposus (NP) and annulus fibrosus (AF). The effect of cartilage endplate (CEP) on nutrition supply was considered by adjusting the boundary conditions at the interface between NP and CEP.22 Due to symmetry, only the upper-right quarter of the disc was simulated (Fig. 1B). The mesh contained 7888 hexahedral elements. The finite element model was developed with COMSOL software (COMSOL 4.3b, COMSOL, Inc., MA). The MUMPS direct solver was used.
Figure 1.
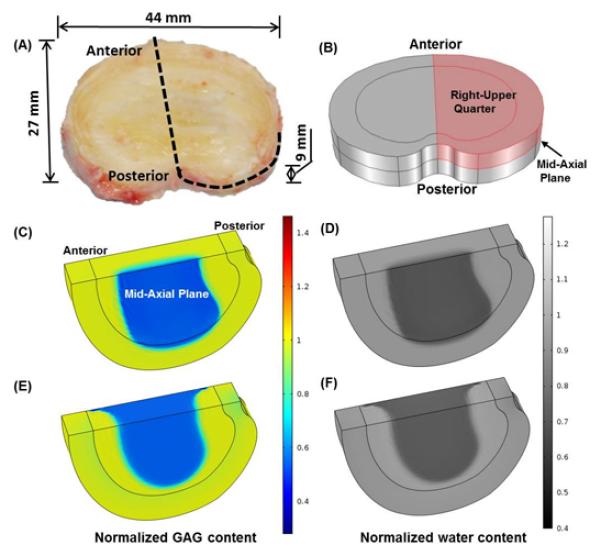
(A) A picture of a human lumbar disc (L2-3, male, non-degenerated).27 (B) The upper-right quarter of the disc for simulation. (C) GAG content and (D) water content distributions in the mildly degenerated disc before treatment. (E) GAG content and (F) water content distributions in the severely degenerated disc before treatment. All the values are normalized to that at the healthy state.
In this study, three types of biological therapies were simulated: Case I - increasing cell density, Case II - increasing GAG synthesis rate, and Case III - decreasing GAG degradation rate. Two degenerative discs were treated with each of the three types of therapies; one was a mildly degenerated disc (20% loss in cell number, 7% decrease in GAG content, 5% decrease in water content in the NP, and 2.2% decrease in disc height, see Figs. 1C and D. All are relative to the healthy state), and the other was a severely degenerated disc (70% loss in cell number, 30% decrease in GAG content, 15% decrease in water content in the NP, and 8% decrease in disc height, Figs. 1E and F). Examples for the distributions of cell density, oxygen concentration, glucose concentration, lactate concentration, and mechanical stresses in the degenerated discs may be found in our previous papers.20; 22
Only the NP region of the discs was treated, as the NP undergoes major compositional and morphological changes with disc degeneration. For Case I, three cell density values (4000 cells/mm3, 8000 cells/mm3, and 12000 cells/mm3) were investigated. In Case II, the GAG synthesis rate (i.e., λ1) in the NP was increased by 100% (from 0.911×10⁻⁵ mmol/g dry weight/hr to 1.822×10⁻⁵ mmol/g dry weight/hr). In Case III, the relative GAG degradation rate in the NP (i.e., the value of λ2) was decreased by 50%, i.e., 1.997×10⁻⁹/s to 0.9986×10⁻⁹/s.20 For comparison, a control case (without treatment) was also simulated.
Effects of the nutrition supply on the therapy outcomes were also studied by adjusting the nutrition (i.e., glucose, oxygen) level at disc boundaries. Glucose and oxygen concentrations on the IVD boundary at the healthy state were set as: 3.2 mM, and 3.6 kPa on the NP surface adjacent to the endplate; 5.0 mM and 5.8 kPa on the AF periphery.20; 22; 28 These values were defined as the normal nutrition level on IVD boundaries. Therapies at various nutrition levels at the NP surface (0%, 15%, 30%, 50%, and 100% of the normal nutrition level mentioned above), while nutrition level at the AF boundary remained the same as normal nutrition level, were simulated in the severely degenerated discs for Case I. For Cases II and III, the normal nutrition level at the disc boundary was used.
More information on the distributions of the cell density, glucose concentration, oxygen tension, lactate concentration, pH value, and mechanical signals in the degenerated disc, as well as on the material properties and mechanical boundary conditions can be found in our previous publications.20; 22 Results related to changes in GAG content, water content, and disc height were presented.
RESULTS
Treatments with increasing cell density in the NP (Case I)
The treatment outcomes were predicted to be cell density dependent. The higher the cell density, the more rapid the repair process would occur. For example, in the severely degenerated disc after treatments with a cell density of 12000 cells/mm3 and 8000 cells/mm3, the normalized GAG content (averaged over the NP) increased from the initial value of 70.0% to 100% (i.e., the value at healthy state) in 2.57 years and 4.56 years, respectively; the normalized water content (averaged over the NP) elevated from the initial value of 85% to 100% (i.e., the value at healthy state) in 2.44 years and 4.29 years, respectively; and disc height returned (from the initial value of 91.9%) to 100% (i.e., the value at healthy state) in 2.4 years and 4.3 years, respectively, see Figs. 2, 3 and 4. In contrast, the repair process was much slower for the same disc treated with a cell density of 4000 cells/mm3. The GAG content, water content, and disc height returned to 84.3%, 92.5%, and 96.2% of the corresponding values at healthy state, respectively, at the end of 10 years, see Fig. 4.
Figure 2.

Comparisons of GAG content (normalized to that at the healthy state) in the severely degenerated disc treated with various cell densities in Case I: (A) 4000 cells/mm3, (B) 8000 cells/mm3, and (C) 12000 cells/mm3. The treatment is under normal nutrition level at the disc boundary.
Figure 3.

Comparisons of water content (normalized to that at the healthy state) in the severely degenerated disc treated with various cell densities in Case I: (A) 4000 cells/mm3, (B) 8000 cells/mm3, and (C) 12000 cells/mm3. The treatment is under normal nutrition level at the disc boundary.
Figure 4.
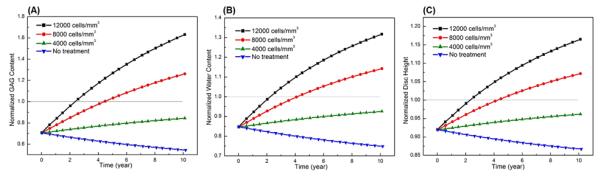
Comparisons of treatment outcomes in the severely degenerated disc treated with various cell densities in Case I: (A) GAG content, (B) water content, and (C) disc height. The treatment is under normal nutrition level at the disc boundary. Values in (A) and (B) are averaged over NP.
The treatment outcomes were also predicted to be nutrition level dependent, see Fig. 5. A critical nutrition level (defined as the minimum nutrition level at the NP-CEP boundary) to maintain the viability of all the cells within the treated NP were determined (Fig. 6). It was found that the higher the cell density is used for the treatment, the higher the critical nutrition level is required.
Figure 5.

Comparisons of treatment outcomes in the severely degenerated disc treated with a cell density of 8000 cells/mm3 in Case I between normal nutrition level and lower nutrition level (e.g., 1.6 mM for glucose, and 1.8 kPa for oxygen on the NP surface, while normal level remains on AF periphery): (A-B) GAG content, (C-D) water content.
Figure 6.

The critical nutrition level (minimum level of glucose at the NP surface for cell survival) versus the cell density in the NP in severely degenerated disc treated with various cell densities in Case I.
Treatment with a 100% increase in the GAG synthesis rate in the NP (Case II)
The treatment outcomes were dependent on the disc degeneration stage. For the mildly degenerated disc, it was predicted that overall GAG and water contents increased (Figs. 7A, B, E and F), and disc height returned back to the value at healthy state (i.e., 100%) after 1.88 years (Fig. 7G). For the severally degenerated disc, however, it was predicted that there was no significant improvement in the GAG content (Figs. 7C and E) or water content (Figs. 7D and F) in the NP. The normalized GAG content (averaged over the NP) elevated slightly (from initially 70.0% to 71.6%) after 10 years of treatment (Fig. 7E). The normalized water content (averaged over the NP) and the disc height continued to decrease with time following the treatment (Figs. 7F and G). It was predicted that normal nutrition level at the disc boundary was sufficient for this treatment, and there was no change in cell density in the disc.
Figure 7.

Comparison of treatment outcomes between mildly and severely degenerated discs and between non-treated (control) and treated discs in Case II (i.e., increasing GAG synthesis rate in the NP): spatial distributions of GAG content (A, C) and water content (B, D), and temporal variations of GAG content (E), water content (F), and disc height (G). The treatment is under normal nutrition level at the disc boundary. All the values are normalized to that at the healthy state. Values in (E) and (F) are averaged over NP.
Treatment with a 50% decrease in the GAG degradation rate in the NP (Case III)
It was predicted that the outcomes of this therapy were similar to those in Case II. After treatment, the GAG content (Figs. 8A, I) and water content (Figs. 8E, J) in the NP as well as the disc height (Fig. 8K) increased in the mildly degenerated disc, but not in the severely degenerated disc (Figs. 8C, G-K).
Figure 8.

Comparison of treatment outcomes between mildly and severely degenerated discs and between non-treated (control) and treaded discs in Case III (decreasing GAG degradation rate in the NP): spatial distributions of GAG content (A-D) and water content (E-H) after 5 year, and temporal variations of GAG content (I), water content (J), and disc height (K). The treatment is under normal nutrition level at the disc boundary. All the values are normalized to that at the healthy state. Values in (I) and (J) are averaged over NP.
Discussion
Three types of biological therapies for disc repair were simulated in this study. The predicted results indicate that therapy with increasing cell density in the NP (i.e., Case I) is effective for both mildly and severely degenerated discs. Our simulated results for water content and disc height in Case I are qualitatively consistent with those reported in the clinical trials and in an animal model treated with cell implantation.14-19; 29; 30
For instance, intervertebral disc repair using autologous chondrocyte transplantation has been investigated in a dog model for up to 12 months.30 Results from this study indicate that cell implantation improves disc height retention and leads to increased matrix components.30 Similar studies have also been conducted in human intervertebral discs.14; 18; 29 For example, one study showed that fluid content in the treated group of human patients was considerably higher than that in the control group at a 2-year follow-up.14
Note that this therapy requires higher nutrition supply to the disc in order for the newly implanted cells to function. The level of nutrition supply to the disc in this therapy depends on the number of implanted cells. When treating discs with implanting a large number of cells, or discs with poor nutrition supply from the nearby blood vessels, it is crucial to improve the nutrition condition within the disc for successful treatment outcomes.
Our analysis indicates that the therapies with a cell density of 4000 and 8000 cells/mm3 in the NP (Case I) do not exceed the nutrition supply when the normal nutrition level is applied on disc boundaries (Fig. 6). In the therapy with a cell density of 12000 cells/mm3, however, there is a small amount of cell death in a tiny region (0.34% of total NP volume) near the NP center (Fig. 6). Cell density in the NP is dependent primarily on the glucose concentration at the boundary, glucose diffusivity, glucose consumption rate per cell, and disc thickness.31 Using the approach by Maroudas et al (1975),31 we have re-derived their Equation 2 in Appendix of their paper (there were a few typos in their original equation) and used it to estimate cell density in the NP. Assuming the glucose consumption rate was 5×10⁻¹¹ mmol/cell/hour,31 one could estimate the maximum cell density in the NP in the disc (with 9 mm thickness) being ~15,000 cells/mm3 for a glucose diffusivity of 5.2×10⁻⁶ cm2/s, an average value for NP used in our study. Note that the glucose diffusivity in water at 37 °C is around 9.4 ×10⁻¹⁰ m2/s,32 the value of glucose diffusivity for NP used in our study reflects 55% of the value in the water, which is consistent with the values in cartilaginous tissues reported in the literature.31; 33; 34
Degenerative progression in the discs with reduced nutrition supply is a very slow process.35 For example, our previous analysis indicated that a 5% decrease in water content in the NP would take about 10 years.20 This is because matrix turnover is very slow.26 In adults, disc height and volume do not increase with time, indicating the GAG synthesis rate (per cell) is also slow in order to balance the slow rate of GAG degradation. This is why the repairing process in the disc with implanting normal cell density (i.e., 4000 cells/mm3) takes a long period of time (Figs. 2, 3, and 4).
In the current study, the implanted cells for Case I were assumed to have the same properties as those for adult human NP cells. Disc repair with implanting different types of cells can also be simulated if information on these cells (e.g., nutrient threshold for cell viability, cell metabolism, and GAG synthesis rate) is available.
Therapies with increasing the GAG synthesis rate (Case II) and decreasing the GAG degradation rate (Case III) are predicted to be effective primarily for mildly degenerated discs, and not effective for severely degenerated disc. This may be because the number of viable cells in the NP of the severely degenerated disc is low, e.g., only 30% of the normal value (compared to 80% in the mildly degenerated disc simulated). The amount of GAG synthesized by the viable cells could not exceed the amount of GAG breakdown in this simulated disc, even though the GAG synthesis rate (per cell) for the remaining cells in the NP is doubled (Case II), or the GAG degradation rate is reduced by half (Case III), thus resulting in no improvement in GAG content or water content or disc height within the treated disc. Thus, the number of viable cells in degenerated discs is crucial for the success of therapies in Case II and Case III.
One of the differences between Case II and Case III is the demand of nutrients for the synthesis of GAG; that is, more nutrients are expected for the therapy in Case II than in Case III because of the increase in GAG synthesis rate in Case II. From this point of view, the therapy with decreasing GAG degradation rate (Case III) may be more attractive for the mildly degenerated discs, especially for the degenerated discs with a deficiency in nutrition supply.
Nutrition supply is also important for the therapy in Case II (i.e., increasing the GAG synthesis rate). In this study, the GAG synthesis rate by the cells is not directly correlated with the cell metabolism. This is a limitation of the current study. However, this limitation may not have significant influences on the results in this work because the total nutrition supply to the disc is sufficient to maintain the elevated cellular synthetic activities. In our model, the total influx of the glucose into the disc from all the boundaries at the mildly degenerated disc in Case II (i.e., 7.0×10⁻¹⁰ mmol/s) is about 90 times larger than the rate of glucose required for the synthesis of disaccharide units of GAG (7.4×10⁻¹² mmol/s), assuming two glucose molecules are required to synthesize one disaccharide unit of a GAG molecule.36
Another limitation of this study is that the GAG synthesis rate per cell in the NP is assumed to be constant during the repair process. This assumption leaded to the overestimate of the GAG and water contents as well as the disc height in all three types of therapies (Figs. 4, 6, and 7) because the GAG synthesis rate (per cell) would decrease when the cell volume (or cellular environment) deviates from its optimal value.37-41 The third limitation is that the intrinsic mechanical properties of the matrix (Lame constants λ and μ) were assumed to be constant during degeneration or repair processes (did not change with tissue compositional changes). This assumption would have an effect on the estimation of tissue height change. These issues will be considered in our future studies.
In conclusion, this study has simulated and predicted the effects of three types of biological therapies for disc repair using a finite element method. The predicted results indicate that while all three types of therapies are effective for mildly degenerated discs, only the therapy with increasing cell density is effective for severely degenerated discs. This study provides not only additional insights into disc degeneration and repair processes, but also a quantitative guide for choosing proper treatment strategies for disc repair.
Acknowledgement
This study was supported in part by a research grant from the NIH (AR066240).
Footnotes
Author Contributions Statement: W.G. designed research, Q.Z. and X.G. performed research, H.T.T. and M.D.B. contributed to the research, and all authors reviewed and approved the paper.
There is no conflict of interest.
References
- 1.Hoy D, March L, Brooks P, et al. The global burden of low back pain: estimates from the Global Burden of Disease 2010 study. Ann Rheum Dis. 2014;73:968–974. doi: 10.1136/annrheumdis-2013-204428. [DOI] [PubMed] [Google Scholar]
- 2.Vos T, Flaxman AD, Naghavi M, et al. Years lived with disability (YLDs) for 1160 sequelae of 289 diseases and injuries 1990-2010: a systematic analysis for the Global Burden of Disease Study 2010. Lancet. 2012;380:2163–2196. doi: 10.1016/S0140-6736(12)61729-2. [DOI] [PMC free article] [PubMed] [Google Scholar]
- 3.Hoy D, Bain C, Williams G, et al. A systematic review of the global prevalence of low back pain. Arthritis Rheum. 2012;64:2028–2037. doi: 10.1002/art.34347. [DOI] [PubMed] [Google Scholar]
- 4.Freemont AJ. The cellular pathobiology of the degenerate intervertebral disc and discogenic back pain. Rheumatology. 2009;48:5–10. doi: 10.1093/rheumatology/ken396. [DOI] [PubMed] [Google Scholar]
- 5.Bogduk N. The lumbar disc and low back pain. Neurosurg Clin N Am. 1991;2:791–806. [PubMed] [Google Scholar]
- 6.Iatridis JC, Nicoll SB, Michalek AJ, et al. Role of biomechanics in intervertebral disc degeneration and regenerative therapies: what needs repairing in the disc and what are promising biomaterials for its repair? Spine J. 2013;13:243–262. doi: 10.1016/j.spinee.2012.12.002. [DOI] [PMC free article] [PubMed] [Google Scholar]
- 7.Smith LJ, Nerurkar NL, Choi KS, et al. Degeneration and regeneration of the intervertebral disc: lessons from development. Dis Model Mech. 2011;4:31–41. doi: 10.1242/dmm.006403. [DOI] [PMC free article] [PubMed] [Google Scholar]
- 8.Adams MA, Roughley PJ. What is intervertebral disc degeneration, and what causes it? Spine. 2006;31:2151–2161. doi: 10.1097/01.brs.0000231761.73859.2c. [DOI] [PubMed] [Google Scholar]
- 9.Urban JP, Smith S, Fairbank JC. Nutrition of the intervertebral disc. Spine. 2004;29:2700–2709. doi: 10.1097/01.brs.0000146499.97948.52. [DOI] [PubMed] [Google Scholar]
- 10.Setton LA, Chen J. Cell mechanics and mechanobiology in the intervertebral disc. Spine. 2004;29:2710–2723. doi: 10.1097/01.brs.0000146050.57722.2a. [DOI] [PubMed] [Google Scholar]
- 11.Urban JP, Roberts S. Degeneration of the intervertebral disc. Arthritis Res Ther. 2003;5:120–130. doi: 10.1186/ar629. [DOI] [PMC free article] [PubMed] [Google Scholar]
- 12.Sakai D, Andersson GB. Stem cell therapy for intervertebral disc regeneration: obstacles and solutions. Nat Rev Rheumatol. 2015;11:243–256. doi: 10.1038/nrrheum.2015.13. [DOI] [PubMed] [Google Scholar]
- 13.Benneker LM, Andersson G, Iatridis JC, et al. Cell therapy for intervertebral disc repair: advancing cell therapy from bench to clinics. Eur Cell Mater. 2014;27:5–11. doi: 10.22203/ecm.v027sa02. [DOI] [PMC free article] [PubMed] [Google Scholar]
- 14.Meisel HJ, Ganey T, Hutton WC, et al. Clinical experience in cell-based therapeutics: intervention and outcome. Eur Spine J. 2006;15(Suppl 3):397–405. doi: 10.1007/s00586-006-0169-x. [DOI] [PMC free article] [PubMed] [Google Scholar]
- 15.Hohaus C, Ganey TM, Minkus Y, et al. Cell transplantation in lumbar spine disc degeneration disease. Eur Spine J. 2008;17(Suppl 4):492–503. doi: 10.1007/s00586-008-0750-6. [DOI] [PMC free article] [PubMed] [Google Scholar]
- 16.Yoshikawa T, Ueda Y, Miyazaki K, et al. Disc Regeneration Therapy Using Marrow Mesenchymal Cell Transplantation A Report of Two Case Studies. Spine. 2010;35:E475–E480. doi: 10.1097/BRS.0b013e3181cd2cf4. [DOI] [PubMed] [Google Scholar]
- 17.Orozco L, Soler R, Morera C, et al. Intervertebral disc repair by autologous mesenchymal bone marrow cells: a pilot study. Transplantation. 2011;92:822–828. doi: 10.1097/TP.0b013e3182298a15. [DOI] [PubMed] [Google Scholar]
- 18.Coric D, Pettine K, Sumich A, et al. Prospective study of disc repair with allogeneic chondrocytes presented at the 2012 Joint Spine Section Meeting. J Neurosurg Spine. 2013;18:85–95. doi: 10.3171/2012.10.SPINE12512. [DOI] [PubMed] [Google Scholar]
- 19.Haufe SM, Mork AR. Intradiscal injection of hematopoietic stem cells in an attempt to rejuvenate the intervertebral discs. Stem Cells Dev. 2006;15:136–137. doi: 10.1089/scd.2006.15.136. [DOI] [PubMed] [Google Scholar]
- 20.Gu WY, Zhu Q, Gao X, et al. Simulation of the Progression of Intervertebral Disc Degeneration Due to Decreased Nutritional Supply. Spine. 2014;39:E1411–E1417. doi: 10.1097/BRS.0000000000000560. [DOI] [PMC free article] [PubMed] [Google Scholar]
- 21.Zhu Q, Jackson AR, Gu WY. Cell viability in intervertebral disc under various nutritional and dynamic loading conditions: 3d finite element analysis. J Biomech. 2012;45:2769–2777. doi: 10.1016/j.jbiomech.2012.08.044. [DOI] [PMC free article] [PubMed] [Google Scholar]
- 22.Zhu Q, Gao X, Gu W. Temporal changes of mechanical signals and extracellular composition in human intervertebral disc during degenerative progression. J Biomech. 2014;47:3734–3743. doi: 10.1016/j.jbiomech.2014.09.004. [DOI] [PMC free article] [PubMed] [Google Scholar]
- 23.Urban JPG, Maroudas A. The measurement of fixed charge density in the intervertebral disc. Biochim Biophys Acta. 1979;586:166–178. [Google Scholar]
- 24.Iatridis JC, MacLean JJ, O'Brien M, et al. Measurements of proteoglycan and water content distribution in human lumbar intervertebral discs. Spine. 2007;32:1493–1497. doi: 10.1097/BRS.0b013e318067dd3f. [DOI] [PMC free article] [PubMed] [Google Scholar]
- 25.Bibby SRS, Jones DA, Ripley RM, et al. Metabolism of the intervertebral disc: Effects of low levels of oxygen, glucose, and pH on rates of energy metabolism of bovine nucleus pulposus cells. Spine. 2005;30:487–496. doi: 10.1097/01.brs.0000154619.38122.47. [DOI] [PubMed] [Google Scholar]
- 26.Sivan SS, Tsitron E, Wachtel E, et al. Aggrecan turnover in human intervertebral disc as determined by the racemization of aspartic acid. J Biol Chem. 2006;281:13009–13014. doi: 10.1074/jbc.M600296200. [DOI] [PubMed] [Google Scholar]
- 27.Jackson AR, Huang CY, Brown MD, et al. 3D finite element analysis of nutrient distributions and cell viability in the intervertebral disc: effects of deformation and degeneration. J Biomech Eng. 2011;133:091006. doi: 10.1115/1.4004944. [DOI] [PMC free article] [PubMed] [Google Scholar]
- 28.Selard E, Shirazi-Adl A, Urban JP. Finite element study of nutrient diffusion in the human intervertebral disc. Spine. 2003;28:1945–1953. doi: 10.1097/01.BRS.0000087210.93541.23. [DOI] [PubMed] [Google Scholar]
- 29.Meisel HJ, Siodla V, Ganey T, et al. Clinical experience in cell-based therapeutics: disc chondrocyte transplantation A treatment for degenerated or damaged intervertebral disc. Biomol Eng. 2007;24:5–21. doi: 10.1016/j.bioeng.2006.07.002. [DOI] [PubMed] [Google Scholar]
- 30.Ganey T, Libera J, Moos V, et al. Disc chondrocyte transplantation in a canine model: a treatment for degenerated or damaged intervertebral disc. Spine. 2003;28:2609–2620. doi: 10.1097/01.BRS.0000097891.63063.78. [DOI] [PubMed] [Google Scholar]
- 31.Maroudas A, Stockwell RA, Nachemson A, et al. Factors involved in the nutrition of the human lumbar intervertebral disc: cellularity and diffusion of glucose in vitro. J Anat. 1975;120:113–130. [PMC free article] [PubMed] [Google Scholar]
- 32.Converti A, Zilli M, Arni S, et al. The effects of temperature and viscosity on glucose diffusivity through Saccharomyces cerevisiae biofilms. Can J Chem Eng. 1999;77:618–626. [Google Scholar]
- 33.Burstein D, Gray ML, Hartman AL, et al. Diffusion of small solutes in cartilage as measured by nuclear magnetic resonance (NMR) spectroscopy and imaging. J Orthop Res. 1993;11:465–478. doi: 10.1002/jor.1100110402. [DOI] [PubMed] [Google Scholar]
- 34.Urban JPG. Fluid and solute transport in the intervertebral disc London University. 1977 [Google Scholar]
- 35.Hutton WC, Murakami H, Li J, et al. The effect of blocking a nutritional pathway to the intervertebral disc in the dog model. J Spinal Disord Tech. 2004;17:53–63. doi: 10.1097/00024720-200402000-00011. [DOI] [PubMed] [Google Scholar]
- 36.Esko JD, Kimata K, Lindahl U. Proteoglycans and Sulfated Glycosaminoglycans. In: Varki A, Cummings RD, Esko JD, et al., editors. Essentials of Glycobiology. 2nd. Cold Spring Harbor (NY): 2009. [PubMed] [Google Scholar]
- 37.Gao X, Zhu Q, Gu W. Analyzing the effects of mechanical and osmotic loading on glycosaminoglycan synthesis rate in cartilaginous tissues. J Biomech. 2015;48:573–577. doi: 10.1016/j.jbiomech.2015.01.018. [DOI] [PMC free article] [PubMed] [Google Scholar]
- 38.Ishihara H, Warensjo K, Roberts S, et al. Proteoglycan synthesis in the intervertebral disk nucleus: the role of extracellular osmolality. Am J Physiol. 1997;272:C1499–1506. doi: 10.1152/ajpcell.1997.272.5.C1499. [DOI] [PubMed] [Google Scholar]
- 39.van Dijk B, Potier E, Ito K. Culturing bovine nucleus pulposus explants by balancing medium osmolarity. Tissue Eng Part C Methods. 2011;17:1089–1096. doi: 10.1089/ten.TEC.2011.0215. [DOI] [PubMed] [Google Scholar]
- 40.Ohshima H, Urban JP, Bergel DH. Effect of static load on matrix synthesis rates in the intervertebral disc measured in vitro by a new perfusion technique. J Orthop Res. 1995;13:22–29. doi: 10.1002/jor.1100130106. [DOI] [PubMed] [Google Scholar]
- 41.van Dijk BG, Potier E, Ito K. Long-term culture of bovine nucleus pulposus explants in a native environment. Spine J. 2013;13:454–463. doi: 10.1016/j.spinee.2012.12.006. [DOI] [PubMed] [Google Scholar]
- 42.Mow VC, Kuei SC, Lai WM, et al. Biphasic creep and stress relaxation of articular cartilage in compression? Theory and experiments. J Biomech Eng. 1980;102:73–84. doi: 10.1115/1.3138202. [DOI] [PubMed] [Google Scholar]
- 43.Lai WM, Hou JS, Mow VC. A triphasic theory for the swelling and deformation behaviors of articular cartilage. J Biomech Eng. 1991;113:245–258. doi: 10.1115/1.2894880. [DOI] [PubMed] [Google Scholar]
- 44.Bibby SR, Urban JP. Effect of nutrient deprivation on the viability of intervertebral disc cells. Eur Spine J. 2004;13:695–701. doi: 10.1007/s00586-003-0616-x. [DOI] [PMC free article] [PubMed] [Google Scholar]
- 45.Gu WY, Yao H, Huang CY, et al. New insight into deformation-dependent hydraulic permeability of gels and cartilage, and dynamic behavior of agarose gels in confined compression. J Biomech. 2003;36:593–598. doi: 10.1016/s0021-9290(02)00437-2. [DOI] [PubMed] [Google Scholar]
- 46.Gu WY, Yao H, Vega AL, et al. Diffusivity of ions in agarose gels and intervertebral disc: effect of porosity. Ann Biomed Eng. 2004;32:1710–1717. doi: 10.1007/s10439-004-7823-4. [DOI] [PubMed] [Google Scholar]