Abstract
Neoplastic pancreatic epithelial cells are widely believed to die via Caspase 8-dependant apoptotic cell death and chemotherapy is thought to further promote tumor apoptosis1. Conversely, disruption of apoptosis is a basic modality cancer cells exploit for survival2,3. However, the role of necroptosis, or programmed necrosis, in pancreatic ductal adenocarcinoma (PDA) is uncertain. There are a multitude of potential inducers of necroptosis in PDA including ligation of TNFR1, CD95, TRAIL receptors, Toll-like receptors, ROS, and Chemotherapeutics4,5. Here we report that the principal components of the necrosome, RIP1 and RIP3, are highly expressed in PDA and are further upregulated by chemotherapy. Blockade of the necrosome in vitro promoted cancer cell proliferation and induced an aggressive oncogenic phenotype. By contrast, in vivo RIP3 deletion or RIP1 inhibition was protective against oncogenic progression and was associated with the development of a highly immunogenic myeloid and T cell infiltrate. The immune-suppressive tumor microenvironment (TME) associated with intact RIP1/RIP3 signaling was in-part contingent on necroptosis-induced CXCL1 expression whereas CXCL1 blockade was protective against PDA. Moreover, we found that cytoplasmic SAP130 was expressed in PDA in a RIP1/RIP3-dependent manner, and Mincle – its cognate receptor – was upregulated in tumor-infiltrating myeloid cells. Mincle ligation by SAP130 promoted oncogenesis whereas Mincle deletion was protective and phenocopied the immunogenic reprogramming of the TME characteristic of RIP3 deletion. Cellular depletion experiments suggested that whereas inhibitory macrophages promote tumorigenesis in PDA, they lose their immune-suppressive effects in the context of RIP3 or Mincle deletion. As such, T cells which are dispensable to PDA progression in hosts with intact RIP3 or Mincle signaling become reprogrammed into indispensable mediators of anti-tumor immunity in absence of RIP3 or Mincle. Our work describes parallel networks of necroptosis-induced CXCL1 and Mincle signaling which critically promote macrophage-induced adaptive immune suppression enabling PDA progression.
Keywords: Pancreatic cancer, inflammation, C-type lectin receptors
We found that RIP1 and RIP3 are highly expressed in human PDA (Fig. 1a, b). Western blotting confirmed higher RIP1 and RIP3 expression in human PDA compared with surrounding normal pancreas (Fig. 1c). Similarly, FADD, which complexes with RIP1/RIP3 to form the necrosome, MLKL, a downstream mediator of necroptosis, and Caspase 8, a principal driver of apoptosis, were upregulated in PDA (Fig. 1c)5. Immune fluorescence microscopy showed evidence of RIP1–RIP3 co-localization in human (Fig. 1d) and murine (Fig. 1e) PDA suggesting necrosome complex formation. To test whether the necrosome was inducible with chemotherapy, we treated PDA-bearing mice with Gemcitabine. Chemotherapeutics increased PDA expression of RIP1 and RIP3 in vivo (Fig. 1f, g). Similarly, Gemcitabine increased RIP1 and RIP3 expression and RIP1–RIP3 co-association in vitro in PDA cells (Fig. 1h, i). Expression of components of the necrosome were also inducible by chemotherapeutics in human PDA cells whereas MLKL inhibition prevented chemotherapy-induced cell death (Fig. 1j, k).
Figure 1. RIP1 and RIP3 expression in PDA.
(a, b) Paraffin-embedded sections of human PDA and surrounding normal pancreata from 10 PDA patients were tested for expression of RIP1 and RIP3. (a) Representative images and (b) summary data are shown. (c) Human PDA specimens and adjacent normal human pancreas were tested for expression of RIP1, RIP3, FADD, MLKL, and Cleaved Caspase 8, by western blotting. Representative data from 2 patients and density analysis from 4 patients are shown. (d) Frozen human PDA specimens were tested for RIP1 and RIP3 co-expression by immune-fluorescence microscopy. A representative image is shown. (e) Frozen sections of pancreata from 6 month-old p48Cre;KrasG12D (KC) mice, which express mutant Kras, were tested for RIP1 and RIP3 co-localization. (f) Pdx1Cre;KrasG12D;Tp53R172H (KPC) mice, which express mutant Kras and p53, were serially treated with Gemcitabine or PBS and tested for expression of RIP1 and RIP3 by IHC (n=3/group). (g) Orthotopically implanted KPC-derived tumors were harvested from Gemcitabine or PBS-treated mice and tested for RIP1 and RIP3 expression by western blotting. Representative data and averages of quadruplicates based on density analysis are shown. (h) KPC-derived tumor cells were treated with Gemcitabine or PBS in vitro in triplicate and tested for gene expression by qPCR. (i) Lysate from KPC-derived tumor cells that had been treated with PBS or Gemcitabine were immuno-precipitated with a control Ab or α-RIP1 and tested for expression of RIP1 and RIP3. Input controls were also probed. (j) AsPC-1 cells were treated with PBS or Gemcitabine in triplicate and tested for gene expression by qPCR. (k) AsPC-1, PANC1, and MIA PaCa-2 cells were cultured with PBS, Gemcitabine, or Gemcitabine + an MLKL inhibitor in quadruplicate. Cellular viability was determined at 24h using PI. Graphs show mean ± s.e.m. *p<0.05, **p<0.01, ***p<0.001, ****p<0.0001 (unpaired, t-test). For gel source data, see Supplementary Figure 1.
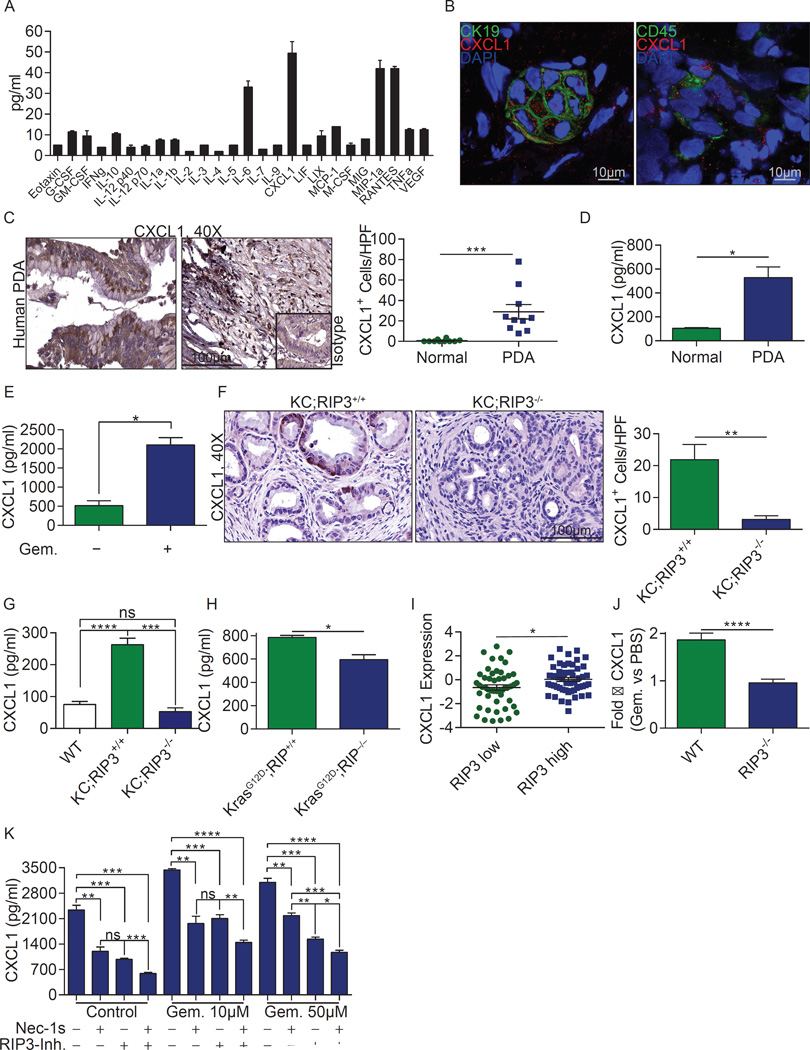
Since necroptosis is a pro-inflammatory process, we postulated that it would support peri-tumoral inflammation6. We found that CXCL1 is one of the most highly expressed chemokines in murine PDA (Fig. 2a). Similarly, CXCL1 was robustly expressed in human PDA (Fig. 2b–d). Gemcitabine upregulated PDA expression of CXCL1 in mice (Fig. 2e), whereas RIP3 deletion mitigated CXCL1 expression in vivo (Fig. 2f, g) and in vitro (Fig. 2h). High RIP3 also correlated with higher CXCL1 in a human PDA RNAseq database (Fig. 2i). Further, upregulation of CXCL1 by Gemcitabine was mitigated by RIP3 deletion in vivo (Fig. 2j) and by RIP1 or RIP3 inhibition in vitro (Fig. 2k). Collectively, these data suggest necrosome-dependent upregulation of CXCL1 in PDA.
Figure 2. CXCL1 is expressed in PDA in a RIP1/3 dependent manner.
(a) Single cell suspensions of pancreata from 6 month-old KC mice were cultured for 24h. Supernatant was tested for expression of inflammatory mediators. Averages of biologic duplicates are shown. (b) Human PDA tumors were tested for co-expression of CXCL1/CK19 and CXCL1/CD45 by confocal microscopy. Representative images are shown. (c) Paraffin-embedded PDA sections from 10 patients were tested for expression of CXCL1 by immunohistochemistry compared with surrounding normal pancreas. Representative ductal and stromal areas of PDA tumors and quantitative data are shown. (d) CXCL1 levels were tested by ELISA in tissue homogenate from 3 human PDA specimens compared with surrounding normal pancreas. (e) Homogenized KPC tumors from PBS- or Gemcitabine-treated mice were tested for CXCL1 by ELISA. Experiments were performed in biologic duplicates. (f) Paraffin-embedded sections from 6 month-old KC;RIP3+/+ and KC;RIP3−/− mice were tested for expression CXCL1 by IHC (n=3/group). (g) Homogenized pancreata from 6 month-old WT (n=6), KC;RIP3+/+ (n=4), and KC;RIP3−/− (n=4) mice were tested for CXCL1 by ELISA. (h) KrasG12D;RIP3+/+ PDEC (n=3) and KrasG12D;RIP3−/− PDEC (n=4) were cultured in vitro and tested for CXCL1 in 24h cell culture supernatant by ELISA. (i) Correlation between high and low tertiles of RIP3 expression and CXCL1 expression was tested in human PDA tissues using the UCSC RNAseq database. Each point represents data from another patient. (j) WT or RIP3−/− mice were orthotopically implanted with KPC-derived tumor cells and treated with a single dose of Gemcitabine or PBS at 3 weeks. Tumors were harvested at 12h, homogenized, and the fold-increase in CXCL1 expression in Gemcitabine-versus PBS-treated tumors in both WT and RIP3−/− mice was determined by ELISA (n=5). (k) KPC-derived tumor cells were treated in triplicate in vitro with Gemcitabine (10µM or 50µM), Nec-1s, or a RIP3 inhibitor, alone or in combination. CXCL1 levels were tested at 24h by ELISA. Experiments were repeated at least twice. Graphs show mean ± s.e.m. *p<0.05, **p<0.01, ***p<0.001, ****p<0.0001 (unpaired, t-test).
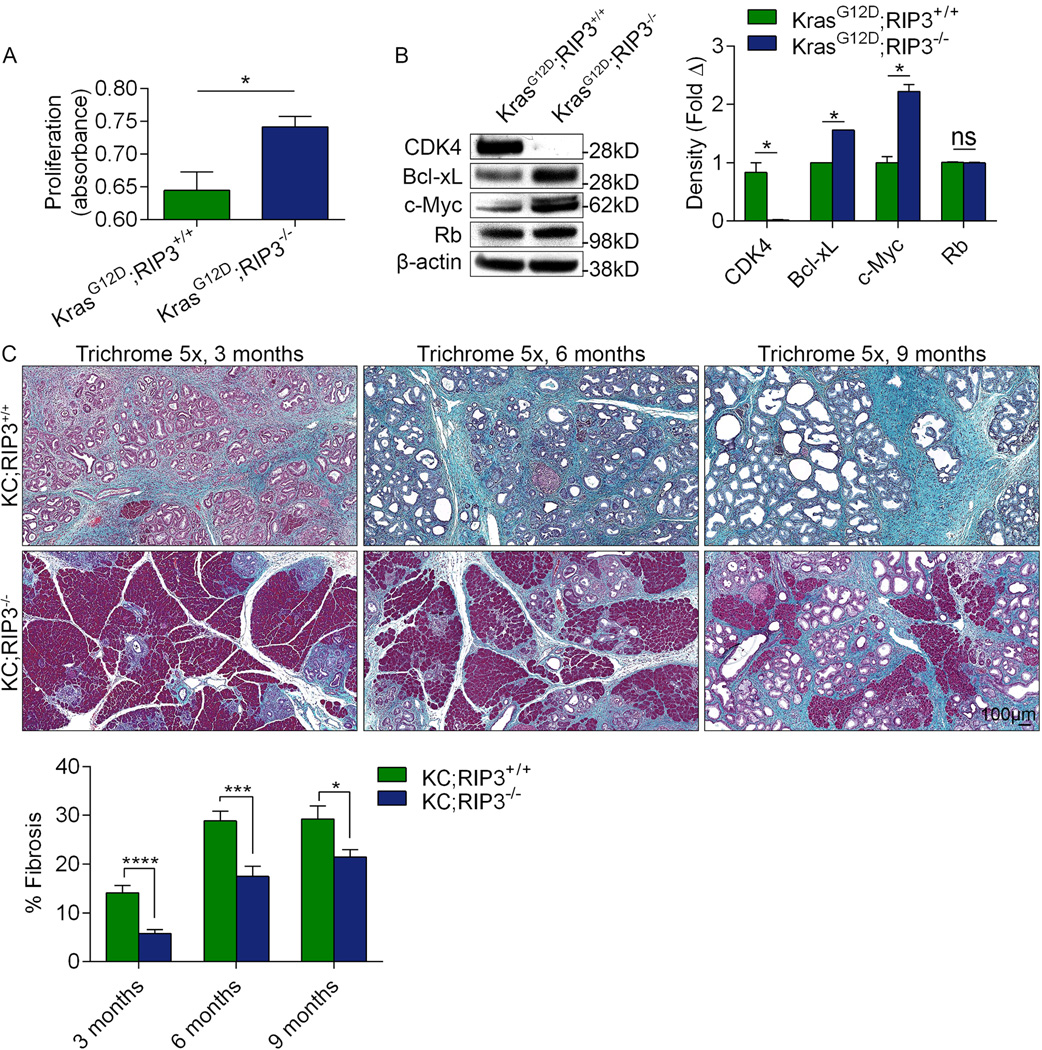
We studied the effects of RIP3 deletion on the properties of in vitro cultured KrasG12D-transformed pancreatic ductal epithelial cells (KrasG12D PDEC). Predictably, RIP3 deletion increased the proliferative rate of KrasG12D PDEC in vitro (Extended-Data-Fig. 1a). Moreover, KrasG12D;RIP3−/− PDEC exhibited a distinct phenotype including loss of CDK4 and elevated expression of Bcl-xL and c-Myc (Extended-Data-Fig 1b) which have selectively been associated with aggressive tumor-biology in PDA7–11.
Since RIP3 deletion increased proliferation of PDA cells, we postulated that blockade of necroptosis in vivo would accelerate tumorigenesis. To test this, we compared the rate of oncogenic progression in p48Cre;KrasG12D(KC);RIP3+/+ versus KC;RIP3−/− pancreata. Contrary to our hypothesis and belying our in vitro findings, RIP3 deletion was protective. KC;RIP3−/− pancreata exhibited a diminished rate of acinar replacement by dysplastic ducts, slower PanIN progression, and reduced fibro-inflammatory changes compared with KC;RIP3+/+ (Fig. 3a and Extended-Data-Fig. 1c). Accordingly, aged-matched KC;RIP3−/− pancreata weighed less than controls and RIP3 deletion extended survival (Fig. 3b, c). The proliferative rate was similar in KC;RIP3+/+ and KC;RIP3−/− pancreatic epithelial cells in vivo (Fig. 3d). To test whether abrogation of RIP1 signaling similarly protected against PDA, we treated 6 week-old KC mice for 8 weeks with Nec-1s. RIP1 blockade protected against oncogenic progression based on pancreas weight and histology (Fig. 3e, f).
Figure 3. RIP3 deletion or RIP1 blockade protect against pancreatic oncogenesis.
(a) KC;RIP3+/+ (n=11) and KC;RIP3−/− (n=9) mice were sacrificed at 3, 6, or 9 months of life. Representative H&E-stained sections, the percentage of pancreatic area occupied by intact acinar structures, and the fractions of ductal structures exhibiting normal morphology, acino-ductal metaplasia (ADM), or graded PanIN I–III lesions are shown. (b) Weights of pancreata were compared in 3 month-old KC;RIP3+/+ (n=11) and KC;RIP3−/− (n=9) mice. (c) Kaplan-Meier survival analysis was performed for KC;RIP3+/+ (n=29) and KC;RIP3−/− (n=41) mice (p<0.005). (d) Pancreata from 3 month-old KC;RIP3+/+ and KC;RIP3−/− mice were assayed for expression of Ki67. (e, f) Six week-old KC mice were serially treated with the RIP1 inhibitor Nec-1s or vehicle for 8 weeks before sacrifice (n=4/group). (e) Pancreas weights and (f) representative H&E-stained sections are shown and ductal morphology was quantified. Nec-1s experiments were repeated 3 times similar results. Graphs show mean ± s.e.m. *p<0.05; ****p<0.0001 (unpaired, t-test).
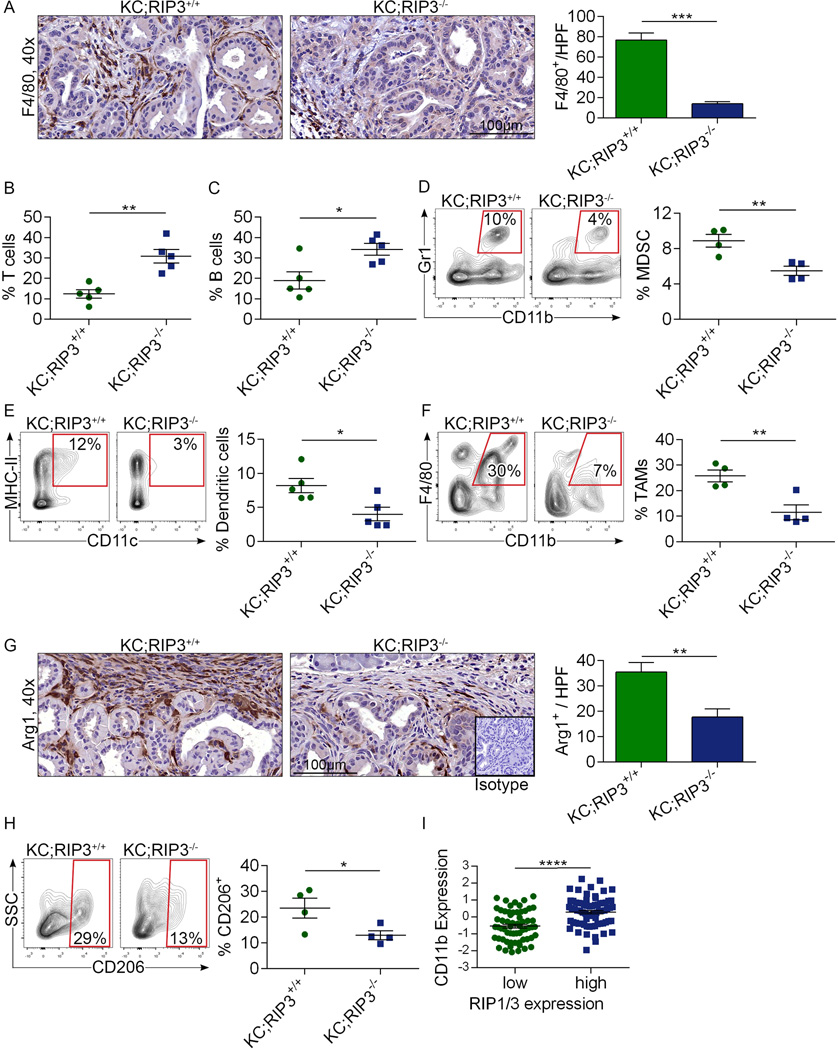
Since necroptosis can modulates inflammation12, we postulated that RIP3 deletion offers tumor-protection by enhancing peri-tumoral immunogenicity. RIP3 deletion diminished infiltration of tumor-associated macrophages (TAMs; Extended-Data-Fig. 2a). Conversely, the fraction of T cells and B cells were increased in KC;RIP3−/− pancreata (Extended-Data-Fig. 2b, c). Analysis of the myeloid compartment showed a decreased fraction of MDSC and DC in KC;RIP3−/− pancreata (Extended-Data-Fig. 2d, e). Further, consistent with our immunohistochemical data, bulk tumor-infiltrating TAMs and their M2-like Arg1+CD206+ subset were diminished in the context of RIP3 deletion (Extended-Data-Fig. 2f–h). Macrophage expression of PD-L1 was also reduced by RIP3 deletion (not shown). Collectively, these data suggest that RIP3 deletion increases lymphocyte infiltration in PDA and reduces infiltration of immune-suppressive myeloid cellular subsets. Similarly, in human PDA high RIP1/RIP3 co-expression correlated with elevated expression of the myeloid cell marker CD11b (Extended-Data-Fig. 2i).
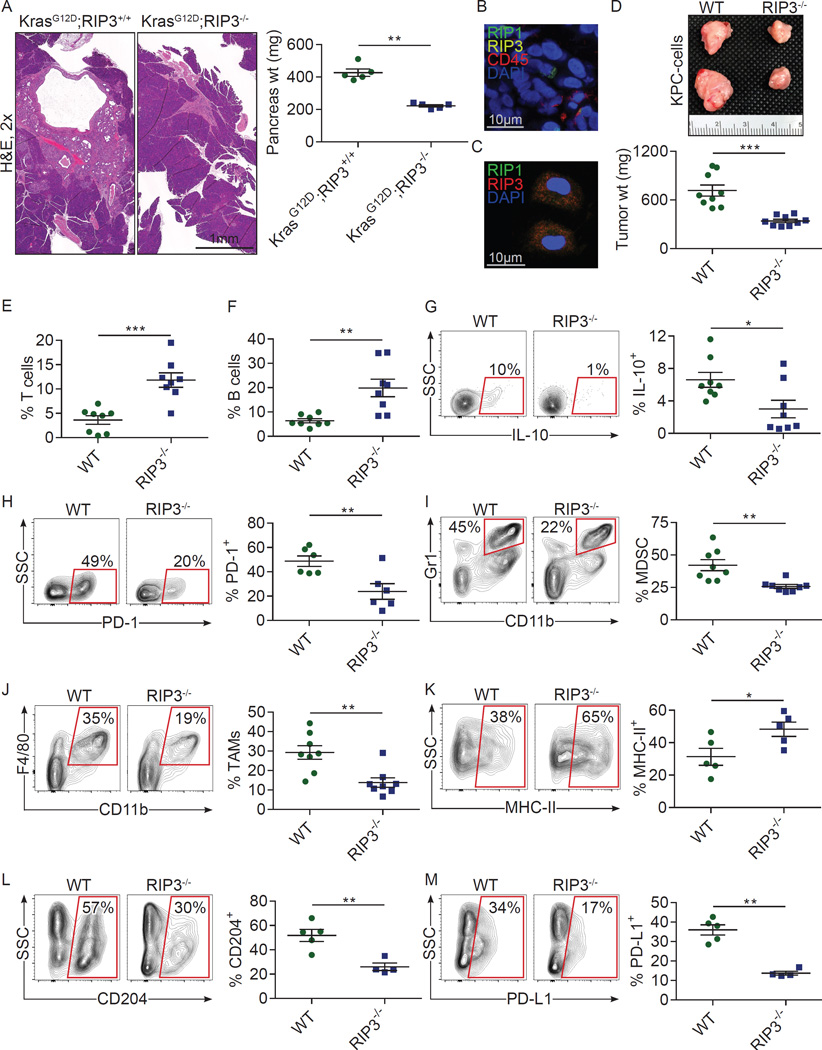
To determine whether deletion of RIP3 in the epithelial compartment alone is sufficient to protect against oncogenesis, we challenged cohorts of WT mice with an orthotopic injection of either KrasG12D;RIP3+/+ PDEC or KrasG12D;RIP3−/− PDEC. Similar to our findings using pan-RIP3 deletion, KrasG12D;RIP3−/− tumors grew at slower rates than KrasG12D;RIP3+/+ (Fig. 4a) suggesting that RIP3 blockade in the epithelial compartment alone protects against PDA progression.
Figure 4. RIP3 deletion in either the epithelial or extra-epithelial compartment is protective against PDA and enhances immunogenicity.
(a) WT mice orthotopically implanted with KrasG12D;RIP3+/+ or KrasG12D;RIP3−/− PDEC were sacrificed at 6 weeks. Representative H&E-stained sections and pancreas weights are shown (n=5/group). (b) Frozen sections of orthotopic KPC tumors were co-stained for RIP1, RIP3, and CD45 and imaged by immune-fluorescence microscopy. (c) CD45+ leukocyte suspensions harvested from orthotopic KPC tumors were co-stained for RIP1 and RIP3 and imaged by immune-fluorescence microscopy. (d) WT and RIP3−/− mice bearing orthotopic KPC tumor were sacrificed at 3 weeks. Representative gross pictures and tumor weights are shown (n=9/group). (e) The fraction of peri-tumoral CD3+ T cells, (f) CD19+ B cells, (g) T cell expression of IL-10, and (h) PD-1 were recorded. (i) The fraction of peri-tumoral Gr1+CD11b+ MDSC, (j) Gr1−CD11b+F4/80+ TAMs, and (k) MHC II, (l) CD204, and (m) PD-L1 expression on TAMs are shown. Flow cytometry data were reproduced in 3 separate experiments. Graphs show mean ± s.e.m. *p<0.05, **p<0.01, ***p<0.001 (unpaired, t-test).
Since inflammatory cells within the PDA TME express the components of the necrosome (Figs. 1a and 4b, c), we investigated whether RIP3 deletion in the extra-epithelial compartment would similarly mitigate PDA progression. WT and RIP3−/− mice were challenged with an orthotopic intra-pancreatic injection of KrasG12D PDEC or Pdx1Cre;KrasG12D;Tp53R172H (KPC)-derived PDA cells, which express both mutant Kras and p53, and tumor size was measured at 3 weeks. RIP3−/− mice developed smaller KrasG12D (not shown) and KPC-derived tumors (Fig. 4d) implying that blockade of necroptosis in the extra-epithelial compartment alone is protective against PDA.
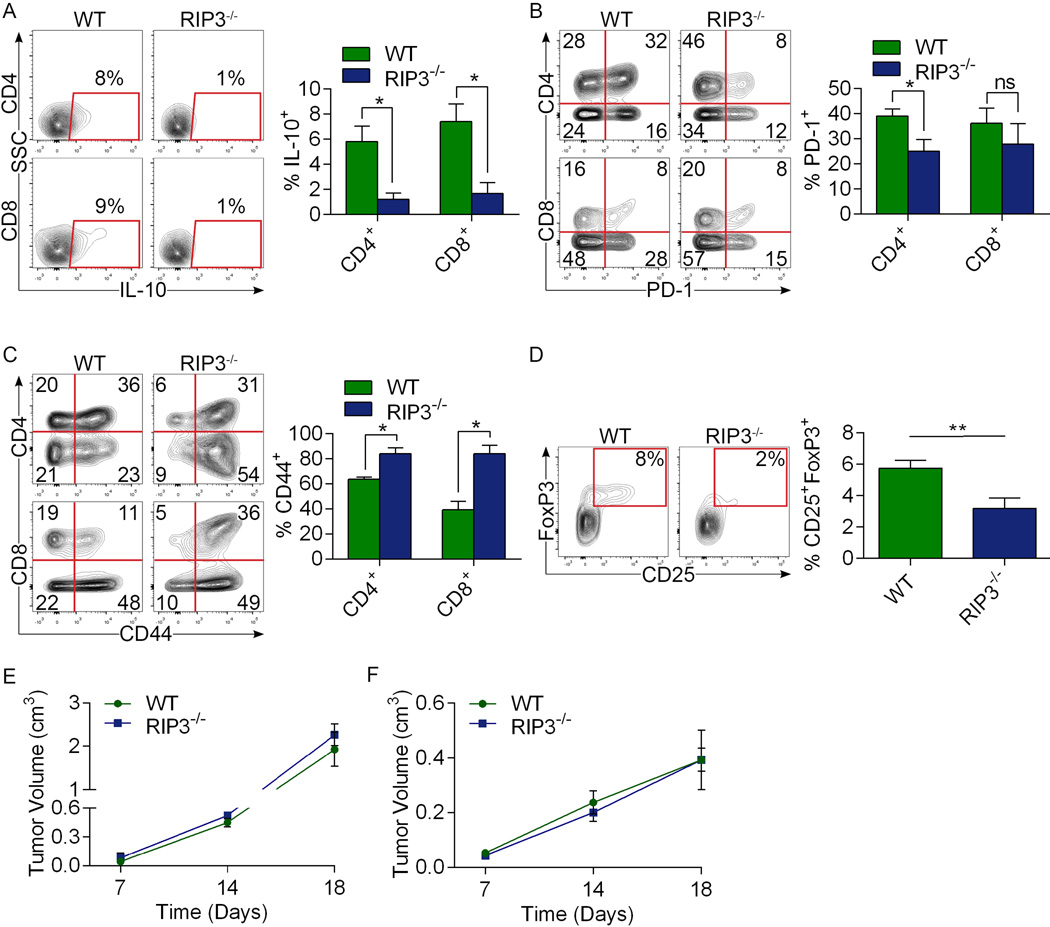
To determine whether deletion of RIP3 in the extra-epithelial compartment similarly bolsters peri-tumoral immunogenicity, we analyzed the inflammatory infiltrate in orthotopic KPC tumors in WT and RIP3−/− hosts. RIP3 deletion resulted in elevated T cell and B cell infiltrates (Fig. 4e, f) and peri-tumoral T cells expressed lower IL-10 and PD-1, higher CD44, and exhibited a lower fraction of Tregs compared with control (Fig. 4g, h; Extended-Data-Fig. 3a–d). Analysis of the myeloid compartment again revealed a reduction in the fraction of peri-tumoral MDSC (Fig. 4i) and TAMs (Fig. 4j) with a shift toward an M1-like phenotype (Fig. 4k, l) and reduced PD-L1 expression (Fig. 4m). These data ostensibly contrast with a recent report which found that RIP1 signaling can enhance CD8+ T cell cross-priming. However, effects in PDA may be unique to the immunologic milieu of the pancreatic TME13. Accordingly, RIP3 deletion was not protective against B16 melanoma or subcutaneously-implanted KPC cells (Extended-Data-Fig. 3e, f).
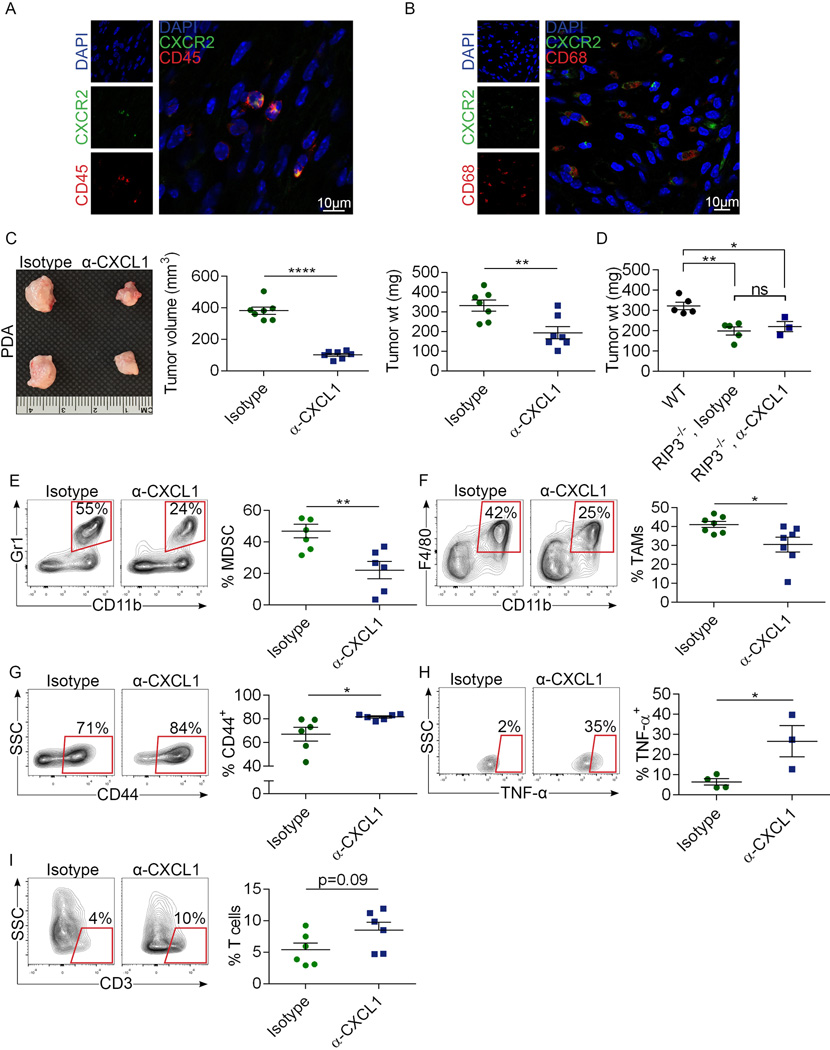
Since CXCL1 expression in PDA is contingent on the necrosome (Fig. 2) and we found that CXCR2 is widely expressed on peri-tumoral leukocytes (Extended-Data-Fig. 4a, b), we postulated that CXCL1 may be responsible for the pro-tumorigenic immune-suppression associated with RIP3 signaling by mobilizing myeloid cells14,15. To test this hypothesis, we challenged WT mice with orthotopic PDA whilst blocking CXCL1 in select cohorts. CXCL1 blockade protected against tumorigenesis in both the orthotopic KrasG12D PDEC (not shown) and KPC (Extended-Data-Fig. 4c) models. However, αCXCL1 treatment did not further enhance tumor protection in RIP3−/− animals (Extended-Data-Fig. 4d). Moreover, similar to RIP3 deletion, CXCL1 blockade reduced MDSC and TAM accumulation (Extended-Data-Fig. 4e, f). Tumor-infiltrating T cells were also more activated in the context of CXCL1 blockade as evidenced by higher CD44 and TNFα expression (Extended-Data Fig. 4g, h). However, CXCL1 inhibition was not significantly associated with higher infiltration of peri-tumoral T cells (Extended-Data-Fig. 4i), nor did it diminish Treg accumulation or lower IL-10 expression (not shown), each characteristic of RIP3 deletion. Taken together, these data suggest that CXCL1 overexpression alone may not account for the entire immune-suppressive phenotype associated with intact necroptosis signaling in PDA.
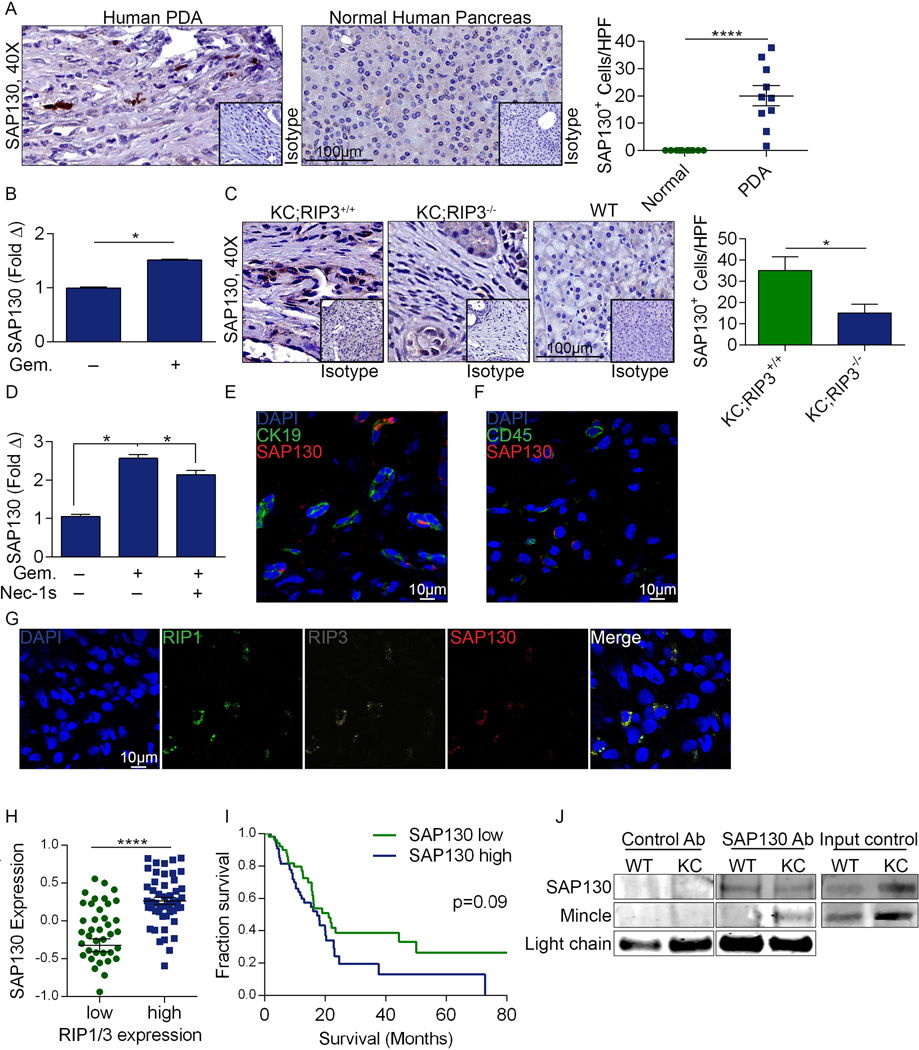
We postulated that necroptotic tumor cells release soluble factors which induce peri-tumoral immune-suppression. Mincle, a C-type lectin receptor (CLR) critical in mycobacterial immunity, can promote sterile inflammation in vitro by ligating SAP130, a nuclear protein released from dying cells16,17. We discovered high cytoplasmic SAP130 expression in human PDA (Extended-Data-Fig. 5a). SAP130 expression was also upregulated by chemotherapeutics in human PDA cell lines (Extended-Data-Fig. 5b). Further, SAP130 was highly expressed in KC;RIP3+/+ pancreata whereas its expression was reduced in KC;RIP3−/− (Extended-Data-Fig. 5c). Similarly, Gemcitabine-induced upregulation of Sap130 was partially mitigated by Nec-1s (Extended-Data-Fig. 5d). SAP130 expression in PDA was evident in both epithelial and inflammatory cells (Extended-Data-Fig. 5e, f). Moreover, confocal microscopy suggested SAP130 co-localization with RIP1/RIP3 in human (Extended-Data-Fig. 5g) and murine (not shown) PDA. SAP130 similarly correlated with high RIP1/RIP3 coexpression in a human RNAseq database (Extended-Data-Fig. 5h). Notably, there was a trend toward an association between high SAP130 expression and diminished survival in human PDA (Extended-Data-Fig. 5i).
We postulated that Mincle ligation by SAP130 drives necrosome-induced accelerated oncogenesis. Accordingly, immunoprecipitation experiments suggested that Mincle co-associates with SAP130 in PDA (Extended-Data-Fig. 5j). Mincle was expressed in inflammatory cells in the human PDA TME, but absent in transformed ductal cells and in normal pancreas (Extended-Data-Fig. 6a). Overall, ~10% of tumor-infiltrating leukocytes expressed Mincle in human PDA compared with minimal expression in PBMC (Extended-Data-Fig. 6b). Subset analysis revealed high Mincle expression in human CD14+CD15+ tumor-infiltrating monocytes compared with lower expression in their counterparts in PBMC (Extended-Data-Fig. 6c). Similarly, in KC mice 10–15% of pancreatic leukocytes expressed Mincle compared with low expression in the spleen or in parenchymal cells (Extended-Data-Fig. 6d). Immunofluorescence microscopy confirmed Mincle expression in enriched PDA-infiltrating leukocytes (Extended-Data-Fig. 6e). Subset analysis suggested that Mincle was highly expressed in PDA-infiltrating MDSC, DC, and macrophages compared with lower expression in spleen (Extended-Data-Fig. 6f). Western blotting showed elevated expression of Mincle-related signaling intermediates in PDA in a RIP3-dependant manner (Extended-Data-Fig. 6g). Accordingly, p-Syk+ leukocytes were comparatively scarce in KC;RIP3−/− and KC;Mincle−/− pancreata (Extended-Data-Fig. 6h). However, Mincle deletion in PDA did not mitigate CXCL1 expression (Extended-Data-Fig. 6i) and CXCL1 blockade did not alter expression of Mincle-associated signaling intermediates (not shown).
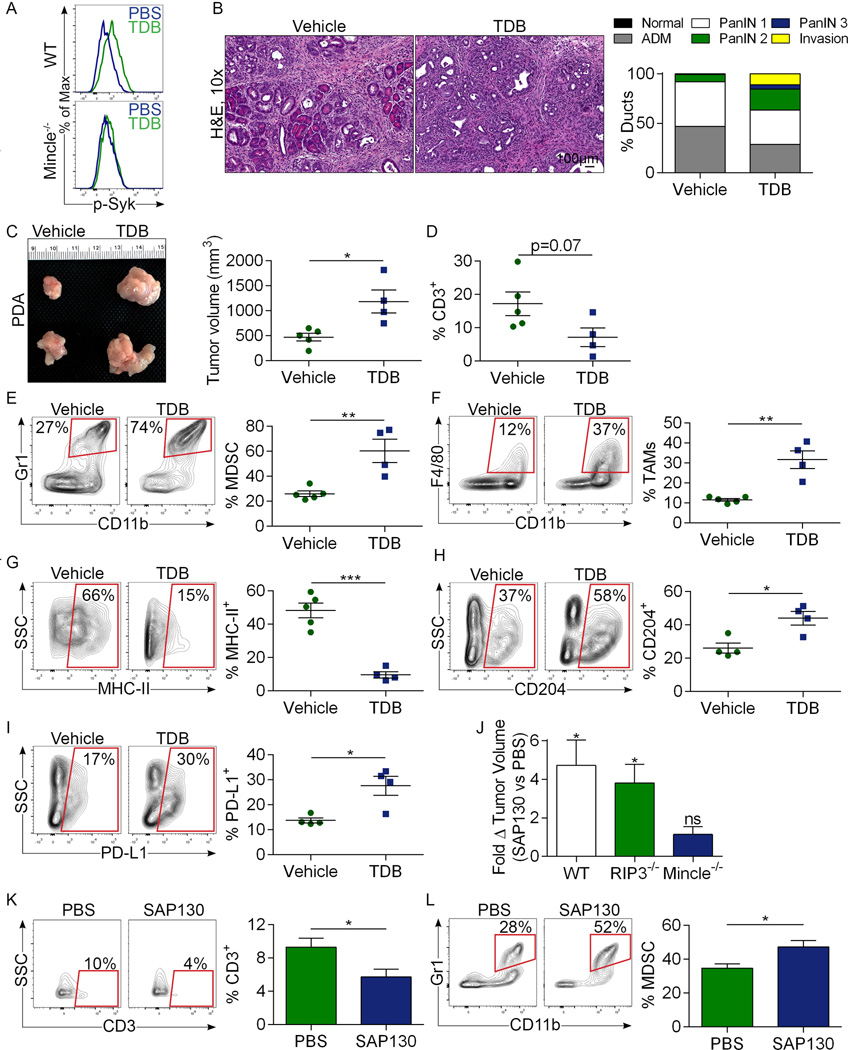
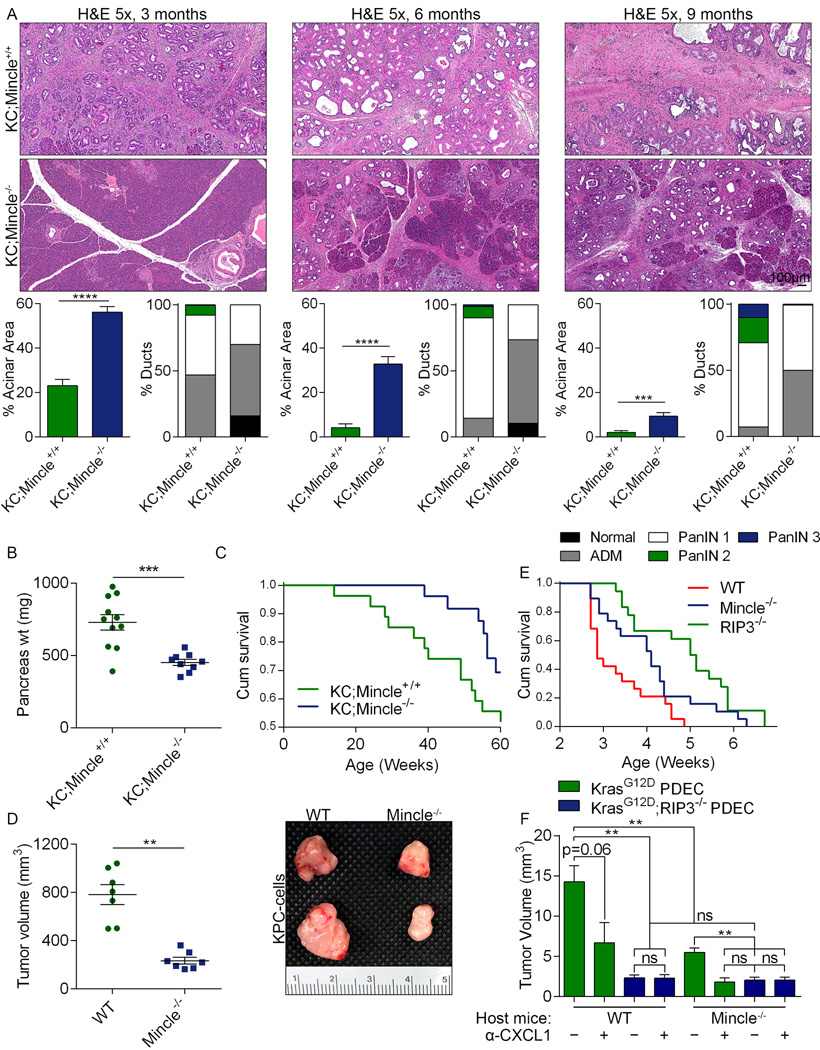
To determine whether Mincle signaling accelerates oncogenesis, we serially treated 6 week-old KC mice with the Mincle ligand TDB, which we confirmed induced Syk phosphorylation in vivo (Extended-Data-Fig. 7a). Mincle ligation accelerated tumorigenesis resulting in higher grade PanIN lesions, extensive fibrosis, and scattered foci of invasion (Extended-Data-Fig. 7b). TDB also accelerated the growth-rate of orthotopically implanted KPC-derived tumors in WT (not shown) and RIP3−/− animals (Extended-Data-Fig. 7c), suggesting that the pro-tumorigenic effects of Mincle activation in PDA are either independent or downstream of RIP3 signaling. Moreover, the inflammatory TME in TDB-treated RIP3−/− pancreata recapitulated the immune-suppressive milieu associated with an intact necroptosis signaling mechanism. Specifically, TDB-treated pancreata trended toward a lower fraction of tumor-infiltrating T cells (Extended-Data-Fig. 7d) and exhibited increased recruitment of both MDSC (Extended-Data-Fig. 7e) and M2-like TAMs which expressed high PD-L1 (Extended-Data-Fig. 7f–i). Similarly, direct inoculation of orthotopic PDA tumors with recombinant SAP130 accelerated PDA growth in WT and RIP3−/− hosts but not in Mincle−/− animals (Extended-Data-Fig. 7j) and recruited an immune-suppressive infiltrate (Extended-Data-Fig. 7k, l).
To determine whether Mincle signaling is required for PDA progression, we crossed Mincle−/− with KC mice and interrogated pancreata at serial intervals. Mincle deletion slowed the rate of oncogenesis based on histological analysis, pancreas weight, and animal survival (Extended-Data-Fig. 8a–c). Similarly, orthotopic KPC-derived tumor implantation in Mincle−/− pancreata resulted in smaller tumors and prolonged survival compared with implantation in WT hosts (Extended-Data-Fig. 8d, e). However, the survival benefit afforded to Mincle−/− mice was not as pronounced as RIP3−/−. Moreover, KrasG12D PDEC orthotropic implantation experiments suggested that CXCL1+Mincle blockade had additive protective effects whereas combined blockade of RIP3+Mincle or RIP3+CXCL1 did not confer additional protection over RIP3 blockade alone (Extended-Data-Fig. 8f).
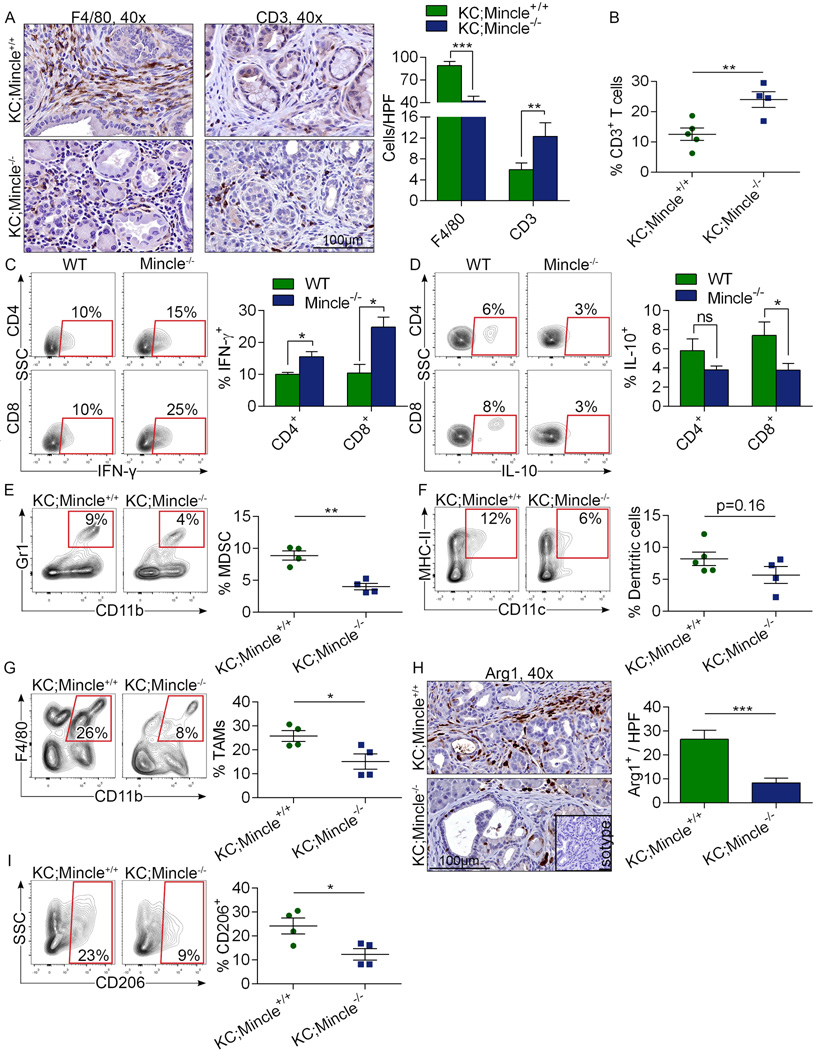
To determine whether Mincle deletion mimics the immunogenic reprogramming of the TME associated with RIP3 deletion, we assayed the pancreatic infiltrate in KC;Mincle−/− mice. KC;Mincle−/− pancreata exhibited diminished TAM infiltration but increased T cell recruitment on IHC (Extended-Data-Fig. 9a). Flow cytometry confirmed that Mincle deletion was associated with a higher immunogenic T cell infiltrate (Extended-Data-Fig. 9b–d), diminished MDSC infiltration (Extended-Data-Fig. 9e), a trend toward reduced DC (Extended-Data-Fig. 9f), a decreased fraction of TAMs (Extended-Data-Fig. 9g) with M1-like polarization (Extended-Data-Fig. 9h, i) and reduced PD-L1 expression (not shown). These changes recapitulate the immunogenic reprogramming of the TME characteristic of RIP3 deletion.
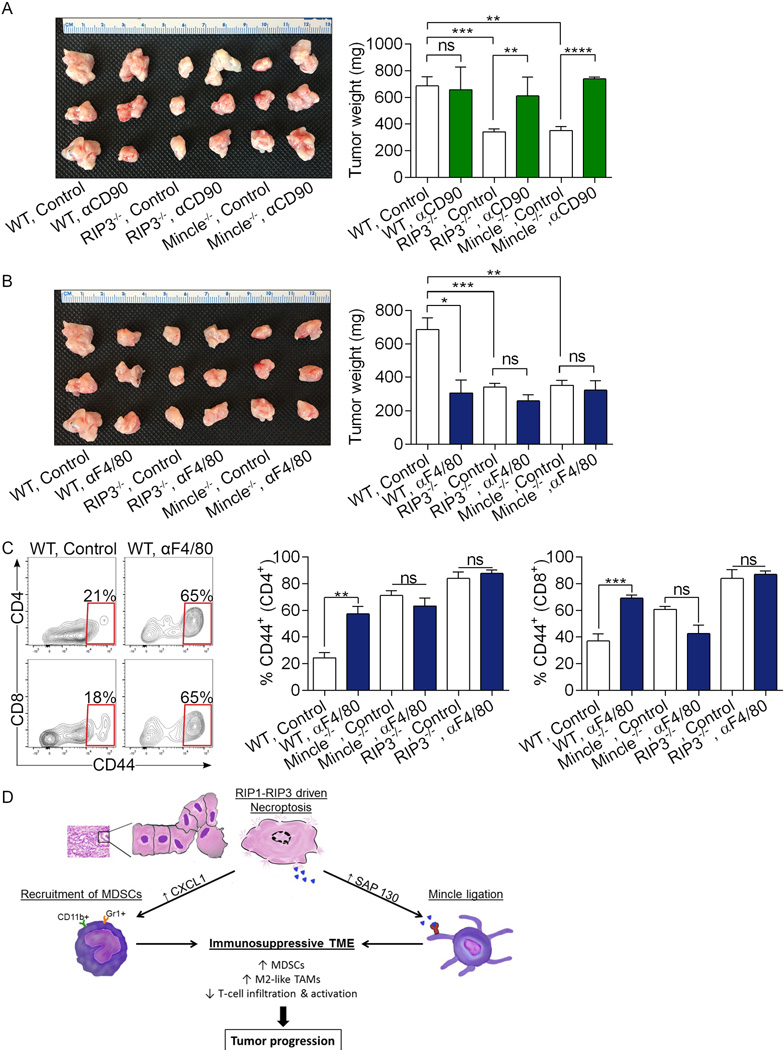
To investigate whether tumor-protection in absence of RIP3 or Mincle signaling is T cell dependent, we depleted T cells coincident with orthotopic KPC tumor administration in cohorts of WT, RIP3−/−, and Mincle−/− animals. T cell depletion did not influence PDA growth in WT mice. However, tumor protection was abrogated in RIP3−/− and Mincle−/− cohorts (Extended-Data-Fig. 10a). Conversely, depletion of macrophages in WT mice led to T cell activation and tumor protection; however, macrophage-depletion had no effect on further enhancing T cell activation or tumor protection in RIP3−/− and Mincle−/− animals (Extended-Data-Fig. 10b, c). These data suggest that in WT hosts TAMs promote PDA progression whereas T cells are dispensable to outcome; conversely, in absence of RIP3 or Mincle signaling, macrophages surrender their tumor-promoting effects and T cells are reprogrammed into indispensable mediators of anti-tumor immunity. Collectively, our work suggests that necroptosis-induced CXCL1 and Mincle signaling promote myeloid cell induced adaptive immune suppression in PDA. Each of these networks represent novel targets for experimental therapeutics (Extended-Data-Fig. 10c).
Methods
Animals and In Vivo Models
C57BL/6 (H-2Kb) mice were purchased from Jackson Labs (Bar Harbor, ME). Mincle−/− mice were obtained from the MMRRC (San Diego, CA)17. RIP3−/− mice were obtained from Genentech (San Francisco, CA)18. KC (gift of D. Bar-Sagi) and KPC (gift of Mark Philips, both New York University) mice develop pancreatic neoplasia endogenously by expressing mutant Kras alone or mutant Kras and p53, respectively, in the progenitor cells of the pancreas19,20. Both male and female mice were used but animals were gender and age matched in each experiment. Randomization was not performed. There were no specific inclusion or exclusion criteria. Sample sizes for experiments were determined without formal power calculations. Survival data for control KC mice were previously reported21. For orthotopic pancreatic tumor challenge, mice were administered intra-pancreatic injections of either KrasG12D PDEC or FC1242 tumor cells derived from KPC mice. KrasG12D PDEC and FC1242 cells were generated as previously described21,22. In preparation for intra-pancreatic injection, cells were suspended in PBS with 50% Matrigel (BD Biosciences, Franklin Lakes, NJ) at 1×10⁶ cells/mL and 1×10⁵ cells were injected into the body of the pancreas via laparotomy. Age-matched mice were used between 8–10 weeks of age for orthotopic tumor experiments. Mice were sacrificed 3–6 weeks later and tumor volume recorded. To study the effects of Mincle ligation, mice were administered TDB (4mg/kg; Invivogen, San Diego, CA) by i.p. injection thrice weekly for 8 weeks in endogenous tumor models and for 3 weeks in the orthotopic tumor models. In other experiments, orthotopic tumors were serially treated with direct inoculation of recombinant SAP130 (22µg; MyBioSource, San Diego, CA) at one week intervals via mini-laparotomy. In select experiments, cohorts of mice were treated daily with the RIP1 inhibitor Nec-1s (2mg/kg, i.p.; BioVision, Milpitas, CA) or a neutralizing α-CXCL1 mAb (4mg/kg, i.v.; R&D Systems). Gemcitabine (100mg/kg, i.p.; Hospira, Lake Forest, IL) was administered in vivo to KPC mice for 3 doses at 72h intervals unless otherwise specified. T cells (T24/31) and macrophages (F4/80, both BioXcell) were depleted with neutralizing mAbs using regimens we have previously described23. In some experiments, mice were subcutaneously administered FC1242 cells (1×10⁶) or B16 melanoma (1×10⁶; gift of Ronald DeMatteo, Memorial Sloan-Kettering Cancer Center) and sacrificed at 18 days. Investigators were not blinded to group allocation but were blinded when assessing outcome. All animal procedures were approved by the New York University School of Medicine IACUC. The maximum tumor size permitted is 3cm3 and this was not exceeded.
Cell lines and In Vitro Experiments
The human PDA cell lines AsPC1, PANC1, and MIA PaCa-2 cells (gifts of Dafna Bar-Sagi, originally obtained from ATCC) were maintained in complete RPMI (RPMI 1640 with 10% heat-inactivated FBS, 2 mM L-glutamine, 1% Penicillin/Streptomycin). Cell lines were not authenticated. Cells were free of mycoplasma. In selected experiments, cells were treated with Gemcitabine (10–50µM), Nec-1s (50µM), a RIP3 inhibitor (GSK872; 6 µM), or a MLKL inhibitor (Necrosulphonamide, 1µM, both EMD Millipore, Billerica, MA). Cellular viability was determined by PI staining. Cellular proliferation was assessed using the XTT II assay according to the manufacturer’s protocol (Roche, Pleasanton, CA) and expressed as % proliferation compared to control. Inflammatory mediators in cell culture supernatant were measured using the Milliplex Immunoassay (Millipore, Billerica, MA). CXCL1 was additionally measured using Flexbeads (BD Biosciences) and ELISA (R&D Systems).
Cellular Harvest and Flow Cytometry
Human or murine single cell suspensions for flow cytometry were prepared as described previously with slight modifications24. Briefly, pancreata were placed in cold RPMI 1640 with 1 mg/mL Collagenase IV (Worthington Biochemical, Lakewood, NJ) and 2 U/mL DNAse I (Promega, Madison, WI) and minced with scissors to sub-millimeter pieces. Tissues were then incubated at 37°C for 30 minutes with gentle shaking every 5 minutes. Specimens were passed through a 100µm mesh, and centrifuged at 350g for 5 minutes. The cell pellet was resuspended in cold PBS with 1% FBS. After blocking FcγRIII/II with an anti-CD16/CD32 mAb (eBioscience, San Diego, CA), cell labeling was performed by incubating 106 cells with 1 µg of fluorescently conjugated mAbs directed against murine CD44 (IM7), CD206 (C068C2), PD-L1 (10F.9G2), PD-1 (29F.1A12), CD3 (17A2), CD4 (RM4-5), CD8 (53-6.7), CD45 (30-F11), CD11b (M1/70), Gr1 (RB6-8C5), CD11c (N418), MHC II (M5/114.15.2), IL-10 (JES5-16E3), IFN-γ (XMG1.2), TNFα (MP6-XT22), F4/80 (BM8), CD19 (6D5; all Biolegend, San Diego, CA), p-Syk (moch1ct, eBioscience), and CD204 (2F8; Acris Antibodies, San Diego, CA). mAbs directed against Mincle (4A9, MBL International Corporation, Woburn, MA) were conjugated to FITC using the FITC Conjugation Kit (Abcam, Cambridge, MA). Human pancreas and PBMC were stained with mAbs directed against CD45 (HI30), CD14 (HCD14), CD15 (W6D3), CD19 (H1B19), CD11b (M1/70), CD11c (3.9), MHC II (L243; all Biolegend) and Mincle (AT16E3; Acris Antibodies). Intracellular cytokine staining was performed using the Fixation/Permeabilization Solution Kit (BD Biosciences). Flow cytometry was carried out on the LSR-II flow cytometer (BD Biosciences). Data were analyzed using FlowJo v.7.6.5 (Treestar, Ashland, OR).
Western Blotting and Immunoprecipitation
For protein extraction from tissues, 15–30 mg of tissue was homogenized in 150–300µL (i.e. 10 times the weight) ice-cold RIPA buffer. Total protein was quantified using the BioRad DC Protein Assay according to the manufacturer’s instructions (BioRad, Hercules, CA). Western blotting was performed as previously described with minor modifications24. Briefly, 10 % Bis-Tris polyacrylamide gels (NuPage, Invitrogen) were equiloaded with 10–30µg of protein, electrophoresed at 200 V, and electrotransferred to PVDF membranes. After blocking with 5% BSA, membranes were probed with primary antibodies to β-actin (8H10D10), FADD (Polyclonal), RIP1 (D94C12), Caspase-8 (D35G2), PLC-γ (polyclonal), p-PLC-γ (polyclonal), Bcl-XL (54H6; all Cell Signaling, Beverly, MA), RIP3 (Polyclonal; Abgent, San Diego, CA), c-Myc (9E10), CDK4 (C-22), CARD9 (polyclonal), Syk (polyclonal), p-Syk (polyclonal), Rb (C-15), SAP130 (H-300), Mincle (H-46; all Santa Cruz Biotechnologies, Dallas, TX), and MLKL (polyclonal; Abcam). Blots were developed by ECL (Thermo Scientific, Asheville, NC). For immunoprecipitation experiments, RIP1 or SAP130 was precipitated with protein G-agarose from cells. Immunoprecipitates were re-suspended and heated in loading buffer under reduced conditions, and resolved by 10% SDS-PAGE before transfer to PVDF membranes. The presence of co-immunoprecipitated RIP3 or Mincle, respectively, were determined by western blotting.
Histology, Immunohistochemistry, and Microscopy
For histological analysis, pancreatic specimens were fixed with 10% buffered formalin, dehydrated in ethanol, embedded with paraffin, and stained with H&E or Gomori’s Trichrome. The fraction of preserved acinar area was calculated as previously described24. Pancreatic ductal dysplasia was graded according to established criteria25. Immunohistochemistry in mouse tissues was performed using antibodies directed against F4/80 (CI:A3-1; Abcam), CD3 (Polyclonal; Abcam), Arg1 (EPR6671(B); Abcam), SAP130 (Polyclonal; Abcam), Mincle (AT16E3; Abcam), p-Syk (Polyclonal; Abcam), Ki67 (Polyclonal; Abcam), and CXCL1 (Polyclonal, Abcam). For analysis of human tissues, de-identified paraffin-embedded human PDA specimens and surrounding non-tumorous tissues from 10 consecutive surgically resected PDA patients at NYU Medical Center were probed with antibodies directed against RIP1 (D94C12; Cell Signaling), RIP3 (Q9Y572; Abgent), Mincle (AT16E3; Abcam), CXCL1 (Polyclonal; Abcam), and SAP130 (Polyclonal; Abcam). All human tissues were collected using an IRB approved protocol and donors of de-identified specimens gave informed consent. Sample sizes for human experiments were not determined based on formal power calculations. Quantifications were performed by assessing 10 high-power fields (HPF; 40×) per slide in a blinded manner. Immunofluorescent staining in frozen mouse tissues or cells was performed using antibodies against Mincle (AT16E3, Acris Antibodies), RIP1 (Polyclonal, Bioss), RIP3 (Polyclonal, Bioss), CD45 (30-F11; BD Biosciences), CK19 (Clone 13, Abnova), CXCL1 (Polyclonal; Abcam), CXCR2 (SA045E1; BioLegend), SAP130 (Polyclonal; Abcam), and DAPI (Vector Labs, Burlingame, CA). Immunofluorescent images were acquired using the Zeiss LSM700 confocal microscope with ZEN 2010 software (Carl Zeiss, Thornwood, New York).
PCR
RNA extraction was performed using the RNeasy Mini kit (Qiagen, Germantown, MD) as per manufacturer’s instructions. RNA was converted to cDNA using the RT2 First Strand Kit (Qiagen). qPCR was performed using the RT2 SYBR Green qPCR mastermix (Qiagen) on the Stratagene MX3005P (Stratagene, La Jolla, CA) according to the respective manufacturers’ protocols. Primers employed for human and mouse samples (RIP1, RIP3, CASP8, FADD, CXCL1, and SAP130) were purchased from Qiagen. Expression levels were normalized to β-actin and expressed as fold change compared to control.
Human Database and Statistical Analysis
Human RNAseq data and clinical correlations were performed using the UCSC Cancer Genomics Browser (https://genome-cancer.ucsc.edu/)26. Data is presented as mean +/− standard error. Survival was measured according to the Kaplan-Meier method. Statistical significance was determined by the Student’s t test and the log-rank test using GraphPad Prism 6 (GraphPad Software, La Jolla, CA). P-values <0.05 were considered significant.
Extended Data
Extended Data Figure 1. RIP3 deletion in PDA induces an aggressive tumor phenotype in vitro but mitigates oncogenesis in vivo.
(a) KrasG12D;RIP3+/+ and KrasG12D;RIP3−/− PDEC were cultured at equal density and tested for proliferation at 24h using the XTT assay (n=6/group). (b) Lysate was harvested from KrasG12D;RIP3+/+ and KrasG12D;RIP3−/− PDEC and tested for expression of select tumor suppressor and oncogenic genes. Representative data and density plots based on biologic duplicates are shown. Experiments were reproduced 3 times. (c) KC;RIP3+/+ (n=11) and KC;RIP3−/− (n=9) mice were sacrificed at 3, 6, or 9 months of life. Representative Trichrome-stained sections are shown and the fraction of fibrotic pancreatic area was calculated for each cohort. Graphs show mean ± s.e.m. *p<0.05, ***p<0.001, ****p<0.0001 (unpaired, t-test). For gel source data, see Supplementary Figure 1.
Extended Data Figure 2. RIP3 deletion induces immunogenic reprogramming of the pancreatic TME.
(a) KC;RIP3+/+ and KC;RIP3−/− mice were sacrificed at 3 months of life. Paraffin-embedded sections were stained using a mAb directed against F4/80. Representative images and quantitative data are shown (n=5/group). (b) The fraction of peri-tumoral CD3+ T cells, (c) CD19+ B cells, (d) Gr1+CD11b+ MDSC, (e) F4/80−CD11c+MHCII+ DC, and (f) CD11c−Gr1−CD11b+F4/80+ TAMs were determined by flow cytometry. (g) Arg1 expression was determined by IHC. Representative images and quantitative data are shown (n=5/group). (h) CD206 expression in TAMs was assessed by flow cytometry. (i) Correlation between high and low tertiles of RIP1–RIP3 co-expression and CC11b expression was tested in human PDA tissues using the UCSC RNAseq database. Each point represents data from another patient. Graphs show mean ± s.e.m. *p<0.05, **p<0.01, ****p<0.0001 (unpaired, t-test). Flow cytometry experiments were reproduced in two separate experiments.
Extended Data Figure 3. RIP3 deletion in PDA is associated with CD4+ and CD8+ T cell activation but RIP3 deletion does not alter B16 melanoma or subcutaneously implanted pancreatic tumor growth.
WT and RIP3−/− mice were orthotopically implanted with KPC-derived tumor cells (n=7/group). Animals were sacrificed at 3 weeks and intra-tumoral CD4+ and CD8+ T cells expression of (a) IL-10, (b) PD-1, (c) and CD44 were determined by flow cytometry. (d) CD4+ T cell co-expression of CD25 and FoxP3 was also analyzed. *p<0.05, **p<0.01 (unpaired, t-test). Data were reproduced in 2 separate experiments. (e) WT and RIP3−/− mice were implanted with B16 melanoma cells s.q. and tumor size was measured at serial intervals (n=3/group). p=ns at all time points. (f) WT and RIP3−/− mice were implanted with KPC-derived tumor cells s.q. and tumor size was measured at serial intervals (n=3/group). p=ns at all time points (unpaired, t-test). Graphs show mean ± s.e.m.
Extended Data Figure 4. CXCL1 blockade protects against pancreatic oncogenesis.
(a, b) Pancreata from 6 month-old KC mice were analyzed for co-expression of (a) CD45 and CXCR2 and (b) CD68 and CXCR2 by confocal microscopy. (c) WT mice were challenged with an orthotopic injection of KPC-derived tumor cells. Cohorts were serially treated with an α-CXCL1 mAb or isotype control. Pancreatic tumors were harvested at 3 weeks. Representative photographs and quantitative analyses of tumor volume and weight are shown (n=7/group). (d) WT (n=5) or RIP3−/− mice were challenged with an orthotopic injection of KPC-derived tumor cells. RIP3−/− cohorts were serially treated with an α-CXCL1 mAb (n=3) or isotype control (n=5). Pancreatic tumors were harvested at 3 weeks and tumor weight was recorded. (e–i) WT mice were challenged with an orthotopic injection of KPC-derived tumor cells and cohorts were serially treated with an α-CXCL1 mAb or isotype control. (e) The fraction of peri-tumoral Gr1+CD11b+ MDSC, (f) Gr1−CD11b+F4/80+ TAMs, (g) CD3+ T cell expression of CD44 and (h) TNF-α, and (i) the fraction of peri-tumoral CD3+ T cells were determined by flow cytometry. Graphs show mean ± s.e.m. *p<0.05, **p<0.01, ****p<0.0001 (unpaired, t-test). Flow cytometry data were reproduced 3 times.
Extended Data Figure 5. High SAP130 levels in PDA.
(a) Paraffin-embedded sections of human PDA and surrounding normal pancreata from 10 PDA patients were tested for expression of SAP130 by immunohistochemistry compared with isotype control. Representative images and summary data from 10 patients are shown. (b) SAP130 expression was tested by qPCR in human AsPC-1 cells after treatment with PBS or Gemcitabine (n=3/group). (c) SAP130 expression was assayed by immunohistochemistry in paraffin-embedded pancreata of 6 month-old KC;RIP3+/+, KC;RIP3−/−, and WT mice compared with respective isotype controls. Representative images and quantitative data are shown (n=4/group). (d) Sap130 expression was tested by qPCR in KPC-derived tumor cells treated with PBS or Gemcitabine +/− Nec-1s in triplicate. (e) SAP130 expression was tested by confocal microscopy in CK19+ epithelial cells and (f) CD45+ inflammatory cells in murine PDA. (g) Co-expression of SAP130, RIP1, and RIP3 were tested by confocal microscopy in human PDA. (h) Correlation between high and low tertiles of combined RIP1/RIP3 and SAP130 expression was tested using the UCSC RNAseq database. Graphs show mean ± s.e.m. *p<0.05, ****p<0.0001 (unpaired, t-test). (i) Human PDA patients with respective high or low tertile levels of SAP130 expression were compared in a Kaplan-Meier survival analysis using the UCSC RNAseq database (p=0.09). (j) Lysate from 6 month-old WT or KC mice were immuno-precipitated using an α-SAP130 or control Ab and then tested for expression of SAP130 and Mincle. Input controls were similarly probed. Results were reproduced in 2 separate experiments. For gel source data, see Supplementary Figure 1.
Extended Data Figure 6. High Mincle signaling in PDA.
(a) Mincle expression was tested in paraffin-embedded human PDA sections and surrounding normal pancreata from 10 PDA patients. Representative stromal and ductal areas of PDA tumors and quantitative data are shown. (b) CD45+ and pancreas-infiltrating leukocytes and CD45− tumor or parenchymal cells from human PDA were tested for Mincle expression compared with PBMC. (c) Human PDA-infiltrating and PBMC-derived CD14+CD15+ and CD14+CD15− cells from PDA patients were gated and tested for Mincle expression compared with isotype control. Representative histograms and quantitative data are shown. (d) CD45+ and CD45− cells from pancreata and spleen of 6 month-old KC mice were tested for expression of Mincle. Representative histograms are shown. (e) Pancreas-infiltrating leukocyte suspensions from 6 month-old KC mice were tested for Mincle expression by immune-fluorescence microscopy compared with isotype control. (f) Granulocytes, DC, and macrophages from pancreata and spleen of 3 month-old KC mice were gated by flow cytometry and tested for expression of Mincle compared with isotype control. Representative histograms and quantitative data are shown (n=3). (g) Whole pancreas lysate from WT, RIP3−/−, KC;RIP3+/+, and KC;RIP3−/− mice were probed for CARD9, p-Syk, Syk, p-PLC-γ, and PLC-γ by western blotting. Density analysis based triplicates was performed. (h) Pancreata from WT, Mincle−/−, RIP3−/−, KC, KC;Mincle−/−, and KC;RIP3−/− mice were stained using a mAb directed against p-Syk. Representative images and quantitative data are shown (n=3/group). Graphs show mean ± s.e.m. *p<0.05, **p<0.01, ***p<0.001, ****p<0.0001 (unpaired, t-test). (i) 3 month-old KC and KC;Mincle−/− pancreata were tested for CXCL1 expression by PCR in biologic duplicates. Data was reproduced twice. For gel source data, see Supplementary Figure 1.
Extended Data Figure 7. Mincle ligation accelerates pancreatic oncogenesis.
(a) WT or Mincle−/− mice were administered a single dose of vehicle or TDB and p-Syk expression was tested in Gr1−F4/80+CD11b+ splenic macrophages at 4 hours by flow cytometry. Representative data is shown (n=4/group). (b) Six week-old KC mice were treated with the Mincle ligand TDB or vehicle for 8 weeks before sacrifice (n=5/group). Representative H&E stained sections are shown and the fraction of ducts exhibiting normal morphology, ADM, graded PanIN lesions, or foci of invasive cancer are shown. (c–i) Cohorts of RIP3−/− mice were orthotopically implanted with KPC-derived tumor cells and serially treated with TDB (n=4) or vehicle (n=5) before sacrifice at 3 weeks. (c) Representative images of tumors are shown and pancreatic weights and tumor volume were recorded. (d) The fraction of CD3+ T cells, (e) Gr1+CD11b+ MDSC, and (f) Gr1−CD11b+F4/80+ TAMs in each cohort was determined by flow cytometry. (g) MHC II, (h) CD204, and (i) PD-L1 expression in TAMs is shown for each cohort. Data were reproduced in 2 separate experiments. (j) WT (n=4), RIP3−/− (n=4), and Mincle−/− (n=3) mice were challenged orthotopically with KPC-derived tumor cells. On day 7 and 14 mice underwent mini-laparotomies, tumor volume was measured in situ, and animals received an intra-tumoral injection of PBS or recombinant SAP130. On day 20, mice were sacrificed and the final tumor volume recorded. The fold-increase in tumor volume between days 7 and 20 in SAP130- versus PBS-treated tumors is shown for WT, RIP3−/−, and Mincle−/− cohorts. (k, l) WT mice were similarly challenged with orthotopic KPC-derived tumor and then administered an intra-tumoral injection of PBS (n=4) or recombinant SAP130 (n=3) on day 7 and 14 mice. On day 20, tumors were harvested and the fraction of (k) CD3+ T cells and (l) Gr1+CD11b+ MDSC among CD45+ tumor-infiltrating leukocytes was determined. Graphs show mean ± s.e.m. *p<0.05, **p<0.01, ***p<0.001 (unpaired, t-test).
Extended Data Figure 8. Mincle deletion protects against pancreatic oncogenesis.
(a) KC;Mincle+/+ (n=11) and KC;Mincle−/− (n=9) mice were sacrificed at 3, 6, or 9 months of life. Representative H&E-stained sections are shown, the percentage of pancreata occupied by intact acinar structures, and the fractions of ducts exhibiting normal morphology, ADM, or graded PanIN I-III lesions were calculated. (b) Weights of pancreata were compared in 3 month-old KC;Mincle+/+ (n=11) and KC;Mincle−/− (n=9) mice. (c) Kaplan-Meier survival analysis was performed for KC;Mincle+/+ (n=29) and KC;Mincle−/− (n=28) mice (p=0.06). Controls were shared with experiments in Figure 3. (d) KPC-derived tumor cells were orthotopically implanted in pancreata of WT or Mincle−/− mice. Animals were sacrificed at 3 weeks (n=7/group). Tumor volume was recorded. Representative images of pancreatic tumors are shown. (e) KPC-derived tumor cells were orthotopically implanted in pancreata of WT (n=19), Mincle−/− (n=19), and RIP3−/− (n=18) mice. Kaplan-Meier survival analysis was performed (WT vs Mincle−/−: p=0.03; WT vs RIP3−/−: p<0.0001; Mincle−/− vs RIP3−/−: p=0.03). (f) WT and Mincle−/− mice were orthotopically implanted with KrasG12D;RIP3+/+ PDEC (green) or KrasG12D;RIP3−/− PDEC (blue). Cohorts were additionally treated with a neutralizing αCXCL1 mAb or isotype control (mean n=4/group). Mice were sacrificed at 3 weeks and tumor volume was recorded. Graphs show mean ± s.e.m. **p<0.01, ***p<0.001, ****p<0.0001 (unpaired, t-test).
Extended Data Figure 9. Mincle deletion in PDA enhances the immunogenicity of the inflammatory TME.
(a) KC;Mincle+/+ and KC;Mincle−/− mice were sacrificed at 3 months of life. Paraffin-embedded sections were stained using mAbs directed against F4/80 and CD3 (n=5/group). Representative images and quantitative data are shown. (b) The fraction of peri-tumoral CD3+ T cells and (c) CD4+ and CD8+ T cell expression of IFN-γ and (d) IL-10 were determined by flow cytometry. (e) The fraction of tumor-infiltrating Gr1+CD11b+ MDSC, (f) F4/80−CD11c+MHCII+ DC, (g) and Gr1−CD11b+F4/80+ TAMs were also determined by flow cytometry. (h) Arg1 expression was determined by IHC. Representative images and quantitative data are shown. (i) CD206 expression in TAMs was determined by flow cytometry. Graphs show mean ± s.e.m. *p<0.05, **p<0.01, ***p<0.001 (unpaired, t-test). Experiments were repeated twice with similar results.
Extended Data Figure 10. RIP3 and Mincle signaling are necessary for macrophage-induced suppression of T cell immunity in PDA.
(a–c) Cohorts of WT, RIP3−/−, and Mincle−/− animals were challenged with orthotopic PDA and serially treated with (a) a neutralizing αCD90 mAb, (b) a neutralizing αF4/80 mAb, or isotype control. Mice were sacrificed at 21 days and pancreatic tumors weighed. Controls were shared for both experiments and are shown twice (n=4 for Mincle−/− αCD90 and αF4/80-treated groups and n=3 for other groups). (c) CD4+ and CD8+ T cell activation was determined by expression of CD44 in WT, RIP3−/−, and Mincle−/− cohorts treated with αF4/80 or isotype control. Graphs show mean ± s.e.m. *p<0.05, **p<0.01, ***p<0.001, ****p<0.001 (unpaired, t-test). In vivo cellular depletion experiments were repeated on 2 separate occasions with similar results. (d) Schematic depicting immune-suppressive implications of RIP1/RIP3-driven CXCL1 expression and Mincle activation.
Supplementary Material
Acknowledgments
This work was supported by grants for the German Research Foundation (LT), the National Pancreas Foundation (CPZ), the Pancreatic Cancer Action Network (GM), the Lustgarten Foundation (GM), and National Institute of Health Awards CA155649 (GM), CA168611 (GM), and CA193111 (GM, ATH). We thank the New York University Langone Medical Center (NYU LMC) Histopathology Core Facility, the NYU LMC Flow Cytometry Core Facility, the NYU LMC Microscopy Core Facility, and the NYU LMC BioRepository Center, each supported in part by the Cancer Center Support Grant P30CA016087 and by grant UL1 TR000038 from the National Center for the Advancement of Translational Science (NCATS).
Footnotes
Author Contributions
LS (In vivo experiments, flow cytometry; analysis and interpretation; manuscript preparation; statistical analysis; co-first author), GW (In vivo experiments, flow cytometry; analysis and interpretation; manuscript preparation; statistical analysis; co-first author), ST (in vivo experiments, IHC), NNGL (western blotting), SA (IHC), DA (flow cytometry), AA (tissue culture, cell line generation), RB (technical assistance, critical review), DD (flow cytometry, critical review), SHG (mouse breeding, critical review), ATH (technical assistance, critical review), MP (western blotting, flow cytometry, critical review), AO (Immunoprecipitation), CPZ (technical advice, PCR, flow cytometry), MP (western blotting), MR (genotyping), DT (animal breeding, in vivo tumor experiments), CH (histological analysis), MH (FACS, data analysis), VRM (FACS, data analysis), DE (cell line creation, in vivo experiments), GM (analysis and interpretation; study concept and design; study supervision; critical review).
None of the authors has any potential conflict of interest related to this manuscript.
References
- 1.Johnstone RW, Ruefli AA, Lowe SW. Apoptosis: a link between cancer genetics and chemotherapy. Cell. 2002;108:153–164. doi: 10.1016/s0092-8674(02)00625-6. [DOI] [PubMed] [Google Scholar]
- 2.Fernald K, Kurokawa M. Evading apoptosis in cancer. Trends Cell Biol. 2013;23:620–633. doi: 10.1016/j.tcb.2013.07.006. [DOI] [PMC free article] [PubMed] [Google Scholar]
- 3.Lowe SW, Lin AW. Apoptosis in cancer. Carcinogenesis. 2000;21:485–495. doi: 10.1093/carcin/21.3.485. [DOI] [PubMed] [Google Scholar]
- 4.Holler N, et al. Fas triggers an alternative, caspase-8-independent cell death pathway using the kinase RIP as effector molecule. Nat Immunol. 2000;1:489–495. doi: 10.1038/82732. [DOI] [PubMed] [Google Scholar]
- 5.Vanden Berghe T, Linkermann A, Jouan-Lanhouet S, Walczak H, Vandenabeele P. Regulated necrosis: the expanding network of non-apoptotic cell death pathways. Nature reviews. Molecular cell biology. 2014;15:135–147. doi: 10.1038/nrm3737. [DOI] [PubMed] [Google Scholar]
- 6.Vandenabeele P, Galluzzi L, Vanden Berghe T, Kroemer G. Molecular mechanisms of necroptosis: an ordered cellular explosion. Nat Rev Mol Cell Biol. 2010;11:700–714. doi: 10.1038/nrm2970. [DOI] [PubMed] [Google Scholar]
- 7.Nagy A, et al. Copy number of cancer genes predict tumor grade and survival of pancreatic cancer patients. Anticancer Res. 2001;21:1321–1325. [PubMed] [Google Scholar]
- 8.Plath T, et al. Overexpression of pRB in human pancreatic carcinoma cells: function in chemotherapy-induced apoptosis. J Natl Cancer Inst. 2002;94:129–142. doi: 10.1093/jnci/94.2.129. [DOI] [PubMed] [Google Scholar]
- 9.Rosty C, et al. p16 Inactivation in pancreatic intraepithelial neoplasias (PanINs) arising in patients with chronic pancreatitis. Am J Surg Pathol. 2003;27:1495–1501. doi: 10.1097/00000478-200312000-00001. [DOI] [PubMed] [Google Scholar]
- 10.Takahashi H, et al. Simultaneous knock-down of Bcl-xL and Mcl-1 induces apoptosis through Bax activation in pancreatic cancer cells. Biochimica et biophysica acta. 2013;1833:2980–2987. doi: 10.1016/j.bbamcr.2013.08.006. [DOI] [PMC free article] [PubMed] [Google Scholar]
- 11.Ochi A, et al. Toll-like receptor 7 regulates pancreatic carcinogenesis in mice and humans. J Clin Invest. 2012;122:4118–4129. doi: 10.1172/JCI63606. [DOI] [PMC free article] [PubMed] [Google Scholar]
- 12.He S, et al. Receptor interacting protein kinase-3 determines cellular necrotic response to TNF-alpha. Cell. 2009;137:1100–1111. doi: 10.1016/j.cell.2009.05.021. [DOI] [PubMed] [Google Scholar]
- 13.Yatim N, et al. RIPK1 and NF-kappaB signaling in dying cells determines cross-priming of CD8(+) T cells. Science. 2015;350:328–334. doi: 10.1126/science.aad0395. [DOI] [PMC free article] [PubMed] [Google Scholar]
- 14.Connolly MK, et al. Distinct populations of metastases-enabling myeloid cells expand in the liver of mice harboring invasive and preinvasive intra-abdominal tumor. J Leukoc Biol. 2010;87:713–725. doi: 10.1189/jlb.0909607. [DOI] [PMC free article] [PubMed] [Google Scholar]
- 15.Acharyya S, et al. A CXCL1 paracrine network links cancer chemoresistance and metastasis. Cell. 2012;150:165–178. doi: 10.1016/j.cell.2012.04.042. [DOI] [PMC free article] [PubMed] [Google Scholar]
- 16.Yamasaki S, et al. Mincle is an ITAM-coupled activating receptor that senses damaged cells. Nat Immunol. 2008;9:1179–1188. doi: 10.1038/ni.1651. [DOI] [PubMed] [Google Scholar]
- 17.Wells CA, et al. The macrophage-inducible C-type lectin, mincle, is an essential component of the innate immune response to Candida albicans. J Immunol. 2008;180:7404–7413. doi: 10.4049/jimmunol.180.11.7404. [DOI] [PubMed] [Google Scholar]
References
- 18.Newton K, Sun X, Dixit VM. Kinase RIP3 is dispensable for normal NF-kappa Bs, signaling by the B-cell and T-cell receptors, tumor necrosis factor receptor 1, and Toll-like receptors 2 and 4. Mol Cell Biol. 2004;24:1464–1469. doi: 10.1128/MCB.24.4.1464-1469.2004. [DOI] [PMC free article] [PubMed] [Google Scholar]
- 19.Hingorani SR, et al. Preinvasive and invasive ductal pancreatic cancer and its early detection in the mouse. Cancer cell. 2003;4:437–450. doi: 10.1016/s1535-6108(03)00309-x. [DOI] [PubMed] [Google Scholar]
- 20.Hingorani SR, et al. Trp53R172H and KrasG12D cooperate to promote chromosomal instability and widely metastatic pancreatic ductal adenocarcinoma in mice. Cancer cell. 2005;7:469–483. doi: 10.1016/j.ccr.2005.04.023. [DOI] [PubMed] [Google Scholar]
- 21.Zambirinis CP, et al. TLR9 ligation in pancreatic stellate cells promotes tumorigenesis. J Exp Med. 2015;212:2077–2094. doi: 10.1084/jem.20142162. [DOI] [PMC free article] [PubMed] [Google Scholar]
- 22.Pylayeva-Gupta Y, Lee KE, Hajdu CH, Miller G, Bar-Sagi D. Oncogenic Kras-induced GM-CSF production promotes the development of pancreatic neoplasia. Cancer Cell. 2012;21:836–847. doi: 10.1016/j.ccr.2012.04.024. [DOI] [PMC free article] [PubMed] [Google Scholar]
- 23.Bedrosian AS, et al. Dendritic cells promote pancreatic viability in mice with acute pancreatitis. Gastroenterology. 2011;141:1915–1926. e1911–e1914. doi: 10.1053/j.gastro.2011.07.033. [DOI] [PMC free article] [PubMed] [Google Scholar]
- 24.Ochi A, et al. MyD88 inhibition amplifies dendritic cell capacity to promote pancreatic carcinogenesis via Th2 cells. J Exp Med. 2012;209:1671–1687. doi: 10.1084/jem.20111706. [DOI] [PMC free article] [PubMed] [Google Scholar]
- 25.Hruban RH, et al. Pancreatic intraepithelial neoplasia: a new nomenclature and classification system for pancreatic duct lesions. The American journal of surgical pathology. 2001;25:579–586. doi: 10.1097/00000478-200105000-00003. [DOI] [PubMed] [Google Scholar]
- 26.Kent WJ, et al. The human genome browser at UCSC. Genome research. 2002;12:996–1006. doi: 10.1101/gr.229102. Article published online before print in May 2002. [DOI] [PMC free article] [PubMed] [Google Scholar]
Associated Data
This section collects any data citations, data availability statements, or supplementary materials included in this article.


