

Abstract
Importance
Patient reported outcomes data is needed to determine the efficacy of cosmetic procedures.
Objective
To describe the development and psychometric evaluation of eight appearance scales and two adverse effects checklists for use in minimally invasive cosmetic procedures.
Design
Recruitment was between June 2010 and July 2014. Psychometric study to select the most clinically sensitive items for inclusion in item-reduced scales, and to examine reliability and validity with patients.
Setting
Plastic surgery and dermatology outpatient clinics in the USA and Canada and a clinical trial of a minimally invasive lip treatment in the United Kingdom and France.
Participants
Pre- and post-treatment facial aesthetic patients aged 18 years and older consulting for any type of facial aesthetic treatment.
Main Outcome(s) and Measure(s)
FACE-Q scales measuring appearance of the skin, lips and rhytides (i.e., overall, forehead, glabella, lateral periorbital area and lips and marionette lines). Scale scores range from 0 (lowest) to 100 (highest). FACE-Q adverse effects checklists for problems following skin and lip treatment.
Results
The sample (783) included 503 patients (response rate 90%) and 280 clinical trial participants. Rasch Measurement Theory analyses led to the refinement of 8 appearance scales with 66 total items. All FACE-Q scale items had ordered thresholds and acceptable item fit. Reliability, measured with the Personal Separation Index (0.88 to 0.95) and Cronbach alpha (0.93 to 0.98), was high. Lower scores for appearance scales measuring the skin, lips and lip rhytides correlated with the reporting of more skin- and lip-related adverse effects. Higher scores for the 8 appearance scales correlated (range 0.70 to 0.28) with higher scores on the core 10-item FACE-Q Satisfaction with Facial Appearance scale. In the pre-treatment group, older age was significantly correlated with lower scores on 5/6 rhytide scales (exception forehead rhytides). Pre-treatment patients reported significantly lower scores on 7/8 appearance scales compared with post-treatment patients (exception skin).
Conclusion and Relevance
FACE-Q appearance scales and adverse effects checklists can be used in clinical practice, research and quality improvement to incorporate cosmetic patients’ perspective in outcome assessments.
INTRODUCTION
In 2014, 13.9 million minimally-invasive cosmetic procedures were performed in the USA representing an increase of 3 percent over the year before [1]. In order to include the patient voice in the assessment of treatment outcomes in the cosmetics industry, patient-reported outcome (PRO) instruments are needed [2]. A review of PRO instruments in 96,736 registered clinical trials between 2007 and 2013 showed that 27 percent used one or more, with 17 percent as a primary or secondary endpoint [3]. The choice of which PRO instrument to use in a study is a crucial decision. If the wrong instrument is used, it may appear that a new aesthetic product or intervention has little to no benefit.
Engaging patients in the identification of issues that matter to them, and using their stories to develop PRO instruments, can help to ensure content validity [4–6]. Unfortunately, few such instruments are available for cosmetic treatments. A literature review to identify PRO instruments for cosmetic procedures [7] found nine of which three met international recommendations for how such tools should be developed and validated, i.e., BREAST-Q [8–9], FACE-Q [10] and Skindex [11]. The review concluded that research dedicated to the evaluation of PRO instruments in cosmetic surgery is urgently required.
The FACE-Q [10, 12–16] is a PRO instrument that includes 40 plus scales and checklists designed to measure appearance, adverse effects, health-related quality of life (HRQL) and experience of health care. These domains form the basis of the FACE-Q conceptual framework. Each domain contains multiple scales and checklists. Due to the large number of scales, validation results are being published as a series of papers, each of which describes clinically relevant groupings. The aim of this paper is to describe the set of FACE-Q scales/checklists that can be used to evaluate minimally invasive cosmetic procedures. Specifically, here we describe our psychometric findings for eight appearance scales designed to evaluate skin, lips and rhytides (overall, forehead, glabella, lateral periorbital area, lips and marionette lines). We also describe two checklists designed to measure adverse effects for skin and lip treatment.
METHODS
Prior to study commencement, research ethics approval was obtained at The New School in New York City, University College London Hospitals NHS Foundation Trust in London, and University of British Columbia in Vancouver.
The FACE-Q was developed by following the USA FDA guidance to industry [2, 17] and other guidance documents [5–6]. We describe our methodology elsewhere [13, 18–20]. Briefly, a systematic review [21], qualitative interviews with 50 facial aesthetic patients, and input from 26 experts were used to develop the FACE-Q conceptual framework and scales/checklists. The content of each scale was then refined through cognitive interviews with 35 patients. We developed four response options in keeping with best practice [22]. Instructions ask respondents to answer in relation to the past week.
The scales for skin and lips measure satisfaction with appearance. The six scales that measure appearance of rhytides (overall, forehead, glabella, lateral periorbital area and lips and marionette lines), and the adverse effect checklists (skin and lips), evaluate how bothered someone is by these concepts. e-Table 1 in the Supplement shows the content and response options for the scales and checklists.
For validation purposes, we included three additional FACE-Q scales: 10-item Satisfaction with Facial Appearance scale, 10-item psychological Function scale and 8-item Social Function scale. These scales previously demonstrated reliability, validity and the ability to detect change [8, 15]. Participants were also asked questions so the sample could be characterized by age, gender and ethnicity.
Inclusion criteria for the study were any patient aged 18 years or older who was pre- or post-treatment for one or more of any type of surgical or nonsurgical facial aesthetic treatment. For minimally invasive treatments, returning patients asked to participant, those who were more than four months post-treatment for Botulinum toxin, and who were more nine months post-treatment for soft tissue fillers, were considered to be pre-treatment subjects in our study sample. Participants were recruited from four dermatology and eleven plastic surgery offices in the USA and Canada between June 2010 and July 2014. For eleven clinics, staff provided a questionnaire booklet to complete in the waiting room at check-in. The remaining clinics invited patients to participate via a postal survey that included a personalized letter from the relevant health care provider alongside a questionnaire booklet with up to 3 mailed reminders. Potential participants were provided a five dollar coffee card in appreciation of their participation. Completion of the FACE-Q questionnaire implied consent.
Study 2: Data Collection
An international randomized, 2-arm, active-controlled study [23] recruited patients aged 18 years and older for a volume enhancement lip treatment. Participants were recruited from 12 sites in the United Kingdom and France. The treatment injection volume was based on clinical experience and subject lip treatment goals. Vermilion body and vermilion border were the primary treatment site; additional perioral sites could also be treated. This study was approved by independent ethics committees. All subjects provided written informed consent. More details about the study sample and methods are published elsewhere [23].
The scales measuring lips and Satisfaction with Facial Appearance were administered on days 0, 30 and 90. The scales measuring lip rhytides and Psychological and Social Function were administered on days 0, 14, 30 and 90. The adverse effects checklist for lips was administered on days 14 and 30. These scales were translated into French by MAPI Research Trust, following their linguistic validation methodology, which includes two separate forward translations by two qualified translators, a reconciliation process, and one backward translation by a qualified translator [24].
Analysis
For the adverse effect checklists, the proportion of responses for each response option was computed. For the appearance scales, Rasch Measurement Theory (RMT) [25–26] was conducted within RUMM2030 software [27]. RMT examines the difference between observed and predicted item responses to determine if data from a sample fit the Rasch model [28]. The results from a range of statistical and graphical tests were examined, with the evidence considered together to make a decision about each scale’s overall quality [28–30]. We performed the following:
Threshold for item response options: We examined the ordering of thresholds, which are the points of crossover between adjacent response categories (e.g., between Somewhat Satisfied and Very Satisfied) to determine if successive integer scores increased for the construct measured.
Item fit statistics: For each scale, we examined three indicators of fit to determine if the scale’s items worked together to map out a clinically important construct: (1) log residuals (item–person interaction); (2) Chi-square values (item–trait interaction); and (3) Item characteristic curves (ICC). The criteria for fit residuals should fall between −2.5 and +2.5. The Chi-square value for each item should be non-significant after Bonferroni adjustment.
Dependency: Residual correlations between items in a scale can artificially inflate reliability. We examined residual correlations between items, which should be below 0.30 [31].
Stability: Differential item functioning (DIF) measures the degree to which item performance remains stable across subgroups. A Chi-square value significant after Bonferroni adjustment can indicate an item with potential DIF. We examined DIF by age, gender and country.
Targeting: Targeting can be examined by inspecting the spread of person (range of the construct reported by the sample) and item (range of the construct measured by the items) locations. Items in a scale should be evenly spread across a reasonable range that matches the range of the construct experienced by the sample.
Person separation index (PSI): We examined reliability using the PSI, a statistic that is comparable to Cronbach’s alpha [32]. The PSI measures error associated with the measurement of people in a sample. Higher values indicate greater reliability.
We also computed a Cronbach alpha for each scale, which provides a measure of how closely related a set of items are as a group [32]. Rasch logit scores for each participant were transformed into scores from 0 (worst) to 100 (best). The scoring algorithm is available from the authors. Pearson correlations to examine associations between scores, and independent samples t-tests used to test for differences between means, were used to test the following hypotheses:
Higher scores on the appearance scales group would correlate with higher scores for Satisfaction with Facial Appearance, Psychological Function and Social Function.
Lower scores on the skin scales would correlate with more adverse effects for skin. Similarly, lower scores on the lips and lip rhytides scales would correlate with more adverse effects for lips on the day 14 assessment.
Before treatment, older participants would report lower scores on the six rhytides scales compared with younger participants.
-
Pre-treatment participants would report lower scores on all eight scales compared with post-treatment patients.
P-values less than 0.05 considered statistically significant.
RESULTS
Response rate
A total of 503 out of 558 patients invited to participate completed a FACE-Q booklet containing one more of the scales described in this study (response rate 90 percent). Additionally, 280 individuals participated in the lip enhancement clinical trial, for a total of 783 participants. Table 1 shows sample characteristics. When we compared the field-test sample with the clinical trial sample, mean age did not differ (p=0.77 on independent sample t-test), but gender did (p<0.001 on Chi-square test). Specifically, the clinical trial sample had fewer than expected men (9 versus 2 percent).
Table 1.
Patient characteristics
| Fieldtest | Clinical Trial | |
|---|---|---|
| Number of participants | 503 | 280 |
| Age (years) | ||
| Mean (SD) | 47.4 (14.0) | 47.7 (12.3) |
| Range | 18 to 80 | 18 to 76 |
| Gender, N (%)* | ||
| Female | 429 (85.3) | 274 (97.9) |
| Male | 46 (9.1) | 6 (2.1) |
| Missing | 28 (5.6) | – |
| Ethnicity, N (%) | ||
| White | 357 (71.0) | – |
| Other | 105 (20.9) | – |
| Missing | 41 (8.2) | – |
| Country, N (%) | ||
| USA | 347 (69.0) | – |
| Canada | 156 (31.0) | – |
| United Kingdom | – | 96 (34.3) |
| France | – | 184 (65.7) |
| Number of assessments, N (%) | 536 | 1082 |
| 1 | 496 (94.4) | – |
| 2 | 23 (4.6) | – |
| 3 | 5 (1.0) | – |
| 4 | – | 280 (100) |
| Timing of assessment, N (%) | ||
| Pre-treatment | 215 (40.1) | 280 (25.9) |
| Post-treatment | 321 (59.9) | 802 (74.1) |
| Procedure, N (%) | ||
| Minimally Invasive | 397 (74.1) | 280 (100.0) |
| Surgical | 127 (23.7) | – |
| Surgical and Minimally Invasive | 12 (2.2) | – |
| Type Minimally Invasive | ||
| Botox | 181 (33.8) | – |
| Filler | 123 (23.0) | 280 (100.0) |
| Skin treatment | 124 (23.1) | – |
| Other | 4 (0.1) | – |
| Type Surgical | ||
| Antiaging: facelift, blepharoplasty, brow lift, neck lift | 96 (17.9) | |
| Other surgery: rhinoplasty, jaw, chin | 43 (8.0) | |
| Scales/checklists completed, N (%) | ||
| Skin | 130 (24.3) | – |
| Lips | – | 809 (74.8) |
| Rhytides Overall | 163 (30.4) | – |
| Forehead Rhytides | 188 (35.1) | – |
| Glabella Rhytides | 173 (32.3) | – |
| Lateral periorbital area Rhytides | 210 (39.2) | – |
| Lip Rhytides | – | 1076 (99.5) |
| Marionette Lines | 280 (52.2) | – |
| Skin Adverse Effects | 74 (13.8) | – |
| Lip Adverse Effects | – | 534 (49.4) |
| Facial Appearance | 523 (97.6) | 800 (73.9) |
| Psychological Function | 177 (33.0) | 1076 (99.5) |
| Social Function | 178 (33.2) | 1075 (99.4) |
SD, Standard Deviation;
clinical trial had fewer men than field-test sample (p<.001 on Chi-square test).
Adverse Effects
The checklist measuring adverse effects of the skin was completed by 74 participants on average 2.4 (SD=3.6) months after a skin treatment (range immediate to 12 months). The top three items endorsed included redness, uneven skin tone and skin sensitivity (see Table 2).
Table 2.
Number (%) to report each adverse effect by the 74 participants who completed the Skin Adverse Effects checklist and the 280 participants who completed the Lips Adverse Effects checklist 14 days following a minimally invasive treatment
| Skin Adverse Effects | Not at all | A little | Moderately | Extremely |
|---|---|---|---|---|
| 1. Redness? | 20 (27.0) | 34 (45.9) | 13 (17.6) | 7 (9.5) |
| 2. Uneven skin tone (darker and lighter areas)? | 22 (29.7) | 25 (33.8) | 19 (25.7) | 8 (10.8) |
| 3. Skin sensitivity (e.g. to sunlight, skin products)? | 26 (35.6) | 22 (30.1) | 17 (23.3) | 8 (11.0) |
| 4. Parts of your face looking blotchy? | 27 (37.0) | 23 (31.5) | 19 (26.0) | 4 (5.5) |
| 5. Parts of your face not looking smooth? | 28 (37.8) | 30 (40.5) | 14 (18.9) | 2 (2.7) |
| 6. Parts of your face not feeling smooth to the touch? | 35 (47.3) | 24 (32.4) | 14 (18.9) | 1 (1.4) |
| 7. Tightness? | 39 (53.4) | 24 (32.9) | 8 (11.0) | 2 (2.7) |
| 8. Itching? | 47 (65.3) | 17 (23.6) | 6 (8.3) | 2 (2.8) |
| 9. Parts of your face looking scarred? | 47 (63.5) | 15 (20.3) | 9 (12.2) | 3 (4.1) |
| 10. Burning? | 54 (74.0) | 12 (16.4) | 6 (8.2) | 1 (1.4) |
| Lip Adverse Effects | Not at all | A little | Moderately | Extremely |
| 1. Your lips not feeling smooth (lumps, bumps)? | 180 (66.7) | 67 (24.8) | 16 (5.9) | 7 (2.6) |
| 2. Your lips looking asymmetric (uneven)? | 201 (74.4) | 59 (21.9) | 9 (3.3) | 1 (0.4) |
| 3. Your lips not looking smooth (lumps, bumps)? | 205 (76.2) | 47 (17.5) | 13 (4.8) | 4 (1.5) |
| 4. Swelling. | 223 (82.6) | 31 (11.5) | 15 (5.6) | 1 (0.4) |
| 5. Your lips feeling unnatural? | 225 (83.3) | 34 (12.6) | 9 (3.3) | 2 (0.7) |
| 6. Numbness. | 245 (90.7) | 19 (7.0) | 5 (1.9) | 1 (0.4) |
| 7. Difficulty moving your lips (e.g. laughing, smiling)? | 249 (92.2) | 15 (5.6) | 5 (1.9) | 1 (0.4) |
| 8. Your lips feeling too big? | 251 (93.0) | 17 (6.3) | 1 (0.4) | 1 (0.4) |
Note: Lip Adverse Effects checklist data from clinical trial is the day 14 assessment.
RMT Analysis
The RMT analysis supported the reliability and validity of the appearance scales. All 66 items had ordered thresholds, providing evidence that each scales’ response options worked as a continuum that increased for the construct measured. Fit residuals were within the −2.5 to +2.5 recommended range for 50/66 items (see eTable 2 in the Supplement) and 66/66 were not significant in terms of the Chi-square p-values providing evidence that the items fit the expectations of the Rasch model for each scale. The 16 items with fit outside the recommended range were retained due to their clinical importance. The item residuals were above 0.30 (range 0.35 to 0.59) for 6 pairs of items within 5 scales. Subtests performed on the pairs of items revealed marginal impact on scale reliability (0 to 0.01 difference in PSI value). For the scale measuring satisfaction with lips, DIF was detected for age and/or country on 5 items. When these items were split on the variable with DIF, and the new person locations for the scale were correlated with the original person locations, the DIF had a negligible impact (Pearson correlations were 0.99).
Figure 1 shows the person-item threshold distribution for the scale measuring rhytides overall as an example of targeting. The x-axis represents the construct (rhytide appearance), with higher scores (less bothered) increasing to the right. The y-axis shows the frequency of person measure locations (top histogram) and item locations (bottom histogram). In Figure 1a, the sample was divided into four groups based on their answer (“Not at all”, “A little”, “Moderately” or “Extremely”) to a stand-alone item that asked how bothered they were by: “How the lines on your face look overall?” In Figure 1b, the sample was divided into pre-or post-treatment groups. These examples provide evidence that the sample lay inside the range in which the scale provided measurement.
Figure 1a. Person-item-thresholds distribution for rhytides overall by response to question: “How the lines on your face look overall?”.
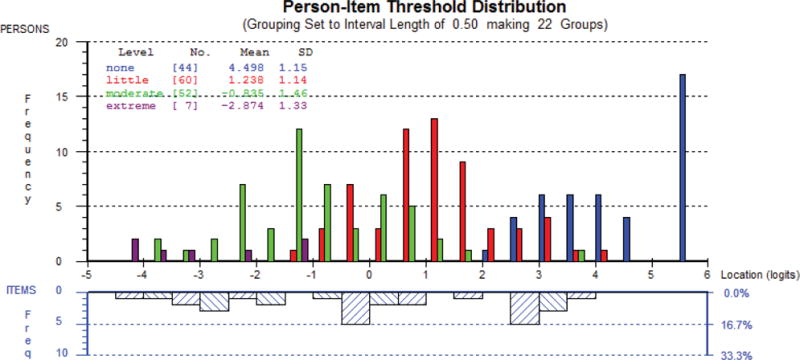
This figure shows a different pattern of responses for each of the response options, e.g., those “extremely bothered” by rhytides scored the lowest on the scale, and those “not at all bothered” scored the highest on the scale.
Figure 1b. Person-item-thresholds distribution for Rhytides Overall by pre- or post- treatment status.
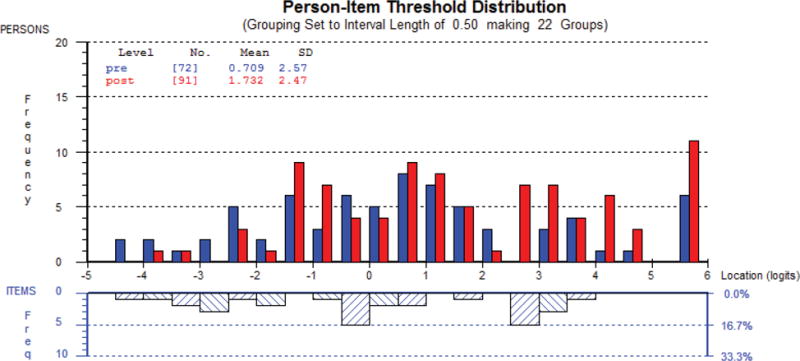
For the x-axis, higher scores (less bothered) increase to the right, and the y-axis shows the frequency of person measure locations (top histogram) and item locations (bottom histogram). – This figure shows that pre-treatment patients reported scores lower on the scale compared with post-treatment patients.
The p-values for fit to the Rasch model were not significant for 7/8 scales, which indicates that the data satisfied the requirements of the Rasch model. The p-value for the scale measuring lip rhytides was just marginally significant (p=0.02). The eight scales evidenced high reliability: PSI and Cronbach alpha values were as follows: skin (0.93, 0.93), lips (0.95, 0.97), and rhytides overall (0.93, 0.95) and on forehead (0.88, 0.95), glabella (0.91, 0.96), lateral periorbital area (0.92, 0.96), Lips (0.93, 0.97) and marionette lines (0.92, 0.98).
Construct Validity
Pearson correlations between the eight scales and Satisfaction with Facial Appearance scores were significant (p<0.001) and ranged from 0.70 (skin) to 0.28 (glabella rhytides). Correlations between the eight scales and Psychological Function were significant (p=0.03 to <0.001)) for 7/8 scales (exception glabella rhytides), and ranged from 0.51 (lateral periorbital area rhytides) to 0.32 (rhytides overall). Correlations between the eight scales and Social Function were significant for three scales, including lateral periorbital area rhytides (r=0.40, p<0.002), lips (r=0.35, p<0.001) and lip rhytides (r=0.28, p<0.001).
More skin-related adverse effects correlated with lower scores on the skin scale (r=−0.48, p<0.001). More lip-related adverse effects correlated with lower scores on the lip (r=−0.21, p=0.001) and lip rhytides (r=−0.32, p<0.001) scales.
In the pre-treatment group, correlations between older age and lower scores for the rhytides scales were significant for 5/6 (exception forehead rhytides): rhytides overall (r=−0.41, p<.001), and on glabella (r=−0.28, p=0.03), lateral periorbital area (r=−0.35, p=0.001), lips (r=−0.52, p<0.001) and marionette lines (r=−0.65, p<0.001). In the post-treatment group, age was not significantly correlated with scores from 5/6 rhytide scales (exception lip rhytides: r=−0.32, p<0.001).
Figure 2 shows the mean scores for the eight appearance scales for pre- and post-treatment data. Pre-treatment patients reported significantly lower scores on 7/8 scales (exception skin scale) compared with post-treatment patients (p-values ranged <0.001 to 0.005 on Independent Samples t-tests).
Figure 2. Mean scores for FACE-Q scales comparing pre-treatment with post-treatment data.
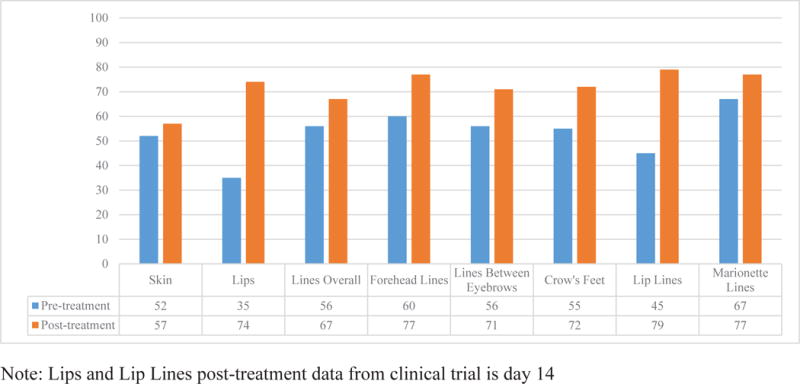
This figure shows that post-treatment participants reported better outcomes.
DISCUSSION
Growing acceptance of facial cosmetic treatments has led to an industry that continues to expand. Research is urgently needed to ensure that new treatments are both safe and effective. The FACE-Q is a rigorously developed PRO instrument that can be used by academics and clinicians to collect evidenced-based outcome data from facial aesthetic patients.
The FACE-Q is currently the only PRO instrument that includes scales measuring facial appearance. Some FACE-Q appearance scales ask about satisfaction with appearance, and other scales, for negative concepts such as rhytides, ask about being bothered by appearance. Other PRO instruments used in facial aesthetics research measure appearance-related psychosocial distress rather than appearance per se. For example, the rigorously developed 61-item Skindex [14] measures Negative Affect, Self-Esteem, Anxiety, Physical Discomfort, Physical Limitations, Self-consciousness and Intimacy. A PRO instrument that measures psychosocial issues would not be the best choice for measuring change in appearance.
The psychometric analyses in this paper provided evidence of reliability and validity of FACE-Q scales. Also, and fundamentally, our use of RMT methods to develop the FACE-Q has certain advantages. RMT methods differ from traditional psychometric methods (based on Classical Test Theory) as their focus is on the relationship between a person’s measurement and their probability of responding to an item, rather than the relationship between a person’s measurement and their observed scale total score [28]. Advantages of using RMT to develop PRO instruments include: 1) RMT provides measurements of people that are independent of the sampling distribution of the items used, and locates items in a scale independent of the sampling distribution of the people in whom they are developed; 2) RMT improves the potential to diagnose item-level psychometric issues; and 3) RMT allows for a more accurate picture of individual person measurements [28]. These assets, together with the extensive qualitative work done to create the FACE-Q, are what set the FACE-Q apart from other PRO instruments in the same clinical area.
This study has previously described limitations [10, 13–16]. First, the sample was heterogeneous (e.g., varied by age, gender, timing of assessment), which limits the outcome findings we can report. Second, our sample and that of the clinical trial had many more women than men, which reflects the make-up of cosmetic patients. Third, there could have been bias introduced at the clinic level by office staff who recruited their patients for us. Finally, few field-test participants completed the FACE-Q before and after treatment. Responsiveness research is needed to document the benefits of treatment for specific facial treatments.
To conclude, evidence-based information about patient outcomes for facial aesthetic treatments is needed. The FACE-Q provides the research community and clinicians with a PRO instrument they can use to include the patient voice in the assessment of outcomes.
Supplementary Material
Acknowledgments
We are indebted to the following clinicians who recruited their patients into the FACE-Q field-test: Drs D Berson, JC. Grotting, JM Kenkel, F Nahai, RJ Rohrich, A Rossi, JM Sykes, N Van Laeken, L Young and J Rivers. We would also like to thank Diane Murphy at Allergan Medical for providing FACE-Q data from their clinical trial.
Funding/Support: This study was supported by a grant from the Plastic Surgery Foundation.
Funding/Sponsor was involved?
Design and conduct of the study? NO
Collection, management, analysis, and interpretation of data? NO
Preparation, review, or approval of the manuscript? NO
Decision to submit the manuscript for publication? NO
Footnotes
Author Contributions: Drs AK, AP had full access to all the data in the study and take responsibility for the integrity of the data and the accuracy of the data analysis. Study concept and design: AK, SC and AP. Acquisition, analysis, and interpretation of data: AK, SC, JS, SB, AC, JC, AC, AP. Drafting of manuscript: AK. Critical revision of the manuscript for important intellectual content: AK, SC, JS, SB, AC, JC, AC, AP. Statistical analysis: AK, SC, AP. Obtained funding: AP, AK, SC. Administrative, technical or material support: AK, SC, JS, AP. Study supervision: AP.
Financial Disclosure (relationships relevant to this manuscript): The FACE-Q is owned by Memorial Sloan-Kettering Cancer Center. Drs Cano, Klassen and Pusic are co-developers of the FACE-Q and, as such, receive a share of any license revenues as royalties based on Memorial Sloan-Kettering Cancer Center’s inventor sharing policy.
Financial Disclosure (all other relationships): Dr Cano is co-founder of MODUS OUTCOMES, an outcomes research and consulting firm that provides services to pharmaceutical, medical device, and biotechnology companies. Drs A Carruthers and J Carruthers are consultants and investigators for Allergan, Merz, Kythera and Alphaeon.
Meeting where preliminary results were presented: Schwitzer J, Klassen AF, Cano SJ, Pusic AL. Measuring Outcomes That Matter to Cosmetic Patients: Development and Validation of the FACE-Q Satisfaction with Lips and Lip Lines Scales. Plast Reconstr Surg. 2014 Oct;134 (4S-1 Suppl):97 American Society of Plastic Surgeons (ASPS), Plastic Surgery Meeting; Chicago, IL. (October 2014). Oral
Contributor Information
Anne F Klassen, McMaster University, Hamilton Canada.
Stefan J Cano, Plymouth University Peninsula Schools of Medicine and Dentistry, Plymouth, UK.
Jonathan A Schwitzer, Memorial Sloan Kettering Cancer Center, New York USA; MedStar Georgetown University Hospital, Washington DC USA.
Stephen B Baker, MedStar Georgetown University Hospital, Washington DC USA.
Alastair Carruthers, University of British Columbia, Vancouver, Canada.
Jean Carruthers, University of British Columbia, Vancouver, Canada.
Anne Chapas, New York University School of Medicine, New York, NY, USA.
Andrea L Pusic, Memorial Sloan Kettering Cancer Center, New York USA.
References
- 1.American Society of Plastic Surgeons. Plastic Surgery Statistics Report. 2014 http://www.plasticsurgery.org/Documents/news-resources/statistics/2014-statistics/cosmetic-procedure-trends-2014.pdf. Accessed August 4, 2015.
- 2.U.S. Food and Drug Administration. The FDA’s Drug Review Process: Ensuring Drugs Are Safe and Effective. http://www.fda.gov/Drugs/ResourcesForYou/Consumers/ucm143534.htm. Accessed August 4, 2015. [PubMed]
- 3.Vodicka E, Kim K, Devine EB, Gnanasakthy A, Scoggins JF, Patrick DL. Inclusion of patient-reported outcome measures in registered clinical trials: Evidence from ClinicalTrials.gov (2007–2013) Contemp Clin Trials. 2015;43:1–9. doi: 10.1016/j.cct.2015.04.004. [DOI] [PubMed] [Google Scholar]
- 4.Food and Drug Administration. Clinical Outcome Assessment Qualification Program. http://www.fda.gov/Drugs/DevelopmentApprovalProcess/DrugDevelopmentToolsQualificationProgram/ucm284077.htm. Accessed August 4, 2015.
- 5.Patrick DL, Burke LB, Gwaltney CJ, et al. Content validity–establishing and reporting the evidence in newly developed patient-reported outcomes (PRO) instruments for medical product evaluation: ISPOR PRO good research practices task force report: part 1–eliciting concepts for a new PRO instrument. Value Health. 2011;14(8):967–977. doi: 10.1016/j.jval.2011.06.014. [DOI] [PubMed] [Google Scholar]
- 6.Patrick DL, Burke LB, Gwaltney CJ, et al. Content validity–establishing and reporting the evidence in newly developed patient-reported outcomes (PRO) instruments for medical product evaluation: ISPOR PRO Good Research Practices Task Force report: part 2–assessing respondent understanding. Value Health. 2011;14(8):978–988. doi: 10.1016/j.jval.2011.06.013. [DOI] [PubMed] [Google Scholar]
- 7.Morley D, Jenkinson C, Fitzprick R. A structured review of patient-reported outcome measures used in cosmetic surgical procedures: Report to Department of Health, 2013. http://phi.uhce.ox.ac.uk/pdf/Cosmetic%20Surgery%20PROMs%20Review26,9,2013.pdf. Accessed April 1, 2014.
- 8.Pusic AL, Klassen AF, Scott AM, Klok JA, Cordeiro PG, Cano SJ. Development of a new patient-reported outcome measure for breast surgery: the BREAST-Q. Plast Reconstr Surg. 2009;124(2):345–353. doi: 10.1097/PRS.0b013e3181aee807. [DOI] [PubMed] [Google Scholar]
- 9.Cano SJ, Klassen AF, Scott AM, Cordeiro PG, Pusic AL. The BREAST-Q: further validation in independent clinical samples. Plast Reconstr Surg. 2012;129(2):293–302. doi: 10.1097/PRS.0b013e31823aec6b. [DOI] [PubMed] [Google Scholar]
- 10.Pusic A, Klassen AF, Scott AM, Cano SJ. Development and psychometric evaluation of the FACE-Q Satisfaction with Appearance Scale: A new PRO instrument for facial aesthetics patients. Clin Plast Surg. 2013;40(2):249–260. doi: 10.1016/j.cps.2012.12.001. [DOI] [PubMed] [Google Scholar]
- 11.Chren M, Lasek RJ, Quinn LM, Mostow EN, Zyzanski SJ. Skindex, a quality-of-life measure for patients with skin disease: Reliability, validity, and responsiveness. J Invest Derm. 1996;107:707–713. doi: 10.1111/1523-1747.ep12365600. [DOI] [PubMed] [Google Scholar]
- 12.Klassen AF, Cano SF, Scott A, Snell L, Pusic AL. Measuring patient-reported outcomes in facial aesthetic patients: Development of the Face-Q. Facial Plast Surg. 2010;26(4):303–309. doi: 10.1055/s-0030-1262313. [DOI] [PubMed] [Google Scholar]
- 13.Panchapakesan V, Klassen AF, Cano SJ, Scott AM, Pusic AL. Development and Psychometric Evaluation of the FACE-Q Aging Appraisal Scale and Patient-Perceived Age Visual Analog Scale. Aesthet Surg J. 2013;33(8):1099–1109. doi: 10.1177/1090820X13510170. [DOI] [PubMed] [Google Scholar]
- 14.Klassen AF, Cano SJ, Scott AM, Pusic AL. Measuring outcomes that matter to facelift patients: development and validation of FACE-Q Appearance Appraisal Scales and Adverse Effects Checklist for the lower face and neck. Plast Reconstr Surg. 2014;133(1):21–30. doi: 10.1097/01.prs.0000436814.11462.94. [DOI] [PubMed] [Google Scholar]
- 15.Klassen AF, Cano SJ, Schwitzer J, Scott AM, Pusic AL. FACE-Q scales for health-related quality of life, early life impact and satisfaction with outcomes and decision to have treatment: development and validation. Plast Reconstr Surg. 2015;135(2):375–386. doi: 10.1097/PRS.0000000000000895. [DOI] [PubMed] [Google Scholar]
- 16.Klassen AF, Cano SJ, East C, et al. Development and psychometric evaluation of FACE-Q scales for rhinoplasty patients. JAMA Facial Plast Surg. 2015 Nov; doi: 10.1001/jamafacial.2015.1445. Epub ahead of print. [DOI] [PMC free article] [PubMed] [Google Scholar]
- 17.International Society for Pharmacoeconomics and Outcomes Research. Guidance for industry: Patient-reported outcome measures: Use in medical product development to support labeling claims. doi: 10.1186/1477-7525-4-79. http://www.ispor.org/workpaper/FDA%20PRO%20Guidance.pdf. Accessed April 1, 2014. [DOI] [PMC free article] [PubMed]
- 18.Brod M, Tesler LE, Christensen TL. Qualitative research and content validity: developing best practices based on science and experience. Qual Life Res. 2009;18(9):1263–1278. doi: 10.1007/s11136-009-9540-9. [DOI] [PubMed] [Google Scholar]
- 19.Lasch KE, Marquis P, Vigneux M, et al. PRO development: Rigorous qualitative research as the crucial foundation. Qual Life Res. 2010;19(8):1087–96. doi: 10.1007/s11136-010-9677-6. [DOI] [PMC free article] [PubMed] [Google Scholar]
- 20.Aaronson N, Alonso J, Burnam A, et al. Assessing health status and quality of life instruments: Attributes and review criteria. Qual Life Res. 2002;11(3):193–205. doi: 10.1023/a:1015291021312. [DOI] [PubMed] [Google Scholar]
- 21.Kosowski TR, McCarthy C, Reavey PL, et al. A systematic review of patient reported outcome measures after facial cosmetic surgery and/or non-surgical facial rejuvenation. Plast Reconstr Surg. 2009;123(6):1819–1827. doi: 10.1097/PRS.0b013e3181a3f361. [DOI] [PubMed] [Google Scholar]
- 22.Khadka J, Gothwal VK, McAlinden C, Lamoureux EL, Pesudovs K. The importance of rating scales in measuring patient-reported outcomes. Health Qual Life Outcomes. 2012;10:80. doi: 10.1186/1477-7525-10-80. [DOI] [PMC free article] [PubMed] [Google Scholar]
- 23.Raspaldo H, Chantrey J, Belhaouari L, Saleh R, Murphy DK. Juvederm volbella with lidocaine for lip and perioral enhancement: a prospective, randomized, controlled trial. Plast Reconstr Surg Glob Open. 2015;3(3):e21. doi: 10.1097/GOX.0000000000000266. [DOI] [PMC free article] [PubMed] [Google Scholar]
- 24.Acquadro C, Conway K, Girourdet C, Mear I. Linguistic Validation Manual for Patient-Reported Outcomes (PRO) Instruments. Lyon: MAPI Research Trust; 2004. [Google Scholar]
- 25.Andrich D. Controversy and the Rasch model: a characteristic of incompatible paradigms? Med Care. 2004;42:17–16. doi: 10.1097/01.mlr.0000103528.48582.7c. [DOI] [PubMed] [Google Scholar]
- 26.Wright B, Masters G. Rating scale analysis: Rasch measurement. Chicago: MESA; 1982. [Google Scholar]
- 27.Andrich D, Sheridan B. RUMM2030. Perth (Australia): RUMM Laboratory; 1997–2011. [Google Scholar]
- 28.Hobart J, Cano S. Improving the evaluation of therapeutic intervention in MS: the role of new psychometric methods. Health Technol Assess. 2009;13(12):1–200. doi: 10.3310/hta13120. [DOI] [PubMed] [Google Scholar]
- 29.Andrich D. Rasch Models for Measurement. Newbury Park, Calif: Sage; 1988. [Google Scholar]
- 30.Rasch G. Probabilistic Models for Some Intelligence and Attainment Tests. Copenhagen: Danish Institute for Education Research; 1960. [Google Scholar]
- 31.Wright BD, Masters G. Rating scale analysis: Rasch measurement. Chicago: MESA; 1982. [Google Scholar]
- 32.Cronbach LJ. Coefficient alpha and the internal structure of tests. Psychometrika. 1951;16(3):297–334. [Google Scholar]
Associated Data
This section collects any data citations, data availability statements, or supplementary materials included in this article.