Abstract
Purpose
While it is well known that patients with CKD are at an increased risk for the development and progression of atherosclerosis it is not known whether arterial inflammation is increased in mild CKD. To compare arterial inflammation using 18-F-fluorodeoxyglucose positron emission tomography/computed tomography imaging (FDG-PET/CT) in patients with chronic kidney disease (CKD) with matched controls.
Methods
One hundred twenty-eight individuals undergoing FDG-PET/CT imaging for clinical indications were studied retrospectively: 64 patients with Stage 3 CKD and 64 control patients were matched by age, gender, and cancer history. CKD was defined per guidelines with a calculated glomerular filtration rate (eGFR). Arterial inflammation was measured in the ascending aorta as FDG uptake by PET. Background FDG uptake (venous, subcutaneous fat (SAT) and muscle) were recorded. Coronary artery calcification (CAC) was assessed using the CT images. Thereafter, the impact of CKD on arterial inflammation and CAC was assessed.
Results
Arterial inflammation was higher in patients with CKD compared to matched controls (Standardized uptake value (SUV): 2.41±0.49 vs. 2.16±0.43; p=0.002). Arterial SUV correlated inversely with eGFR (r=−0.299, p=0.001). Venous SUV was also significantly elevated among CKD subjects, while SAT and muscle tissue SUVs did not differ between groups. Moreover, arterial SUV remained significantly elevated in CKD compared to controls after correcting for muscle or fat background, and further remained a significant after adjusting for clinical risk factors. Further, CKD was associated with arterial inflammation (SUV) independent of the presence of subclinical atherosclerosis (CAC).
Conclusions
Moderate CKD is associated with increased arterial inflammation beyond that of controls. Further, the increased arterial inflammation is associated with higher CAC. Current risk stratification tools may underestimate presence of atherosclerosis in patients with CKD and thereby risk of cardiovascular events.
Keywords: Atherosclerosis, Chronic kidney disease, FDG-PET/CT Inflammation
Introduction
Approximately 13 % of adults in the United States have chronic kidney disease (CKD), this figure is projected to rise to 14% in 2020 and 17% in 2030 [1]. Patients with CKD are at an increased risk for the development and progression of atherosclerosis [2, 3]. Furthermore, CKD is considered an independent risk factor for stroke and myocardial infarction [2, 3]. Although several risk factors such as hypertension, diabetes mellitus and dyslipidemia have been proposed as factors independently associated with heightened cardiovascular risk in patients with CKD, an unabated and persistent systemic inflammatory state is also thought to be an important contributor [4]. Moreover, previous research showed that elevated plasma levels of multiple inflammatory biomarkers were significantly associated with arterial calcification in CKD patients, even after adjusting for traditional risk factors [5].
18F-fluorodeoxyglucose-positron emission tomography (FDG-PET) allows for accurate non-invasive quantification of inflammation in target tissues [6, 7]. In particular, FDG-PET imaging of the arterial wall is a well-established and validated method to assess inflammatory burden in atherosclerotic plaques [8-10]. Previous studies demonstrated that arterial FDG uptake is reproducible and responds to therapies known to reduce atherosclerotic plaque inflammation [10-13]. Arterial FDG activity correlates with atheroma macrophage density [7], is higher after acute atherothrombotic events [8, 14], and predicts future cardiovascular events [10, 15, 16]. Accordingly, FDG PET/CT can be used as an imaging biomarker of atherosclerotic plaque inflammation of the arterial wall. It is unknown whether arterial inflammation on FDG PET/CT is increased in patients with mild CKD, which might explain the increase in cardiovascular events observed in this population. Therefore, the aim of this study was to assess arterial FDG activity in patients with and without CKD using PET/CT.
METHODS
Study Population
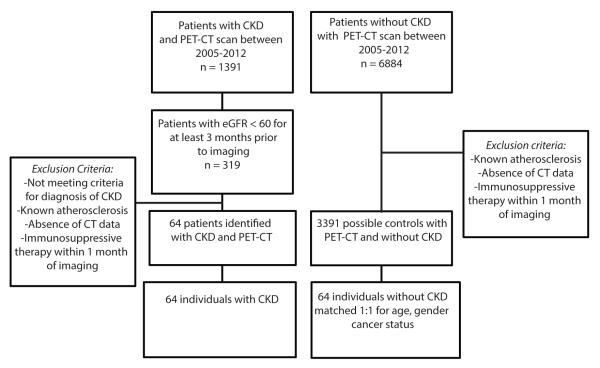
The research protocol was approved by the local Institutional Review Board. Individuals with CKD Stage 3 and without known clinically evident atherosclerotic disease (n= 64) were identified from a database of patients who had undergone FDG-PET/CT imaging for various clinical indications at Massachusetts General Hospital between 2005 and 2012 (figure 1). CKD stage 3 status was confirmed as estimated GFR (eGFR) between 30-59 mL/min per 1.73 m2, calculated by the CKD-EPI (CKD Epidemiology Collaboration) formula, for at least three months prior to imaging [17]. The control group included individuals with eGFR>60 mL/min per 1.73 m2 and no clinical diagnosis of CKD or clinical atherosclerosis, who were consecutively identified from the same database. The CKD subjects were 1:1 matched with controls according to age (±5 years), gender, and cancer history as determined by available clinical notes. PET/CT images were collected and clinical data were removed for a blinded analysis of the images. Exclusion criteria were absence of CT scan, known atherosclerotic disease and immunosuppressive therapy (intravenous and oral administration of corticosteroids, biological therapies and disease-modifying antirheumatic drugs) within one month of imaging.
Figure 1.
Flowchart shows study population enrollment
PET/CT Image Acquisition
Subjects underwent whole body FDG-PET/CT imaging performed per clinical protocol using Biograph 64 (Siemens Healthcare, Forchheim, Germany, or comparable system). All subjects fasted for at least 8 hours prior to intravenous FDG injection (approximately 370 MBq). After about 60 minutes, patients and controls were imaged for 15-20 minutes in the supine position. There were no adjustments in injected dose or in acquisition time according to body weight or renal function. PET images were acquired in 3D mode after obtaining a low-dose, non-gated, non-contrast CT (120 kV, 50 mA) for attenuation correction.
PET/CT Image Analysis
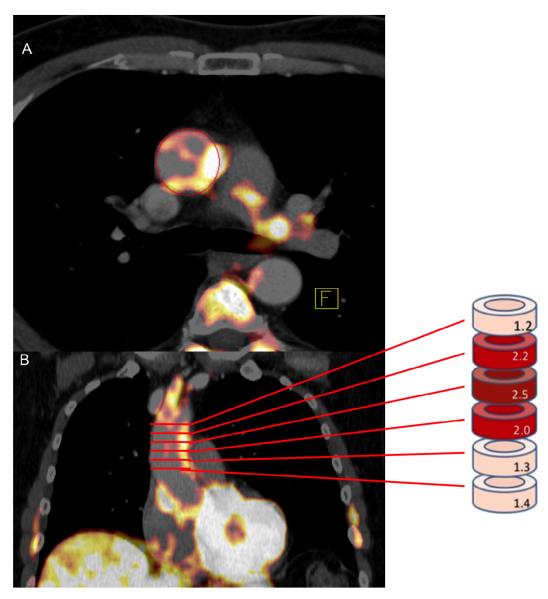
PET/CT images were analyzed by an experienced image analyst while blinded to the patients’ clinical information using previously described methods [18]. FDG uptake was measured within the wall of the ascending aorta in the axial plane starting 1 cm above the origin of coronary vessels and continuing up to the aortic arch in 5 mm increments (Figure 2). Arterial FDG uptake was recorded as a mean of maximum standardized uptake values (SUVmax) of all the slices.
Figure 2.
Image of PET analysis. SUV is measured in wall of the Ascending aorta in the axial plane (A) starting 1 cm above the origin of coronary vessels and continuing to the bottom of the aortic arch in 5 mm increments (B). Arterial FDG uptake was recorded as a mean of maximum standardized uptake values (SUVmax) of all the slices.
Mean SUVs were collected from the superior vena cava to obtain an average blood pool background FDG uptake. Due to the impaired renal function in CKD subjects, increased venous retention of FDG was anticipated which could result in increased venous background activity. Consequently, mean SUVs were also measured in the subcutaneous adipose tissue (SAT) and the pectoralis major muscle (muscle). Measurement of background FDG uptake (venous and muscle) was performed by placing regions of interest (ROI) and the average mean SUV was calculated. The background-corrected SUV was calculated as arterial SUV max minus the mean venous SUV (blood-subtracted SUV maximum: bsSUVmax) [19].
Coronary calcium score
All patients were quantitatively analyzed for coronary calcification by an independent investigator blinded to all clinical information and PET data using a dedicated workstation (Leonardo TrueD, Siemens Healthcare, Forchheim, Germany). Assessment of coronary artery calcium (CAC) was performed using a threshold of 130 Hounsfield Units [20]. The CAC scores were obtained from non-gated CT images acquired from a hybrid PET-CT scanner which have been shown to be comparable to those acquired from a dedicated CT scanner [21].
Subject Characteristics
The clinical and demographic characteristics of the study subjects are summarized in Table 1. 28 patients had CKD stage 3A and 36 CKD stage 3B. Significant differences were observed between CKD subjects and controls in BMI, diabetes mellitus, hypertension, anti-hypertensive treatment and eGFR.
Table 1.
Baseline Characteristics of Study Subjects
| Characteristics | Overall (n=128) |
CKD (n=64) |
Matched Controls (n=64) |
P-value |
|---|---|---|---|---|
| Age (years) | 67.5±9.8 | 68.6±10.1 | 66.3±9.4 | 0.192 |
| Male (%) | 68 (53.1) | 34 (53.1) | 34 (53.1) | 1.000 |
| BMI (kg/m2) | 28.0±6.6 | 29.8±7.5 | 26.3±5.0 | 0.004 |
| HDL | 50.5±15.0 | 48.7±16.2 | 52.0±13.9 | 0.298 |
| LDL | 100.4±32.1 | 94.6±28.3 | 105.3±34.4 | 0.113 |
| Triglyceride | 126.8±55.3 | 133.3±56.5 | 121.0±54.1 | 0.283 |
| Total cholesterol | 173.9±38.4 | 166.8±36.1 | 179.8±39.6 | 0.101 |
| Current smoker (%) | 13 (10.2) | 4 (6.3) | 9 (14.1) | 0.143 |
| Former smoker | 80 (54.7) | 33 (51.6) | 37 (57.8) | 0.594 |
| Diabetes Mellitus (%) | 33 (25.8) | 22 (34.4) | 11 (17.2) | 0.026 |
| Hyperlipidemia (%) | 84 (65.6) | 42 (65.6) | 42 (65.6) | 1.000 |
| Hypertension (%) | 98 (76.6) | 56 (87.5) | 42 (65.6) | 0.003 |
| No active cancer (%) | 45 (35.2) | 22 (34.4) | 23 (35.9) | 0.853 |
| Anti-hypertensive therapy (%) | 79 (61.7) | 52 (81.3) | 27 (42.2) | <0.001 |
| Statin Therapy (%) | 48 (37.5) | 27 (42.2) | 21 (32.8) | 0.273 |
| eGFR (mL/min/1.73m2) | 61.0±21.3 | 42.8±8.6 | 79.2±13.0 | <0.001 |
| Creatinine (mg/dL) | 1.21±0.41 | 1.52±0.35 | 0.89±0.17 | <0.001 |
| Framingham Risk Score * | 0.466 | |||
| Low (10-y risk <10%) | 51 (39.8) | 22 (34.4) | 29 (45.3) | |
| Medium (10-y risk 10%-20%) | 30 (23.4) | 14 (21.9) | 16 (25.0) | |
| High (10-y risk >20%) | 11 (8.6) | 7 (10.9) | 4 (6.3) |
BMI, body mass index; eGFR, estimated glomerfular filtration rate. All normally distributed Independent T test and Chi square test for frequencies.
available in 92 patients
Statistical Analysis
All results are presented as mean plus standard deviation (SD) or if not normally distributed as median plus 25th -75th percentile. Normal distribution was tested evaluating Quantile-Quantile plots. Student’s t-test was used to compare normal distributed variables. Fisher’s exact test was used for categorical variables. Univariate associations were tested using Pearson's correlation coefficients. Multivariable linear regression was used to evaluate associations between CKD status and arterial SUVmax after adjustment for SAT SUV, VAT SUV, age and gender, Framingham Risk Score (FRS) and presence of CAC. No adjustments were made for multiplicity of testing, and no imputation was used for missing values. Reported P-values are two-tailed; statistical significance was set at P<0.05. All statistical analyses were performed using SPSS (IBM Corp, Version 22.0. Armonk, NY, USA).
RESULTS
Background activity
As previously reported and as anticipated, we observed that venous background activity in the CKD group was significantly higher compared to the control group (1.23±0.22 vs. 1.13±0.24, p<0.020, in 128). Furthermore, there was a statistically significant negative correlation between venous activity and eGFR (r=−0.257, p=0.005).
In contrast, FDG uptake in SAT was not significantly higher compared to the control group (0.23±0.08 vs. 0.22±0.07, p=0.472, in 122), and no statistically significant correlation between SAT activity and eGFR was observed (r=−0.025, p=0.789). Also, FDG uptake in the skeletal muscle (pectoralis major) was not significantly different between CKD group and the matched controls (0.51±0.08 vs. 0.49±0.10, p=0.362 in 74), and no correlation with eGFR (r= −0.077, p=0.515).
Arterial FDG Uptake (SUV) is higher in individuals with CKD
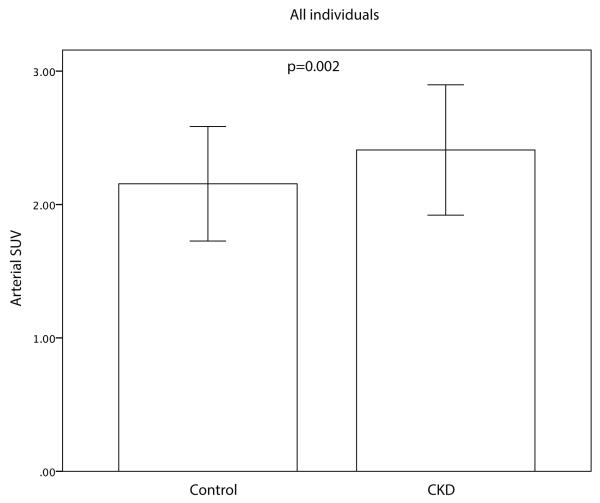
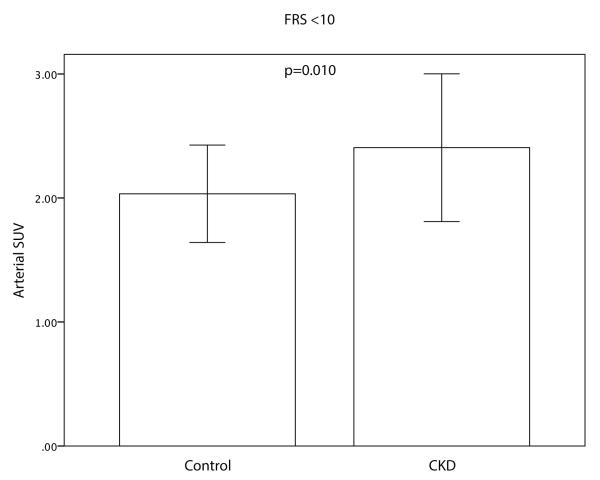
The mean maximal arterial FDG uptake (SUV) was significantly higher in CKD vs. matched controls (2.41±0.49 vs. 2.16±0.43; p=0.002, Figure 3a). Furthermore, a statistically significant negative correlation between arterial activity and eGFR (r=−0.299, p=0.001) was observed. Blood background corrected SUV (BsSUVmax) was also significantly higher in CKD patients (1.18±0.41 vs. 1.02±0.31; p=0.017). After adjusting for risk factors or background activity (subcutaneous fat or pectoralis muscle SUV) CKD status remained a significant predictor for FDG uptake (Table 2). Furthermore, arterial SUV was significantly higher in CKD group vs. control group in subjects with a low Framingham Risk Score (FRS<10) (2.41±0.60 vs. 2.03±0.39; p=0.010, Figure 3b).
Figure 3.
Differences in Arterial SUV between the CKD group and the matched control group and in all patients (A) and patients with low Framingham risk score (FRS<10) (b). CKD patients had an increased arterial FDG uptake compared to the control group. Error bars represent +/− 1 standard deviation.
Table 2.
Summary of regression analysis for Beta of CKD
| Beta | Standard error | P-value | |
|---|---|---|---|
| SUVMAX | 0.253 | 0.081 | 0.002 |
| SUVMAX Venous corrected | 0.135 | 0.066 | 0.041 |
| SUVMAX SAT corrected | 0.242 | 0.081 | 0.003 |
| SUVMAX Muscle corrected | 0.256 | 0084 | 0.003 |
| SUVMAX Age and gender corrected | 0.246 | 0.082 | 0.003 |
| SUVMAX FRS corrected | 0.287 | 0.101 | 0.006 |
|
SUVMAX Calcium presence
corrected |
0.253 | 0.082 | 0.003 |
Relationship between Arterial FDG Uptake and Coronary Calcium Score
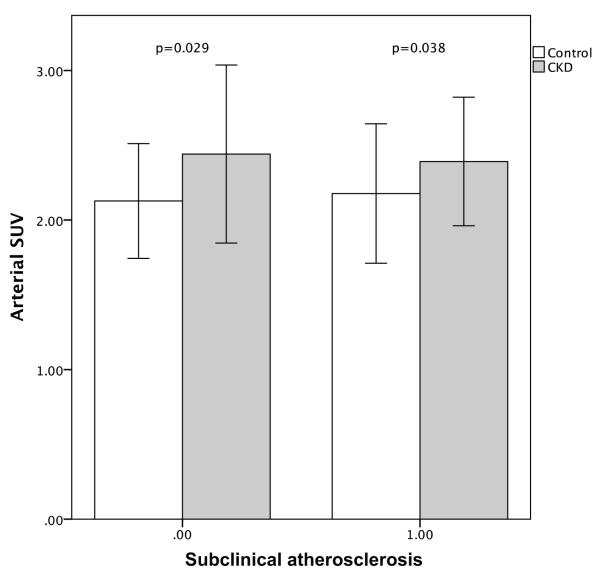
We observed a significant increase in arterial inflammation (arterial SUV) in individuals with CKD independent of the presence of subclinical atherosclerosis (presence or absence of CAC, Figure 4). Moreover, CKD significantly associated with arterial inflammation after correcting for the presence of sub-clinical atherosclerosis (Table 2). No significant difference (p=0.183) was observed in the presence of subclinical atherosclerosis in CKD patients compared to controls (positive CAC score 66% vs. 56%, respectively, p=0.183), furthermore, the total CAC scores were similar in CKD and control groups (59.1 [0.0-419.8] vs. 15.0 [0.0-229.8], p=0.208).
Figure 4.
Differences in Arterial SUV between the CKD group and the matched control group by presence of coronary artery calcification. CKD patients had a significant increased arterial FDG uptake compared to the control group independent of presence of CAC. Error bars represent +/− 1 standard deviation.
DISCUSSION
To our knowledge this is the first study to investigate arterial inflammation in patients with Stage 3 CKD. The principal finding of this study is that arterial FDG uptake is significantly higher in individuals with CKD compared to matched controls without CKD. This relationship persists within a subset of individuals with a low Framingham Risk Score and after correction for clinical risk factors. Furthermore, we demonstrate that the arterial SUV is associated with CAC in this population. Taken together, these data support the concept that CKD is associated with up-regulated arterial inflammation, which in turn may predispose patients with CKD to atherosclerotic plaque burden beyond that which is predicted by traditional risk assessment tools such as the FRS score.
Raggi et al.[22] showed that adult hemodialysis patients have a high prevalence of calcification of the coronary arteries, aorta and cardiac valves and that the prevalence of extent of vascular calcification was proportional to preexisting cardiovascular disease. Vascular calcifications in CKD patients are mainly related to age, duration of renal disease, and also possibly dyslipidemia [23]. Nonetheless, the complex pathogenesis of vascular calcification in CKD is still not completely understood [24]. In CKD patients we observed a significant increase in FDG uptake in those with and without subclinical atherosclerosis (e.g. a CAC of 0). Increased arterial inflammation might precede the development of more advanced atherosclerosis and could explain the increased deposition of CAC observed in prior studies [25]. CKD was associated with a significant increase in arterial FDG activity, even after adding clinical risk factors (e.g. age, gender and Framingham risk score) to the multivariate regression model. However, we did not observe a significant difference in the presence of CAC when comparing the CKD patients with controls. A possible explanation for this could be that we included only patients with moderate kidney disease
FDG PET is an established technique in neurology, oncology and cardiology [26]. 18F-FDG is excreted through the urinary system [27]. Hence, 18F-FDG excretion may be reduced in patient with CKD. Moreover, the kidneys play an important role in glucose homeostasis [28]. Laffon et al.[29] created a theoretic model to assess 18F-FDG uptake in a patient with renal failure. Their model showed that in case of severe renal failure, it takes longer to excrete the tracer, the tracer activity maximizes later and the tissue uptake is greater. We observed a significantly higher venous background activity in patients with CKD compared to match controls and a negative correlation between eGFR and venous SUV activity. Although the observed differences were significant the absolute difference in venous activity between CKD patients and matched controls was limited. Several possible reasons for the limited magnitude are: limited time between image acquisition and tracer injection, moderate CKD severity and effect of CKD on insulin sensitivity. SAT and muscle background SUV were similar between CKD patients and controls, and as such are better suited as a background-corrected SUV measure.
Limitations
The majority of participants had a prior history of treated cancer, which may limit the generalizability of our findings. The retrospective case-control study design does not allow us to infer causal relations and we can only speculate on the underlying mechanisms that drive the observed differences. We were also dependent on chart review for data collection, which can results in observational bias. Also, the population size is modest and the evaluations of the relationships between CKD and FDG activity were exploratory in nature. Finally, the cohort of patients with mild CKD disease (Stage 3), had significant higher prevalence of hypertension, diabetes mellitus and a higher mean BMI, which could potentially contribute to the observed difference in arterial inflammation. However, it is also worth noting that despite these small differences in single risk variables, the FRS did not differ between CKD and control groups. Furthermore, analysis of coronary artery calcium (CAC) demonstrated that there was no significant between-group difference in the presence of sub-clinical atherosclerosis. Moreover, when the analysis was repeated in the subset of individuals without evident subclinical CAD (those without any CAC), individuals with CKD still had higher arterial inflammation.
Conclusion
CKD is associated with increased arterial inflammation beyond that of controls. Current risk stratification tools may underestimate presence of atherosclerosis in patients with CKD. Prospective cohort studies are required to evaluate whether attenuation of the arterial inflammatory process will decrease cardiovascular events in CKD.
Acknowledgments
FUNDING SOURCES
F. Hoffmann-La Roche Ltd., Switzerland
Abbreviations
- CKD
Chronic Kidney Disease
- CT
Computed Tomography
- FDG
18F-fluorodeoxyglucose
- PET
positron emission tomography
Footnotes
DISCLOSURES
Jessica Mann, Robert A. Comley and Chek Ing Kiu Weber were employed by, and owned stock in, the pharmaceutical company F. Hoffmann-La Roche Ltd., Basel, Switzerland at the time of study conduct. All other authors have reported that they have no relationships relevant to the contents of this paper to disclose.
Statement of human rights
All procedures performed were in accordance with the ethical standards of the institutional and national research committee and with the 1964 Helsinki Declaration and its later amendments or comparable ethical standards. For this type of study, formal consent is not required.
REFERENCES
- 1.Hoerger TJ, Simpson SA, Yarnoff BO, Pavkov ME, Rios Burrows N, Saydah SH, et al. The Future Burden of CKD in the United States: A Simulation Model for the CDC CKD Initiative. American journal of kidney diseases : the official journal of the National Kidney Foundation. 2015;65:403–11. doi: 10.1053/j.ajkd.2014.09.023. doi:10.1053/j.ajkd.2014.09.023. [DOI] [PMC free article] [PubMed] [Google Scholar]
- 2.Go AS, Chertow GM, Fan D, McCulloch CE, Hsu CY. Chronic kidney disease and the risks of death, cardiovascular events, and hospitalization. The New England journal of medicine. 2004;351:1296–305. doi: 10.1056/NEJMoa041031. doi:10.1056/NEJMoa041031. [DOI] [PubMed] [Google Scholar]
- 3.Schiffrin EL, Lipman ML, Mann JF. Chronic kidney disease: effects on the cardiovascular system. Circulation. 2007;116:85–97. doi: 10.1161/CIRCULATIONAHA.106.678342. doi:10.1161/CIRCULATIONAHA.106.678342. [DOI] [PubMed] [Google Scholar]
- 4.Shlipak MG, Fried LF, Cushman M, Manolio TA, Peterson D, Stehman-Breen C, et al. Cardiovascular mortality risk in chronic kidney disease: comparison of traditional and novel risk factors. Jama. 2005;293:1737–45. doi: 10.1001/jama.293.14.1737. doi:10.1001/jama.293.14.1737. [DOI] [PubMed] [Google Scholar]
- 5.Kiu Weber CI, Duchateau-Nguyen G, Solier C, Schell-Steven A, Hermosilla R, Nogoceke E, et al. Cardiovascular risk markers associated with arterial calcification in patients with chronic kidney disease Stages 3 and 4. Clin Kidney J. 2014;7:167–73. doi: 10.1093/ckj/sfu017. doi:10.1093/ckj/sfu017. [DOI] [PMC free article] [PubMed] [Google Scholar]
- 6.Rennen HJ, Boerman OC, Oyen WJ, Corstens FH. Imaging infection/inflammation in the new millennium. European journal of nuclear medicine. 2001;28:241–52. doi: 10.1007/s002590000447. [DOI] [PubMed] [Google Scholar]
- 7.Tawakol A, Migrino RQ, Bashian GG, Bedri S, Vermylen D, Cury RC, et al. In vivo 18F-fluorodeoxyglucose positron emission tomography imaging provides a noninvasive measure of carotid plaque inflammation in patients. Journal of the American College of Cardiology. 2006;48:1818–24. doi: 10.1016/j.jacc.2006.05.076. doi:10.1016/j.jacc.2006.05.076. [DOI] [PubMed] [Google Scholar]
- 8.Rudd JH, Warburton EA, Fryer TD, Jones HA, Clark JC, Antoun N, et al. Imaging atherosclerotic plaque inflammation with [18F]-fluorodeoxyglucose positron emission tomography. Circulation. 2002;105:2708–11. doi: 10.1161/01.cir.0000020548.60110.76. [DOI] [PubMed] [Google Scholar]
- 9.Rudd JH, Myers KS, Bansilal S, Machac J, Pinto CA, Tong C, et al. Atherosclerosis inflammation imaging with 18F-FDG PET: carotid, iliac, and femoral uptake reproducibility, quantification methods, and recommendations. Journal of nuclear medicine : official publication, Society of Nuclear Medicine. 2008;49:871–8. doi: 10.2967/jnumed.107.050294. doi:10.2967/jnumed.107.050294. [DOI] [PubMed] [Google Scholar]
- 10.Figueroa AL, Abdelbaky A, Truong QA, Corsini E, MacNabb MH, Lavender ZR, et al. Measurement of arterial activity on routine FDG PET/CT images improves prediction of risk of future CV events. JACC Cardiovascular imaging. 2013;6:1250–9. doi: 10.1016/j.jcmg.2013.08.006. doi:10.1016/j.jcmg.2013.08.006. [DOI] [PubMed] [Google Scholar]
- 11.Rudd JH, Myers KS, Bansilal S, Machac J, Rafique A, Farkouh M, et al. (18)Fluorodeoxyglucose positron emission tomography imaging of atherosclerotic plaque inflammation is highly reproducible: implications for atherosclerosis therapy trials. Journal of the American College of Cardiology. 2007;50:892–6. doi: 10.1016/j.jacc.2007.05.024. doi:10.1016/j.jacc.2007.05.024. [DOI] [PubMed] [Google Scholar]
- 12.Tahara N, Kai H, Ishibashi M, Nakaura H, Kaida H, Baba K, et al. Simvastatin attenuates plaque inflammation: evaluation by fluorodeoxyglucose positron emission tomography. Journal of the American College of Cardiology. 2006;48:1825–31. doi: 10.1016/j.jacc.2006.03.069. doi:10.1016/j.jacc.2006.03.069. [DOI] [PubMed] [Google Scholar]
- 13.Wu YW, Kao HL, Huang CL, Chen MF, Lin LY, Wang YC, et al. The effects of 3-month atorvastatin therapy on arterial inflammation, calcification, abdominal adipose tissue and circulating biomarkers. European journal of nuclear medicine and molecular imaging. 2012;39:399–407. doi: 10.1007/s00259-011-1994-7. doi:10.1007/s00259-011-1994-7. [DOI] [PubMed] [Google Scholar]
- 14.Rogers IS, Nasir K, Figueroa AL, Cury RC, Hoffmann U, Vermylen DA, et al. Feasibility of FDG imaging of the coronary arteries: comparison between acute coronary syndrome and stable angina. JACC Cardiovascular imaging. 2010;3:388–97. doi: 10.1016/j.jcmg.2010.01.004. doi:10.1016/j.jcmg.2010.01.004. [DOI] [PubMed] [Google Scholar]
- 15.Rominger A, Saam T, Wolpers S, Cyran CC, Schmidt M, Foerster S, et al. 18F-FDG PET/CT identifies patients at risk for future vascular events in an otherwise asymptomatic cohort with neoplastic disease. Journal of nuclear medicine : official publication, Society of Nuclear Medicine. 2009;50:1611–20. doi: 10.2967/jnumed.109.065151. doi:10.2967/jnumed.109.065151. [DOI] [PubMed] [Google Scholar]
- 16.Paulmier B, Duet M, Khayat R, Pierquet-Ghazzar N, Laissy JP, Maunoury C, et al. Arterial wall uptake of fluorodeoxyglucose on PET imaging in stable cancer disease patients indicates higher risk for cardiovascular events. Journal of nuclear cardiology : official publication of the American Society of Nuclear Cardiology. 2008;15:209–17. doi: 10.1016/j.nuclcard.2007.10.009. doi:10.1016/j.nuclcard.2007.10.009. [DOI] [PubMed] [Google Scholar]
- 17.Levey AS, Stevens LA, Schmid CH, Zhang YL, Castro AF, 3rd, Feldman HI, et al. A new equation to estimate glomerular filtration rate. Annals of internal medicine. 2009;150:604–12. doi: 10.7326/0003-4819-150-9-200905050-00006. [DOI] [PMC free article] [PubMed] [Google Scholar]
- 18.Tawakol A, Fayad ZA, Mogg R, Alon A, Klimas MT, Dansky H, et al. Intensification of statin therapy results in a rapid reduction in atherosclerotic inflammation: results of a multicenter fluorodeoxyglucose-positron emission tomography/computed tomography feasibility study. Journal of the American College of Cardiology. 2013;62:909–17. doi: 10.1016/j.jacc.2013.04.066. doi:10.1016/j.jacc.2013.04.066. [DOI] [PubMed] [Google Scholar]
- 19.Blomberg BA, Thomassen A, de Jong PA, Simonsen J, Lam M, Nielsen A, et al. Impact of Personal Characteristics and Technical Factors on Quantification of Sodium 18F-Fluoride Uptake in Human Arteries: Prospective Evaluation of Healthy Subjects. Journal of nuclear medicine : official publication, Society of Nuclear Medicine. 2015 doi: 10.2967/jnumed.115.159798. doi:10.2967/jnumed.115.159798. [DOI] [PubMed] [Google Scholar]
- 20.Kirsch J, Buitrago I, Mohammed TL, Gao T, Asher CR, Novaro GM. Detection of coronary calcium during standard chest computed tomography correlates with multi-detector computed tomography coronary artery calcium score. The international journal of cardiovascular imaging. 2012;28:1249–56. doi: 10.1007/s10554-011-9928-9. doi:10.1007/s10554-011-9928-9. [DOI] [PubMed] [Google Scholar]
- 21.Einstein AJ, Johnson LL, Bokhari S, Son J, Thompson RC, Bateman TM, et al. Agreement of visual estimation of coronary artery calcium from low-dose CT attenuation correction scans in hybrid PET/CT and SPECT/CT with standard Agatston score. Journal of the American College of Cardiology. 2010;56:1914–21. doi: 10.1016/j.jacc.2010.05.057. doi:10.1016/j.jacc.2010.05.057. [DOI] [PMC free article] [PubMed] [Google Scholar]
- 22.Raggi P, Boulay A, Chasan-Taber S, Amin N, Dillon M, Burke SK, et al. Cardiac calcification in adult hemodialysis patients. A link between end-stage renal disease and cardiovascular disease? Journal of the American College of Cardiology. 2002;39:695–701. doi: 10.1016/s0735-1097(01)01781-8. [DOI] [PubMed] [Google Scholar]
- 23.McCullough PA, Sandberg KR, Dumler F, Yanez JE. Determinants of coronary vascular calcification in patients with chronic kidney disease and end-stage renal disease: a systematic review. Journal of nephrology. 2004;17:205–15. [PubMed] [Google Scholar]
- 24.Moe SM, Chen NX. Mechanisms of vascular calcification in chronic kidney disease. Journal of the American Society of Nephrology : JASN. 2008;19:213–6. doi: 10.1681/ASN.2007080854. doi:10.1681/ASN.2007080854. [DOI] [PubMed] [Google Scholar]
- 25.Haydar AA, Hujairi NM, Covic AA, Pereira D, Rubens M, Goldsmith DJ. Coronary artery calcification is related to coronary atherosclerosis in chronic renal disease patients: a study comparing EBCT-generated coronary artery calcium scores and coronary angiography. Nephrol Dial Transplant. 2004;19:2307–12. doi: 10.1093/ndt/gfh120. doi:10.1093/ndt/gfh120. [DOI] [PubMed] [Google Scholar]
- 26.Hoh CK. Clinical use of FDG PET. Nuclear medicine and biology. 2007;34:737–42. doi: 10.1016/j.nucmedbio.2007.07.001. doi:10.1016/j.nucmedbio.2007.07.001. [DOI] [PubMed] [Google Scholar]
- 27.Gallagher BM, Fowler JS, Gutterson NI, MacGregor RR, Wan CN, Wolf AP. Metabolic trapping as a principle of oradiopharmaceutical design: some factors resposible for the biodistribution of [18F] 2-deoxy-2-fluoro-D-glucose. Journal of nuclear medicine : official publication, Society of Nuclear Medicine. 1978;19:1154–61. [PubMed] [Google Scholar]
- 28.Gerich JE, Meyer C, Woerle HJ, Stumvoll M. Renal gluconeogenesis: its importance in human glucose homeostasis. Diabetes care. 2001;24:382–91. doi: 10.2337/diacare.24.2.382. [DOI] [PubMed] [Google Scholar]
- 29.Laffon E, Cazeau AL, Monet A, de Clermont H, Fernandez P, Marthan R, et al. The effect of renal failure on 18F-FDG uptake: a theoretic assessment. Journal of nuclear medicine technology. 2008;36:200–2. doi: 10.2967/jnmt.107.049627. doi:10.2967/jnmt.107.049627. [DOI] [PubMed] [Google Scholar]


