Abstract
Almost all clinical laboratory tests use objective, quantitative measures of quality control (QC), incorporating Levey-Jennings analysis and Westgard rules. Clinical immunohistochemistry (IHC) testing, in contrast, relies on subjective, qualitative QC review. The consequences of using Levey-Jennings analysis for QC assessment in clinical IHC testing are not known. To investigate this question, we conducted a 1-2 month pilot test wherein the QC for either HER-2 or progesterone receptor (PR) in 3 clinical IHC laboratories was quantified and analyzed with Levey-Jennings graphs. Moreover, conventional tissue controls were supplemented with a new QC comprised of HER-2 or PR peptide antigens coupled onto 8-micron glass beads. At institution 1, this more stringent analysis identified a decrease in the HER-2 tissue control that had escaped notice by subjective evaluation. The decrement was due to heterogeneity in the tissue control itself. At institution 2, we identified a one-day sudden drop in the PR tissue control, also undetected by subjective evaluation, due to counterstain variability. At institution 3, a QC shift was identified, but only with one of two controls mounted on each slide. The QC shift was due to use of the instrument’s selective reagent drop zones dispense feature. None of these events affected patient diagnoses. These case examples illustrate that subjective QC evaluation of tissue controls can detect gross assay failure but not subtle changes. The fact that QC issues arose from each site, and in only a pilot study, suggests that immunohistochemical stain variability may be an under-appreciated problem.
Keywords: Quality control, immunohistochemistry, Levey-Jennings, Image analysis, quantitative
INTRODUCTION
Laboratory quality control (QC) for clinical immunohistochemistry (IHC) testing is unique in the field of clinical laboratory testing. IHC QC for quantitative/semi-quantitative tests, such as HER-2, ER, and PR, is evaluated subjectively by microscopic evaluation of tissue-based controls. This is in contrast to the quantification that is typically required for QC in other types of clinical laboratories. For example, a serum glucose QC is an objective quantitative colorimetric measurement (i.e., optical density) of a fluid contained in a cuvette. Underscoring this difference is the absence of quantitative QC analytical tools, such as Levey-Jennings analysis, in the diagnostic IHC laboratory. Whereas Levey-Jennings charts are a standard of practice in many other types of clinical laboratories, they are unheard of in diagnostic IHC laboratories.
The reason most often provided for this practice is that IHC testing is qualitative or, at best, semi-quantitative. In other words, quantitative precision in IHC QC testing is not needed because the analytes being measured by IHC are themselves not expressed with a quantitative level of precision. Although this may seem reasonable on the surface, it is contrary to clinical laboratory practice in other types of qualitative testing. There is ample precedent for quantitative QC measurement in laboratory testing even when the test result is qualitative in nature, such as with test results that are either “positive” or “negative”. For example, many serologic tests (e.g., HCV, HIV, HAV) are described as either “reactive” or “non-reactive”. Nonetheless, quantitative QC (incorporating Levey-Jennings graphical analysis) is always used in those contexts. In fact, it is typically mandated by the test manufacturers’ FDA clearance and CLIA/CAP regulations. Even for qualitative tests, precision of measurement is important around the threshold for distinguishing a positive from a negative test result.
There are no reports to our knowledge describing whether imposing a higher level of precision on QC evaluation would be useful in clinical IHC laboratories. We believe that this is a first. This study is also unique in that two different types of IHC controls were used - - a conventional tissue control and a new, recently described, external test control comprising the formalin fixed peptide antigen bound to the surface of 8-micron glass beads.1 This new QC provided an independent measure to help understand the causes for tissue control anomalies.
From this initial 1 – 2 month study in three separate sites, unexpected sources of staining variability were identified. None of these sources of variability were appreciated at the time of staining by subjective evaluation. Rather, they were identified only afterwards, when all of the slides were quantified by image analysis and analyzed with Levey-Jennings graphs.
MATERIALS AND METHODS
Immunohistochemistry staining
IHC testing was performed at 3 large academic or commercial clinical laboratories - - Tufts Medical Center (Boston, MA), Beth Israel Deaconness Medical Center (Boston, MA), and PhenoPath Laboratories (Seattle, WA). The laboratories had different instrument vendors. Staining was performed per each laboratory’s usual practice. The laboratories used their routine quality control, comprised of one or more tissue sections from their paraffin block archives. Therefore, the tissue controls were fixed and processed in a similar fashion as patient tissue samples. For breast tumor controls, the cold ischemic time and formalin fixation times were monitored on each sample and conformed to the CAP/ASCO guidelines for breast biomarker analysis. Each laboratory used one control per batch. In each laboratory, tissue controls included samples that expressed low - intermediate levels of antigen.2 At institution 1, the HER-2 control comprised a tissue array that included a 3+, 1-2+, and a negative tissue core. Institution 2 used a PR control comprised of normal endometrium. The endometrial glands are PR-high whereas the stromal cells are PR-intermediate. Institution 3 used a PR control that was comprised of a low-intermediate expressing breast carcinoma. Tissue controls were evaluated as per each laboratory’s standard protocol. This involved inspection of the control(s) under the microscope and a subjective determination of acceptability. Acceptability was based on the expected staining pattern and intensity for that control.
An additional IHC control comprising antigen-coated beads was placed on the control slides. These have been described in a separate report and so are only briefly described here.1 The antigen-coated beads are comprised of formalin-fixed peptide antigens covalently attached to 8-micron glass beads. Like tissue sections, antigen-coated beads also require antigen retrieval for optimal staining. The immunochemistry of how peptide antigens are formalin fixed has been described elsewhere.3-5
The bead preparation actually includes beads of 2 different sizes – test beads and color standard beads. The test beads are approximately 8 microns in diameter and coated with formalin-fixed peptide antigen. Each test bead has only one type of peptide. We used a mixture of beads with several different IHC antigens (HER-2, ER, and PR), combined together in a suspension. There are also smaller beads in the suspension, measuring approximately 3 microns in diameter. These beads are permanently colored dark brown, regardless of the IHC staining procedure. The small size of these beads distinguishes them from the larger test beads. These smaller “color standard” beads serve as a color intensity photomicroscopy reference, for standardizing color intensity measurements regardless of the camera and microscope optical settings.
The antigen-coated beads were placed on the same slide as the batch tissue control prior to the beginning of each run so that both quality controls were stained with exactly the same set of reagents, under identical conditions. Each type of external control verifies the analytic aspect of the IHC stain, including antigen retrieval and immunostaining. Neither QC directly addresses pre-analytic variability, such as formalin fixation or tissue processing prior to microtomy.
Image analysis
Stain intensity of tissue sections was measured using Image J, with the plugins for ImmunoRatio (for ER/PR analysis) and ImmunoMembrane (for HER-2 analysis).6, 7 The antigen-coated beads were quantified using a custom algorithm embedded in MatLab.
HER-2 image quantification
The clinical image analysis programs for HER-2 measure different parameters than for ER or PR. HER-2 scoring in the ImmunoMembrane program (running in Image J) is based on both image intensity and “completeness” of staining around the circumference of tumor cells. These two independent scores are then summed, to create the conventional 0 – 3+ score. Of these parameters, we only used the image intensity score because it was the most relevant parameter for measuring stain efficacy.
PR image quantification
The ImmunoRatio image analysis program for ER and PR does not directly quantify image intensity. Rather, it measures the percentage of positively stained nuclei. Image intensity is (indirectly) measured insofar as a cell needs to have a sufficient image intensity so as to be considered stained.
Image quantification of antigen-coated beads
A custom algorithm embedded in MatLab was developed for quantification of the stained antigen-coated beads. Quantification involved measuring image intensity of the test beads and an internal color intensity standard. The internal color intensity standard is a brown-colored bead that is approximately half the size of the test beads. Consequently, it can be easily distinguished from the antigen-coated test beads. The color standard bead is brown regardless of immunohistochemical staining, thereby serving as a brown color intensity standard to normalize image intensity regardless of the settings for taking the photograph. Image intensity is expressed as a ratio of the image intensity of test beads divided by the image intensity of the color standard bead.
Data analysis
The mean QC value for each day was calculated from 3 – 4 images per tissue control. The data are expressed in the form of a Levey-Jennings graph.
RESULTS
This clinical experiment was conducted by measuring two types of daily IHC QC - - conventional tissue controls and antigen-coated beads, both mounted on the same microscope slide. Both were stained simultaneously, during each run. In each IHC laboratory, one analyte (HER-2 or PR) was measured. The tissue controls were processed and initially examined subjectively, as per the laboratory’s standard practice. Later, both types of controls were quantified by image analysis and graphed in a Levey-Jennings chart.
Institution 1: Sudden decrease in HER-2 stain intensity
Figure 1 illustrates the day-to-day staining consistency at Institution 1, as measured by HER-2 color intensity of the 3+ control. The upper panel describes the HER-2 stain intensity for tissue controls. The lower panel describes the HER-2 stain intensity for the antigen-coated beads (“IHControls”). The graphs demonstrate two points. First, there was an obvious instrument assay malfunction on October 29, easily detected even by subjective evaluation. Both the tissue controls and the antigen-coated beads were unstained on that day.
Figure 1.
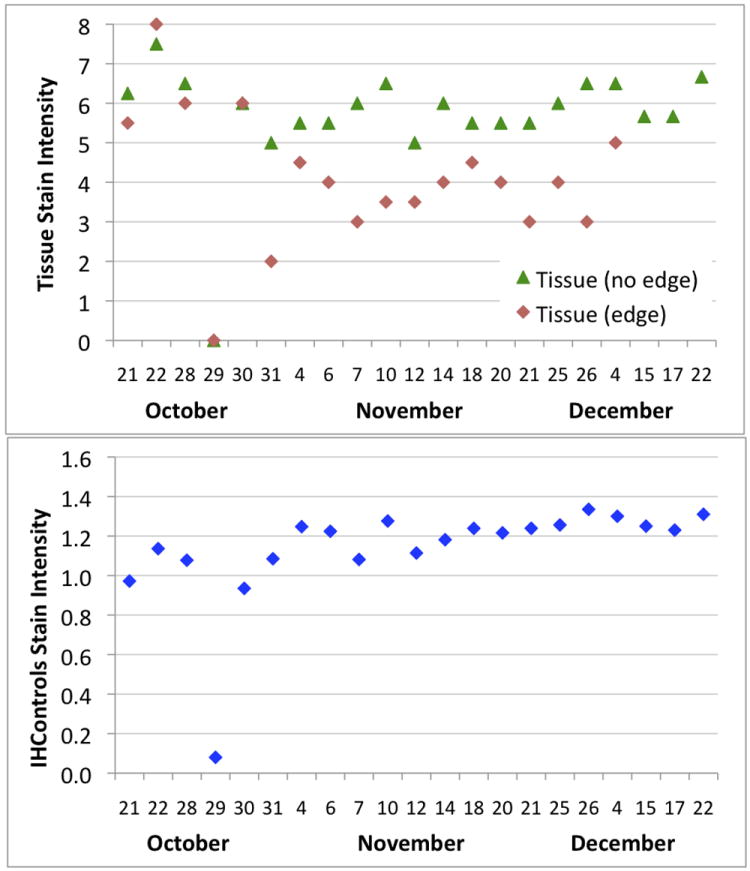
Levey-Jennings graphs at institution 1, monitoring HER-2 stain intensity day-to-day for tissue controls (upper panel) and antigen-coated beads (“IHControls”, lower panel). The October 29 run did not stain properly, as detected by both types of controls. The tissue controls’ stain intensity graph (upper panel) is stratified into two separate curves, segregating out an area of tissue at the edge of the section. These curves diverge, starting October 31. Each data point is the mean of a single quality control.
A more subtle, second point, is that the tissue section control HER-2 stain intensity unexpectedly decreased, starting on October 31. This was not noticed during the laboratory’s routine (subjective) inspection of QC. Investigation of the cause revealed that the staining of different portions of the tissue control diverged, starting on October 31. Out of 4 regions of the tumor used to generate a HER-2 stain intensity score, the decrease only affected 2 located at the very edge of the tissue. Two other islands of tumor, away from the tissue section edge, demonstrated consistently strong HER-2 staining. Therefore, the data were segregated based on their location within the tissue section control (Figure 1, upper panel). The data in Figure 1, upper panel, demonstrate that both areas of the tumor (“edge” and “no edge”) stained similarly at the beginning of the month. As deeper sections of the block were used, the HER-2+ tissue at the edge showed weaker staining, starting on October 31 (Figure 1, upper panel). Other internal HER-2+ tumor islands (not at the edge) remained relatively constant in their HER-2 expression (Figure 1, upper panel, “Tissue (no edge)”). The antigen-coated beads’ (Figure 1, lower panel) stain intensity remained relatively constant during this time.
Figure 2 illustrates representative photomicrographs of the two areas of the tissue control and the antigen-coated beads (“IHControls”) at 3 time points during the month. Figure 2, panels A, D, and G illustrates a robust baseline staining intensity (October 21) for a tumor nodule away from the edge (A), at the edge of the tissue section (D) and the antigen-coated beads (G). There is consistently strong HER-2 staining for the next several weeks on the tumor nodule away from the tissue section edge (B, C). There is also consistently strong HER-2 staining for the next several weeks on the antigen-coated beads (H, I). By contrast, the tumor nodule at the tissue section edge demonstrated diminished HER-2 expression (E, F) over the next several weeks, as deeper sections in the paraffin block were used. It is this lower HER-2 expression level that caused a downward shift in the Levey-Jennings curve (Figure 1, curve for “Tissue (edge)”).
Figure 2.
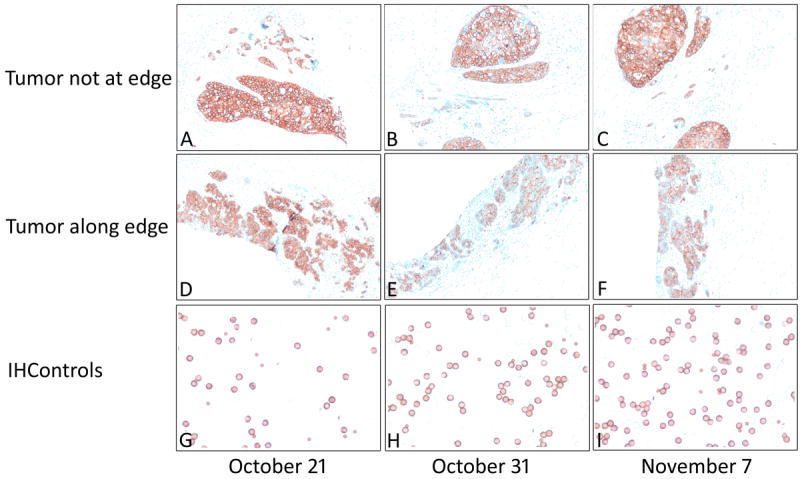
Photomicrographs of HER-2 control tissue (upper and middle panels) and antigen-coated beads (“IHControls”, lower panel) on 3 different days in 2014 (the specific dates as indicated along the lower margin). The photomicrographs depicted in the upper and middle panels are from the same tissue section but separated by several millimeters. Panels E and F show markedly lower staining. Original magnification for tissue controls 100X (upper panel) and for antigen-coated beads 400X (lower panel).
The fact that tumor nodules away from the edge demonstrated consistently strong staining supports the contention that no actual change in the HER-2 IHC assay occurred. The assay was functioning normally. The fact that the antigen-coated beads, located on the exact same slide, demonstrated consistent levels of staining throughout the month also supports this conclusion. There was also no change in the IHC procedure or reagent lot numbers that might explain a QC shift. For these reasons, we conclude that the downward QC shift in the tissue controls’ HER-2 stain intensity represents variability in the tissue control rather than the assay. HER-2 heterogeneity amongst the cells of a tumor is described in the literature.8, 9
Institution 2: Single day decrease in PR QC index
Progesterone receptor (PR) QC was monitored at a second institution during approximately the same time period (Figure 3). The percentage of PR+ cells was relatively consistent, between 70 – 90%, every day except for October 15. On that day, the mean percentage of PR+ cells was approximately 20% lower. This small aberration was not detected by routine (subjective) evaluation of the tissue control.
Figure 3.
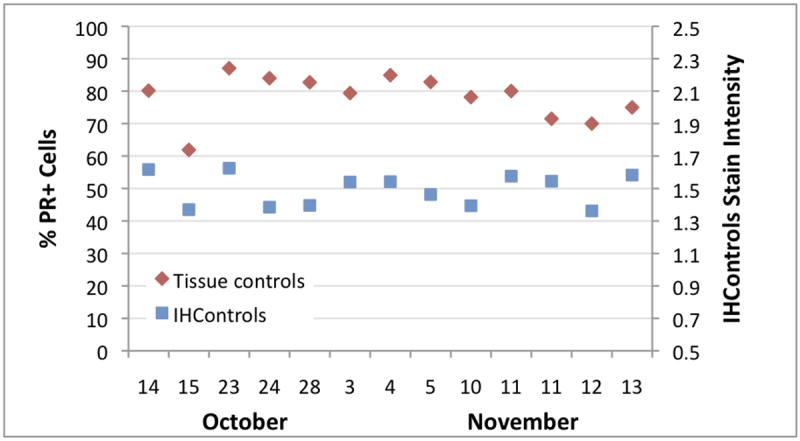
Levey-Jennings graph at institution 2, depicting the PR staining percentage (left-hand vertical axis) and antigen-coated beads PR stain intensity (“IHControls”, right-hand vertical axis) during October and November, 2014. Each data point is a single quality control, as per the routine for the laboratory’s operations. The drop in %PR+ cells on October 15 is due to increased counterstain intensity, not the immunostain itself. There is a slight decrease in the antigen-coated beads on that day relative to the day before and after, but the score is still within the mean ± 2SD for that parameter. Cellular PR staining of the tissue control for that day is strong.
Analysis of the tissue controls revealed that the dark brown PR stain intensity was approximately the same on October 15 as on other days (Figure 4). Cellular PR staining was still intense. The antigen-coated beads mounted on the same slide were also relatively unchanged (Figure 3, “IHControls”). The antigen-coated beads’ stain intensity on October 15 is within the month’s range for other days. In summary, the PR stain intensity for both the tissue controls and the antigen-coated beads were consistently strong; there was no detectable change in the PR immunohistochemical stain. There was, however, one striking difference about October 15 - - the counterstain was more intense (Figure 4). Consequently, the image analysis software identified more unstained (blue) cells. Increasing the number of unstained cells lowered the PR+ percentage by approximately 20 points. Since the PR+ percentage calculation includes both PR+ and PR- cells, the counterstain intensity affected that measurement. Without quantification, the increased counterstain intensity would have gone unnoticed.
Figure 4.
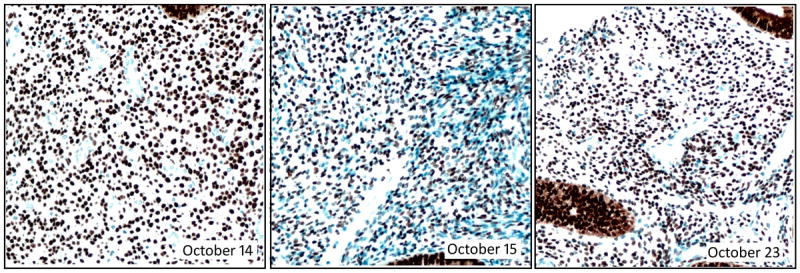
Photomicrographs of the PR control (normal endometrium) from 3 consecutive days of PR staining. The dates (in 2014) are indicated with each photomicrograph. The October 15 image shows a markedly stronger counterstain, highlighting many more unstained cells than the preceding or subsequent days. Magnification 200X.
Institution 3: Drop in PR antigen-coated bead intensity
There was a dramatic drop in PR staining indices on November 5 (Figure 5). This change included both types of PR QC, tissue and antigen-coated beads. This finding usually suggests an instrument or assay malfunction. As chance would have it, there was a temporary change in personnel operating the instrument starting on November 5, raising suspicion of an operator error. As it turned out, the answer was more complex.
Figure 5.
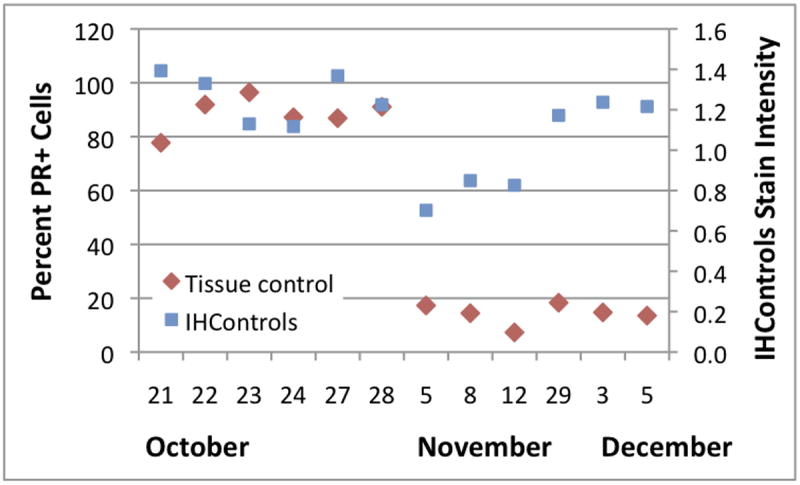
Levey-Jennings graph at institution 3, depicting the PR staining percentage (left-hand vertical axis) and antigen-coated beads’ PR stain intensity (“IHControls”, right-hand vertical axis) during October - December, 2014. Each data point is a single quality control, derived from the mean of 3 - 4 images.
Investigation revealed that the percentage of PR+ cells precipitously dropped on November 5 (Figure 5) because the new instrument operator started a new PR tissue control. This change had been planned. It was coincidental that it occurred at the same time as when the regular operator was temporarily absent. The new PR control was a low-positive breast carcinoma. The percentage of PR+ cells in the new tissue control was within its expected range. The drop in the PR staining intensity for the antigen-coated beads (Figure 5, “IHControls”) was, however, unexplained. On November 29, the antigen-coated beads’ stain intensity returned to its initial (higher) baseline, coincident with when the regular instrument operator returned.
The cause of the antigen-coated beads’ transient shift downwards could not be definitively determined in retrospect. However, we believe that the cause was associated with what is considered an acceptable alternative mode of operating the IHC instrument. To conserve reagent, the instrument allows the user to define 3 different reagent drop zones on the microscope slide. Reagent can be dispensed to any or all of the zones. If the patient sample is small, reagent can be conserved by dispensing less, only to a single zone, where the sample is mounted. The replacement instrument operator used this feature and decreased the reagent dispense, conserving reagent. The antigen-coated beads were mounted off to one side, not immediately adjacent to the tissue control, and the replacement operator did not notice. Some antibody reagent diffused over to the antigen-coated beads, but the lower concentration caused a downward shift in stain intensity.
DISCUSSION
Levey-Jennings analysis of IHC QC stain intensity is an uncommon, probably rare, practice for clinical immunohistochemistry laboratories. This impression is supported by recently published consensus guidelines for positive IHC controls, which make no mention of Levey-Jennings graphical analysis.2 Since this more rigorous type of quantitative analysis has not been applied to diagnostic IHC laboratories, we conducted a pilot test with 3 sites. At the outset, we expected to find no QC outliers. With a well-controlled assay, the use of Levey-Jennings graphical analysis coupled with (for example) a 1-2s Westgard rule will be expected to flag approximately 5% of assays as requiring further investigation.10 The use of other Westgard rules (e.g., 1-3s) should flag even fewer. Since there was only a 5% probability of a false positive QC outlier, we were surprised to encounter QC outliers at all 3 sites. None of these outliers were previously appreciated by routine subjective analysis. This finding demonstrates that new sources of analytical variability are identified if Levey-Jennings analysis is applied.
None of the QC outliers from the 3 institutions were of a magnitude or nature that affected patient diagnoses. At institution 1, the HER-2 assay was always functioning properly; the subtle decrease in the HER-2 tissue control stain intensity was an artifact of the control. At institution 2, a 20% change in PR percentages (October 15, Figure 3) due to a more robust counterstain did not affect patient management because no patient test results were close to the threshold for positivity. At institution 3, there was no change in tissue control stain intensity. The operator correctly programmed the IHC instrument for placement in the appropriate location for tissue sections. It was the antigen-coated beads that were missed by using selective reagent drop zones. Although none of these affected the clinical diagnosis, they represent potential risks that, in other circumstances, may have a greater impact.
The fact that small deviations in the positive controls’ staining were missed was not due to the nature of the controls themselves. The tissue controls were serving their expected role, since the deviations were readily identified when examined by image analysis. Moreover, we believe that the tissue controls were all examined with appropriate care as part of routine QC verification, as per common practice in the field of diagnostic IHC. An important finding is that without actually recording a quantitative value (i.e., Levey-Jennings charting), it is not possible to discern these subtle changes solely based on visual inspection.
The October 29th data point from institution 1 (Figure 1) depicts the most common use of IHC quality control. Gross assay failure is readily detected by visual examination of the controls, without quantification. A more salient question is whether detection of the downward tissue control shift that started on October 31 (Figure 1) was helpful. Does it matter for patient care? In the future, is this the magnitude of staining decrement that ought to be detected? Since the QC shift ultimately proved to be due to variability in the tissue control and not the HER-2 stain, quantification would not have changed patient test results. Nonetheless, we propose that it does matter. Awareness of factors affecting an assay is inherently important. Recognition of even small QC shifts is the first step in detecting early failure, before patient test results are affected. Levey-Jennings analysis permits the laboratory staff an opportunity to identify the problem early on and take corrective action, if warranted. Without monitoring the assay and investigating the cause of QC shifts, one cannot know if the assay parameters changed. It is also a standard of care in other types of laboratory in vitro diagnostic testing. The fact that no corrective action would have been needed in this instance is beside the point.
The QC data from institution 2 highlight the importance of the counterstain. Counterstain intensity is relevant when the percentage of stained cells is measured, such as for ER or PR. The counterstain helps identify unstained cells, which is part of the denominator when calculating the percentage. In this instance, the stronger counterstain on October 15 (Figure 3) increased the apparent number of unstained cells, rendering the PR+ percentage approximately 20 points lower. The cause of the change in the counterstain could not be determined; too much time had passed at the time the quantification was done. This finding also highlights the importance of something as seemingly mundane as the counterstain when trying to standardize measurements between institutions.
The QC data from institution 3 spotlight the question of permitting small deviations in an institution’s standard operating procedure. Changing the amount of reagent dispensed, and the reagent drop zones on a slide, represents a small procedural change. Use of this feature is within the manufacturer’s recommended guidelines. Moreover, the use of varying reagent volumes, depending on the slide, has (to our knowledge) never been questioned in the literature. When using the feature, proper performance of the immunohistochemical stain is dependent on the instrument operator making a correct assessment of the test sample’s location relative to the instrument’s pre-programmed reagent drop zones. The decrease in the antigen-coated beads stain intensity in November (Figure 5) is believed to be due to a different instrument operator electing to use selective reagent drop zones. Since the antigen-coated beads were off to the side, the lower reagent concentration reaching them registered as a lower stain intensity.
Although quantitative assessment of daily QC is probably relatively rare, IHC practice guidelines are evolving in that direction. Canadian IHC practice guidelines specify daily record keeping of the IHC controls test results.11 ASCO/CAP guidelines for ER/PR are similar and raise at least the possibility of using image analysis for measuring daily QC. Specifically, controls “should be scored and recorded daily (percent positive tumor cells and intensity of staining) using laboratory standard scoring system or image analysis.”12
The HER-2 and PR antigen-coated beads served a useful and novel supplementary role in this study. When faced with a change in the QC tissue control readout, the beads’ stain intensity helped us distinguish true variability in the assay from variability in the control tissue. For example, HER-2 tissue control variability was more quickly identified at Institution 1 (Figure 1) because the HER-2 coated bead stain intensity was unchanged over time. This study does not speak to one control being superior to the other. Both have their relative advantages and disadvantages, summarized elsewhere.1 When commercialized, the antigen-coated beads may find use as easy-to-use on-slide controls, as a supplement to conventional tissue batch controls.
In this study, Levey-Jennings analysis from each institution highlighted a different quality issue. However, the most striking observation from the study was that QC quantification raised questions at each of the 3 sites. Levey-Jennings review of other types of clinical assays, such as in Clinical Chemistry, typically raise concerns on approximately 5% of the time.10 For a pilot study with a small number of sites, monitored for 1-2 months, this high rate (3/3) is extraordinary. In each instance, standard visual inspection of the controls raised no suspicions. These findings raise the concern that subjective analysis of immunohistochemical stain QC may not be sufficiently sensitive in detecting staining problems. Moreover, the data may justify a broader study of diagnostic IHC laboratories, increasing both the number of assays and the number of participating laboratories that are analyzed using Levey-Jennings graphical analysis.
Acknowledgments
The authors wish to gratefully acknowledge the technical support of Mr. Brandon Seaton and Mr. Kwadwo Kwaa for incorporating the new antigen-coated bead controls on their daily quality control slides. Research reported in this publication was supported by the National Cancer Institute and the National Center for Advancing Translational Sciences, both of the National Institutes of Health, under award numbers 1R44CA183203-1 and UL1TR001064.
Footnotes
Conflicts of interest: KV, SRS, and SAB have a patent interest in the antigen-coated glass beads technology, which is included as a secondary quality control along with tissue controls. SN, JG, and RF declare no conflicting interests.
References
- 1.Sompuram S, Vani K, Tracey B, et al. Standardizing immunohistochemistry: A new reference control for detecting staining problems. J Histochem Cytochem. 2015 doi: 10.1369/0022155415588109. In press. [DOI] [PMC free article] [PubMed] [Google Scholar]
- 2.Torlakovic E, Nielsen S, Francis G, et al. Standardization of positive controls in diagnostic immunohistochemistry: Recommendations from the international ad hoc expert committee. Appl Immunohisochem Mol Morph. 2015;23:1–18. doi: 10.1097/PAI.0000000000000163. [DOI] [PubMed] [Google Scholar]
- 3.Bogen S, Vani K, Sompuram S. Molecular Mechanisms of Antigen Retrieval: Antigen Retrieval Reverses Steric Interference Caused By Formalin-Induced Crosslinks. Biotechnic & Histochem. 2009;84:207–15. doi: 10.3109/10520290903039078. [DOI] [PMC free article] [PubMed] [Google Scholar]
- 4.Sompuram S, Vani K, Bogen S. A Molecular Model of Antigen Retrieval Using a Peptide Array. Am J Clin Pathol. 2006;125:91–8. [PubMed] [Google Scholar]
- 5.Sompuram S, Vani K, Hafer L, et al. Antibodies Immunoreactive With Formalin-Fixed Tissue Antigens Recognize Linear Protein Epitopes. Am J Clin Pathol. 2006;125:82–90. [PubMed] [Google Scholar]
- 6.Tuominen V, Tolonen T, Isola J. Immunomembrane: A publicly available web application for digital image analysis of HER2 immunohistochemistry. Histopathology. 2012;60:758–67. doi: 10.1111/j.1365-2559.2011.04142.x. [DOI] [PubMed] [Google Scholar]
- 7.Tuominen V, Ruotoistenmaki S, Viitanen A, et al. ImmunoRatio: A publicly available web application for quantitative image analysis of estrogen receptor (ER), progesterone receptor (PR), and Ki-67. Breast Cancer Research. 2010;12:R56. doi: 10.1186/bcr2615. [DOI] [PMC free article] [PubMed] [Google Scholar]
- 8.Vance G, Barry T, Bloom K, et al. Genentic heterogeneity in HER2 testing in breast cancer: panel summary and guidelines. Arch Pathol Lab Med. 2009;133:611–2. doi: 10.5858/133.4.611. [DOI] [PubMed] [Google Scholar]
- 9.Perez E, Press M, Dueck A, et al. Immunohistochemistry and fluorescence in situ hybridization assessment of HER2 in clinical trials of adjuvant therapy for breast cancer (NCCTG N9831, BCIRG 006, BCIRG 005) Breast Cancer Res Treat. 2013;138:99–108. doi: 10.1007/s10549-013-2444-y. [DOI] [PMC free article] [PubMed] [Google Scholar]
- 10.Westgard J. Basic QC practices : Training in statistical quality control for healthcare laboratories. 2. Madison, WI: Westgard QC, Inc; 2002. [Google Scholar]
- 11.Torlakovic E, Riddell R, Banerjee D, et al. Canadian Association of Pathologists–Association canadienne des pathologistes National Standards Committee/Immunohistochemistry: Best Practice Recommendations for Standardization of Immunohistochemistry Tests. Am J Clin Pathol. 2010;133:354–65. doi: 10.1309/AJCPDYZ1XMF4HJWK. [DOI] [PubMed] [Google Scholar]
- 12.Hammond M, Hayes D, Allred D, et al. American Society of Clinical Oncology/College of American Pathologists Guideline Recommendations for Immunohistochemical Testing of Estrogen and Progesterone Receptors in Breast Cancer. J Clin Oncol. 2010;28:2784–95. doi: 10.1200/JCO.2009.25.6529. [DOI] [PMC free article] [PubMed] [Google Scholar]


